Benchmarking Air Emissions - Of the 100 Largest Electric Power Producers in the United States - MJ Bradley ...
←
→
Page content transcription
If your browser does not render page correctly, please read the page content below
Benchmarking Air Emissions
                       Of the 100 Largest Electric Power Producers in the United States

                       July 2021
                       Data Downloads at: www.mjbradley.com

                       Contributors:

Benchmarking Air Emissions of the 100 Largest Electric Power Producers in the United States
Data tables and maps at: www.mjbradley.com
July 2021
Preface
   The 2021 Benchmarking report is the 17th collaborative effort highlighting environmental performance and progress in the nati on’s
   electric power sector. The Benchmarking series began in 1997 and uses publicly reported data to compare the emissions
   performance of the 100 largest power producers in the United States. The company rankings are based on 2019 generation and
   emissions data and aggregate industry trends are presented through 2020.
   Data on U.S. power plant generation and air emissions are available to the public through several databases maintained by sta te
   and federal agencies. Publicly- and privately-owned electric generating companies are required to report fuel and generation data
   to the U.S. Energy Information Administration (EIA). Most power producers are also required to report air pollutant emissions data
   to the U.S. Environmental Protection Agency (EPA). These data are reported and recorded at the boiler, generator, or plant l evel,
   and must be combined and presented so that company-level comparisons can be made across the industry.
   The Benchmarking report facilitates the comparison of emissions performance by combining generation and fuel consumption data
   compiled by EIA with emissions data on sulfur dioxide (SO 2), nitrogen oxides (NOx), carbon dioxide (CO2) and mercury (Hg)
   compiled by EPA; error checking the data; and presenting emissions information for the nation’s 100 largest power producers in a
   graphic format that aids in understanding and evaluating the data. The report is intended for a wide audience, including ele ctric
   industry executives, environmental advocates, financial analysts, investors, journalists, power plant managers, and public
   policymakers.

   Report Authors: Christopher Van Atten, Amlan Saha, Luke Hellgren, Ted Langlois

   For questions or comments about this report, please contact:
   Christopher Van Atten
   M. J. Bradley & Associates LLC
   47 Junction Square Drive
   Concord, MA 01742, USA
   Telephone: +1 978 369 5533
   E-mail: vanatten@mjbradley.com

   Plant and company level data used in this report are available at www.mjbradley.com.

Benchmarking Air Emissions of the 100 Largest Electric Power Producers in the United States
Data tables and maps at: www.mjbradley.com
July 2021                                                                                                                               2

Key Findings
  •    The 100 largest power producers in the United States
       own nearly 3,500 power plants and account for more than
       80 percent of the sector’s electric generation and reported
       air emissions. Their fuel mix, emissions, and emission
       rates vary widely as summarized throughout this report
       (based on 2019 data).
  •    For the electric sector overall, in 2020, power plant SO 2
       and NOx emissions were 95 percent and 88 percent
       lower, respectively, than in 1990 when Congress passed
       major amendments to the Clean Air Act. In 2020, power
       plant SO2 and NOx emissions were 18 percent and 15                                     Download plant level data from the 2021
                                                                                              Benchmarking Air Emissions report at:
       percent lower than they were in 2019.                                                  www.mjbradley.com

  •    Power sector CO2 emissions decreased about 10 percent
       between 2019 and 2020. In 2020, power plant CO 2
                                                                                               Electricity in the United States
       emissions were 20 percent lower than 1990 levels, and
       about 40 percent lower than their peak in 2007. Some of                                 The electricity sector in the United States includes a
       the factors driving this longer-term trend include energy                               wide array of companies that produce and distribute
       efficiency improvements and the displacement of coal by                                 electricity to homes and offices, industrial facilities,
       natural gas and renewable energy resources.                                             and other customers. The services it provides are
                                                                                               essential to the growth and functioning of the U.S.
  •    Mercury air emissions from power plants (as reported to                                 economy. Electricity is expected to serve a growing
       the TRI database) have decreased 92 percent since                                       share of energy consumption in the U.S. with the
       2000. The first-ever federal limits on mercury and other                                electrification of transportation and other end-uses.
       hazardous air pollutants from coal-fired power plants went
       into effect in 2015.

Benchmarking Air Emissions of the 100 Largest Electric Power Producers in the United States
Data tables and maps at: www.mjbradley.com
July 2021                                                                                                                                                 3
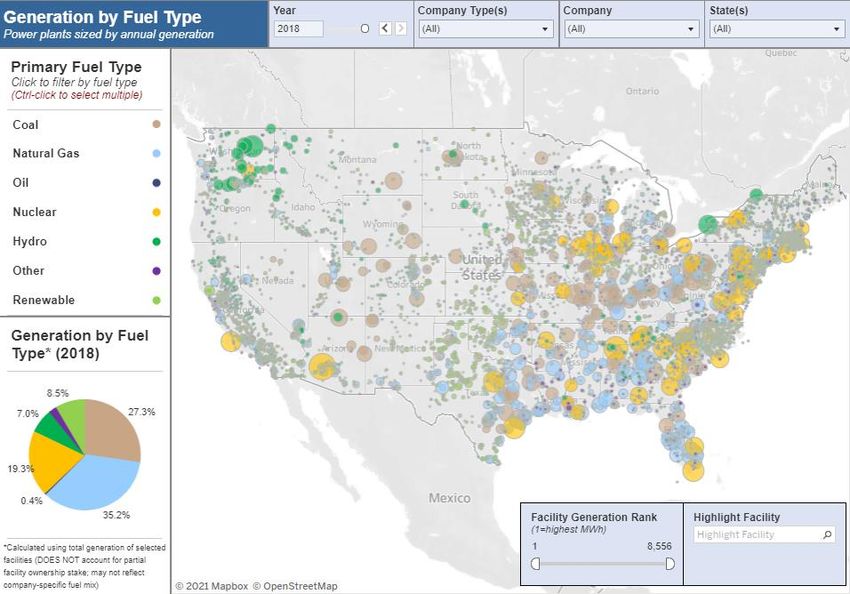
Benchmarking Analytical Resources
   The Benchmarking Report now includes a series of interactive, web-
   based dashboards to further visualize the emissions and electricity
   generation from power producers in the United States. These tools
   provide insight into how facility- and company-level emissions and
   generation are changing over time by utilizing historical Benchmarking
   data (2008-2019). Data include:
   Environmental: Company-specific emissions and emission rates by
   company type and pollutant                                                                 Environmental
   Operational: Electricity generation and relevant data aggregated by
   company type, company, and other metrics

   Locational: Facility-level emissions and generation visualized by fuel
   type, company ownership, and other metrics

   These tools are available at www.mjbradley.com.

                             Operational                                                         Spatial

Benchmarking Air Emissions of the 100 Largest Electric Power Producers in the United States
Data tables and maps at: www.mjbradley.com
July 2021                                                                                                     4
Section I

   U.S. Electric Sector Highlights

Benchmarking Air Emissions of the 100 Largest Electric Power Producers in the United States
Data tables and maps at: www.mjbradley.com
July 2021                                                                                     5
U.S. Generation by Fuel Type

   •     In 2020, the U.S. electric system continued                                             U.S. Electricity Generation by Fuel Type* (2020)
         its general shift away from coal toward lower-
         and zero-emitting sources. For the fourth
         consecutive year, natural gas was the
         leading source of electricity generation in the
         U.S. (40 percent), followed by nuclear (20
         percent).
   •     Coal plants accounted for 19 percent of total
         U.S. generation, hydroelectric resources 7
         percent, and oil-fired resources
Share of Emissions by Sector

      Share of Emissions: U.S. Electric Sector and Other Sectors

                                                                                                                                                            All Other Sectors

                                                                                                                                                            Other Leading Sector

                                                                                                                                                            Electric Sector

                    Carbon Dioxide                    Sulfur Dioxide                  Nitrogen Oxides                        Mercury
                        (CO2)                             (SO2)                            (NOx)                              (Hg)
                            Other                            Other                            Other                             Other
                        Transportation                     Industrial                     Transportation                       Electric
                           Electric                         Electric                         Electric

   * Most recent sector-wide data
   Sources: U.S. Environmental Protection Agency Air Pollutant Emissions Trend Data (March 2021). Mercury data from 2019 TRI National Analysis (October 2020).

Benchmarking Air Emissions of the 100 Largest Electric Power Producers in the United States
Data tables and maps at: www.mjbradley.com
July 2021                                                                                                                                                                       7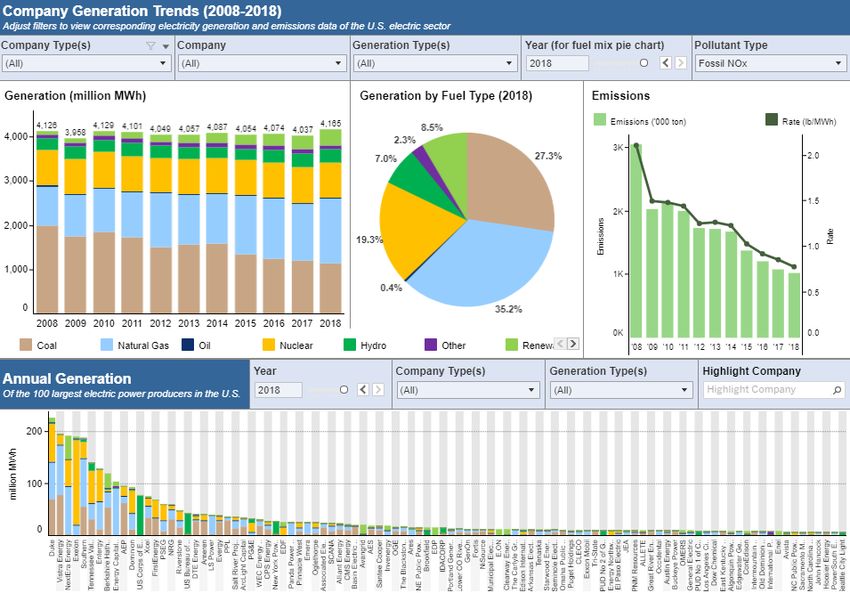
Section II

   Emissions of the 100 Largest Electric Power Producers

Benchmarking Air Emissions of the 100 Largest Electric Power Producers in the United States
Data tables and maps at: www.mjbradley.com
July 2021                                                                                     8
The 100 Largest Electric Power Producers
 The report examines and compares the stack air pollutant emissions of the 100 largest power producers in the United States based on their 2019 generation, plant
 ownership, and emissions data. The table below lists the 100 largest power producers featured in this report ranked by their total electricity generation from fossil
 fuel, nuclear, and renewable energy facilities. These producers include public and private entities (collectively referred to as “companies” or “producers” in this
 report) that own nearly 3,500 power plants and account for 82 percent of reported electric generation and 81 percent of the industry’s reported emissions.
 The report focuses on four power plant pollutants for which public emissions data are available: sulfur dioxide (SO2), nitrogen oxides (NOx), mercury (Hg), and
 carbon dioxide (CO2). At sufficient concentrations, these pollutants are associated with significant environmental and public health problems, including acid
 deposition, mercury deposition, nitrogen deposition, global warming, ground-level ozone, regional haze, and/or fine particle air pollution, which can lead to asthma
 and other respiratory illnesses. The report benchmarks, or ranks, each company’s absolute emissions and its emission rate (determined by dividing emissions by
 electricity produced) for each pollutant. In 2019, the 100 largest power producers emitted in aggregate approximately 0.96 million tons of SO2, 0.88 million tons of
 NOx, 3.63 tons of mercury, and 1.78 billion tons of CO2.

                                    2019 MWh                                        2019 MWh                                           2019 MWh                                        2019 MWh
   RANK       PRODUCER NAME          (million)   RANK        PRODUCER NAME            (million)   RANK       PRODUCER NAME              (million)   RANK        PRODUCER NAME            (million)
     1    Duke                        213.6       26    WEC Energy Group               30.8        51    Portland General Electric       15.7        76    Austin Energy                   9.3
     2    NextEra Energy              204.4       27    LS Pow er                      30.3        52    IDACORP                         15.3        77    Energy Northw est               9.1
     3    Exelon                      184.0       28    EDF                            30.3        53    Brookfield                      14.3        78    Arkansas Electric Coop          9.0
     4    Southern                    182.9       29    Invenergy                      28.2        54    Enel                            13.8        79    Omaha Public Pow er District 9.0
     5    Vistra Energy               177.3       30    New York Pow er Authority      27.9        55    Edison International            13.6        80    JEA                             9.0
     6    Tennessee Valley Authority 140.3        31    Associated Electric Coop       26.2        56    Puget Holdings                  13.4        81    Buckeye Pow er                  8.8
     7    Entergy                     128.0       32    Pinnacle West                  25.9        57    Low er CO River Authority       13.3        82    Algonquin Pow er                8.6
     8    Dominion                    118.3       33    Oglethorpe                     25.4        58    Tenaska                         13.0        83    Argo Infrastructure Partners 8.6
     9    Berkshire Hathaw ay Energy 115.9        34    Global Infrastructure Partners 25.4        59    The Carlyle Group               12.7        84    Great River Energy              8.5
    10    Energy*Capital Partners     104.5       35    CPS Energy                     25.2        60    Exxon Mobil                     12.2        85    PUD No 2 of Grant County        8.2
    11    AEP                          92.7       36    Panda Pow er Funds             23.9        61    Municipal Elec. Auth. of GA     12.1        86    International Paper             8.0
    12    Xcel                         77.2       37    CMS Energy                     23.8        62    RWE Group                       11.9        87    TransAlta                       7.7
    13    US Corps of Engineers        74.2       38    Emera                          23.1        63    Fortis                          11.2        88    ALLETE                          7.7
    14    FirstEnergy                  61.9       39    Alliant Energy                 23.0        64    Seminole Electric Coop          10.8        89    PUD No 1 of Chelan County       7.6
    15    PSEG                         56.9       40    CLECO                          21.3        65    Occidental                      10.7        90    Intermountain Pow er Agency 7.6
    16    NRG                          46.5       41    Avangrid                       20.8        66    Caithness Energy                10.6        91    Avista                          7.4
    17    DTE Energy                   41.0       42    Basin Electric Pow er Coop     19.1        67    NiSource                        10.3        92    NC Public Pow er                7.3
    18    ArcLight Capital             38.3       43    Starw ood Energy               19.1        68    El Paso Electric                10.2        93    NextEra Energy Partners         7.3
    19    Riverstone                   37.8       44    AES                            18.3        69    OMERS                           10.1        94    Capital Pow er                  7.1
    20    Evergy                       37.6       45    Santee Cooper                  17.7        70    PNM Resources                   10.1        95    Old Dominion Electric Coop      7.0
    21    US Bureau of Reclamation     36.5       46    NE Public Pow er District      17.0        71    Tri-State                       10.0        96    Sacramento Municipal Util Dist 6.8
    22    Ameren                       35.4       47    The Blackstone Group           16.9        72    Dow Chemical                     9.8        97    North Carolina EMC              6.8
    23    PPL                          34.1       48    Ares                           16.5        73    John Hancock                     9.7        98    Cooperative Energy              6.7
    24    PG&E                         33.8       49    OGE                            16.0        74    Los Angeles City                 9.6        99    Itochu                          6.7
    25    Salt River Project           32.1       50    EDP                            15.9        75    ConEdison                        9.4        100   East Kentucky Pow er Coop       6.7

Benchmarking Air Emissions of the 100 Largest Electric Power Producers in the United States
Data tables and maps at: www.mjbradley.com
July 2021                                                                                                                                                                                            9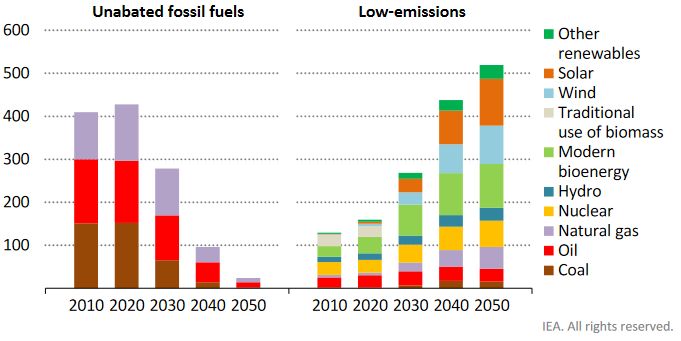
100
150
200
250
0
50
-50
Duke
NextEra Energy
July 2021
Exelon
Southern
Vistra Energy
Tennessee Valley Authority
Entergy
Dominion
Berkshire Hathaway Energy
Energy Capital Partners
AEP
Xcel
US Corps of Engineers
FirstEnergy
PSEG
NRG
DTE Energy
ArcLight Capital
Riverstone
Evergy
US Bureau of Reclamation
Data tables and maps at: www.mjbradley.com
Ameren
PPL
PG&E
Salt River Project
WEC Energy Group
LS Power
EDF
Invenergy
New York Power Authority
Associated Electric Coop
Pinnacle West
Oglethorpe
Global Infrastructure Partners
CPS Energy
Panda Power Funds
CMS Energy
Emera
Rankings by Generation
Alliant Energy
CLECO
Avangrid
Basin Electric Power Coop
Starwood Energy
AES
Santee Cooper
NE Public Power District
Breakdown of ownership categories provided in “Endnotes” (slide 47):
The Blackstone Group
Ares
OGE
EDP
Portland General Electric
IDACORP
Benchmarking Air Emissions of the 100 Largest Electric Power Producers in the United States
(million MWh)
Brookfield
Enel
Edison International
Puget Holdings
Lower CO River Authority
Tenaska
The Carlyle Group
Exxon Mobil
Municipal Elec. Auth. of GA
RWE Group
Fortis
Seminole Electric Coop
Occidental
privately/investor owned
Caithness Energy
NiSource
El Paso Electric
OMERS
PNM Resources
Tri-State
Dow Chemical
John Hancock
Los Angeles City
ConEdison
Austin Energy
public power
Energy Northwest
Arkansas Electric Coop
Generation of the 100 Largest Power Producers by Fuel Type (2019)
Omaha Public Power District
JEA
Buckeye Power
Algonquin Power
Argo Infrastructure Partners
Great River Energy
PUD No 2 of Grant County
Oil
International Paper
TransAlta
Coal
ALLETE
Hydro
cooperative
PUD No 1 of Chelan County
Nuclear
Intermountain Power Agency
Avista
NC Public Power
Natural Gas
NextEra Energy Partners
Capital Power
Old Dominion Electric Coop
Sacramento Municipal Util Dist
North Carolina EMC
Renewable/Other
Cooperative Energy
Itochu
10
East Kentucky Power Coop100
150
200
250
0
-50
50
Exelon
NextEra Energy
July 2021
Duke
Tennessee Valley Authority
US Corps of Engineers
Entergy
Dominion
Southern
US Bureau of Reclamation
Berkshire Hathaway Energy
FirstEnergy
PSEG
EDF
PG&E
New York Power Authority
AEP
Xcel
Vistra Energy
Riverstone
Avangrid
EDP
Data tables and maps at: www.mjbradley.com
Brookfield
Enel
RWE Group
DTE Energy
Ameren
NRG
Evergy
Edison International
Oglethorpe
Pinnacle West
Global Infrastructure Partners
Invenergy
Energy Capital Partners
Energy Northwest
CPS Energy
IDACORP
PUD No 2 of Grant County
PUD No 1 of Chelan County
NC Public Power
NextEra Energy Partners
NE Public Power District
Municipal Elec. Auth. of GA
ConEdison
North Carolina EMC
Salt River Project
Breakdown of ownership categories provided in “Endnotes” (slide 47):
El Paso Electric
OMERS
PNM Resources
Avista
Austin Energy
AES
Benchmarking Air Emissions of the 100 Largest Electric Power Producers in the United States
(million MWh)
ALLETE
John Hancock
Alliant Energy
Algonquin Power
Portland General Electric
Los Angeles City
Santee Cooper
Sacramento Municipal Util Dist
Rankings by Zero-Carbon Generation
Puget Holdings
WEC Energy Group
Old Dominion Electric Coop
ArcLight Capital
Starwood Energy
privately/investor owned
CMS Energy
Caithness Energy
OGE
Capital Power
LS Power
Cooperative Energy
Basin Electric Power Coop
Emera
Tenaska
TransAlta
Arkansas Electric Coop
and renewables.
public power
PPL
Lower CO River Authority
Zero-Carbon Generation of the 100 Largest Power Producers (2019)
Ares
Fortis
Tri-State
NiSource
East Kentucky Power Coop
Great River Energy
International Paper
Associated Electric Coop
Panda Power Funds
CLECO
cooperative
The Blackstone Group
The Carlyle Group
Exxon Mobil
generated power from zero-carbon
85 of the Top 100 power producers
Seminole Electric Coop
resources in 2019, accounting for 83
Occidental
Dow Chemical
percent of the national total generated
Omaha Public Power District
from resources including nuclear, hydro,
JEA
Buckeye Power
Argo Infrastructure Partners
Intermountain Power Agency
11
ItochuEmission Rankings
Important Note on Emission Rankings
The Benchmarking Report presents generation and emissions information of power producers, not distribution utilities that deliver electricity to customers. In
order to apply a uniform methodology to all power producers, the Report assigns electricity generation and associated emissions to power producers according
to their known generating asset ownership as of December 31, 2019. Assets retired or sold before this date are not allocated to power producers on a prorated
basis. For example, a company which retires a generating unit before this date will not see its generation reflected in the rankings. Similarly, company which
purchases a generating unit from another will take on the unit’s full output for the calendar year.
The above is true even when a producer’s generating facilities are part of one or more contractual agreements (e.g., power purchase contracts, etc.) with other
entities (often utilities). In other words, this Report attributes all generation and emissions to the owner of an asset, not to purchasers of the asset’s output or to
counterparties to the contracts. Publicly available data do not allow the accurate and exhaustive tracking of such agreements.
There are a host of reasons why a company’s generation profile may differ from that of the electricity it delivers to customers. For example, rural cooperatives,
which are non-profit entities and are thus generally unable to directly take advantage of renewable tax credits, tend to rely on power purchase agreements and
other non-asset owning mechanisms to deliver renewable electricity to their customers.
A vertically integrated utility that owns a large fossil generating fleet, but also delivers purchased renewable electricity to its customers, might have lower
average emission rates than the level attributed in this report to the power producer that owns the said fossil fleet, if the renewable energy purchases were
factored into the utility’s performance. By the same token, the utility’s emissions or emission rate would increase if it contracted with a higher emitting facility or
relied on market purchases with associated emissions.
The charts in the next few slides present both the total emissions by company as well as their average emission rates. The evaluation of
emissions performance by both emission levels and emission rates provides a more complete picture of relative emissions performance than
viewing these measures in isolation. Total emission levels are useful for understanding each producer’s contribution to overall emissions
loading, while emission rates are useful for assessing how electric power producers compare according to emissions per unit of energy
produced when size is eliminated as a performance factor.
The charts illustrate significant differences in the total emission levels and emission rates of the 100 largest power producers. For example, CO2
emissions range from zero to over 109 million short tons per year. The NOx emission rates range from zero to 2.4 pounds per megawatt-hour of
generation. A power producer’s total emissions are influenced by the amount of generation that the producer owns and by the fuels and
technologies that it uses to generate electricity.
Benchmarking Air Emissions of the 100 Largest Electric Power Producers in the United States
Data tables and maps at: www.mjbradley.com
July 2021 12Emission Contributions
SO2 NOx Mercury (Hg) CO2
(million ton) (million ton) (ton) (billion ton)
100% 0.96 0.88 3.63 1.78
Percent of industry emissions
100 largest producers
83% 81% 81% 81%
No. of producers
75% 28 48 36 56
50% 10 16 11 17
25% 3 4 3 5
Air pollution emissions from power plants are highly concentrated among a small number of
producers. For example, nearly a quarter of the electric power industry’s SO 2 and CO2
emissions are emitted by just three and five top 100 producers, respectively.
Benchmarking Air Emissions of the 100 Largest Electric Power Producers in the United States
Data tables and maps at: www.mjbradley.com
July 2021 13CO2: Total Emissions and Emission Rates
Sorted from highest to lowest by emissions
113,997
113,769
113,541
113,313
113,085
112,857
112,629
112,401
112,173
111,945
111,717
111,489
111,261
111,033
110,805
110,577
110,349
110,121
109,893
109,665
109,437
109,209
108,981
108,753
108,525
108,297
108,069
107,841
107,613
107,385
107,157
106,929
106,701
106,473
106,245
106,017
105,789
105,561
105,333
105,105
104,877
104,649
104,421
104,193
103,965
103,737
103,509
103,281
103,053
102,825
102,597
102,369
102,141
101,913
101,685
101,457
101,229
101,001
100,773
100,545
100,317
100,089
99,861
99,633
99,405
99,177
98,949
98,721 Other
98,493
98,265
98,037
97,809
97,581
97,353
97,125
96,897
96,669
96,441
96,214
95,986
95,758
95,530
95,302
95,074
94,846
94,618
94,390
94,162
93,934
93,706
93,478
93,250
93,022
92,794
92,566
92,338
92,110
91,882
91,654
91,426
91,198
90,970
90,742
90,514
90,286
90,058
89,830
89,602
89,374
89,146
88,918
88,690
88,462
88,234
88,006
87,778
87,550
87,322
CO2 – million ton
87,094
86,866
86,638
86,410
86,182
85,954
85,726
85,498
85,270
85,042
84,814
84,586
84,358
84,130
83,902
83,674
83,446 Oil
83,218
82,990
82,762
82,534
82,306
82,078
81,850
81,622
81,394
81,166
80,938
80,710
80,482
80,254
80,026
(all generating facilities)
79,798
79,570
79,342
79,114
78,886
78,658
78,430
78,202
77,974
77,746
77,518
77,290
77,062
76,834
76,606
76,378
76,150
75,922
75,694
75,466
75,238
75,010
74,782
74,554
74,326
74,098
73,870
73,642
73,414
73,186
72,958
72,730
72,502
72,274
72,046
71,818
71,590
71,362
71,134
70,906
70,678
70,450
70,222
69,994
69,766
69,538
69,310
69,082
68,854
68,626
68,398 Natural Gas
68,170
67,942
67,714
67,486
67,258
67,030
66,802
66,574
66,346
66,118
65,890
65,662
65,434
65,206
64,978
64,750
64,522
64,294
64,066
63,838
63,610
63,382
63,154
62,926
62,698
62,470
62,242
62,014
61,786
61,558
61,330
61,102
60,874
60,646
60,418
60,190
59,962
59,734
59,506
59,278
59,050
58,822
58,594
58,366
58,138
57,910
57,683
57,455
57,227
56,999
56,771
56,543
56,315
56,087
55,859
55,631
55,403
55,175
54,947
54,719
54,491
54,263
54,035
53,807
53,579
53,351
53,123
52,895 Coal
52,667
52,439
52,211
51,983
51,755
51,527
51,299
51,071
50,843
50,615
50,387
50,159
49,931
49,703
49,475
49,247
49,019
48,791
48,563
48,335
48,107
47,879
47,651
47,423
47,195
46,967
46,739
46,511
46,283
46,055
45,827
45,599
45,371
45,143
44,915
44,687
44,459
44,231
44,003
43,775
43,547
43,319
43,091
42,863
42,635
42,407
42,179
41,951
41,723
41,495
41,267
41,039
40,811
40,583
40,355
40,127
39,899
39,671
39,443
39,215
38,987
38,759
38,531
38,303
38,075
37,847
37,619
37,391
37,163
36,935
36,707
36,479
36,251
36,023
35,795
35,567
35,339
35,111
34,883
34,655
34,427
34,199
33,971
33,743
33,515
33,287
33,059
32,831
32,603
32,375
32,147
31,919
31,691
31,463
31,235
31,007
30,779
30,551
30,323
30,095
29,867
29,639
29,411
29,183
28,955
28,727
28,499
28,271
28,043
27,815
27,587
27,359
27,131
26,903
26,675
26,447
26,219
25,991
25,763 Note: 10 companies report
25,535
25,307
25,079
24,851
24,623
24,395
24,167
23,939
23,711
23,483
23,255
23,027
22,799
22,571
22,343
22,115
21,887
21,659
21,431
21,203
20,975
20,747
20,519
20,291
20,063
19,835
19,607
19,379
19,152
18,924
18,696
18,468
18,240
18,012 zero CO2 emissions*
17,784
17,556
17,328
17,100
16,872
16,644
16,416
16,188
15,960
15,732
15,504
15,276
15,048
14,820
14,592
14,364
14,136
13,908
13,680
13,452
13,224
12,996
12,768
12,540
12,312
12,084
11,856
11,628
11,400
11,172
10,944
10,716
10,488
10,260
10,032
9,804
9,576
9,348
9,120
8,892
8,664
8,436
8,208
7,980
7,752
7,524
7,296
7,068
6,840
6,612
6,384
6,156
5,928
5,700
5,472
5,244
5,016
4,788
4,560
4,332
4,104
3,876
3,648
3,420
3,192
2,964
2,736
2,508
2,280
2,052
1,824
1,596
1,368
1,140
912
684
456
228
0
(all generating facilities)
CO2 – lb/MWh
Breakdown of ownership categories provided in “Endnotes” (slide 47): privately/investor owned public power cooperative
Benchmarking Air Emissions of the 100 Largest Electric Power Producers in the United States *companies with zero emissions are ordered based on total generation
Data tables and maps at: www.mjbradley.com
July 2021 14CO2: Total Emissions and Emission Rates
Sorted from highest to lowest by emission rate
113,997
113,769
113,541
113,313
113,085
112,857
112,629
112,401
112,173
111,945
111,717
111,489
111,261
111,033
110,805
110,577
110,349
110,121
109,893
109,665
109,437
109,209
108,981
108,753
108,525
108,297
108,069
107,841
107,613
107,385
107,157
106,929
106,701
106,473
106,245
106,017
105,789
105,561
105,333
105,105
104,877
104,649
104,421
104,193
103,965
103,737
103,509
103,281
103,053
102,825
102,597
102,369
102,141
101,913
101,685
101,457
101,229
101,001
100,773
100,545
100,317
100,089
99,861
99,633
99,405
99,177
98,949
98,721 Other
98,493
98,265
98,037
97,809
97,581
97,353
97,125
96,897
96,669
96,441
96,214
95,986
95,758
95,530
95,302
95,074
94,846
94,618
94,390
94,162
93,934
93,706
93,478
93,250
93,022
92,794
92,566
92,338
92,110
91,882
91,654
91,426
91,198
90,970
90,742
90,514
90,286
90,058
89,830
89,602
89,374
89,146
88,918
88,690
88,462
88,234
88,006
87,778
87,550
87,322
CO2 – million ton
87,094
86,866
86,638
86,410
86,182
85,954
85,726
85,498
85,270
85,042
84,814
84,586
84,358
84,130
83,902
83,674
83,446 Oil
83,218
82,990
82,762
82,534
82,306
82,078
81,850
81,622
81,394
81,166
80,938
80,710
80,482
80,254
80,026
(all generating facilities)
79,798
79,570
79,342
79,114
78,886
78,658
78,430
78,202
77,974
77,746
77,518
77,290
77,062
76,834
76,606
76,378
76,150
75,922
75,694
75,466
75,238
75,010
74,782
74,554
74,326
74,098
73,870
73,642
73,414
73,186
72,958
72,730
72,502
72,274
72,046
71,818
71,590
71,362
71,134
70,906
70,678
70,450
70,222
69,994
69,766
69,538
69,310
69,082
68,854
68,626
68,398 Natural Gas
68,170
67,942
67,714
67,486
67,258
67,030
66,802
66,574
66,346
66,118
65,890
65,662
65,434
65,206
64,978
64,750
64,522
64,294
64,066
63,838
63,610
63,382
63,154
62,926
62,698
62,470
62,242
62,014
61,786
61,558
61,330
61,102
60,874
60,646
60,418
60,190
59,962
59,734
59,506
59,278
59,050
58,822
58,594
58,366
58,138
57,910
57,683
57,455
57,227
56,999
56,771
56,543
56,315
56,087
55,859
55,631
55,403
55,175
54,947
54,719
54,491
54,263
54,035
53,807
53,579
53,351
53,123
52,895 Coal
52,667
52,439
52,211
51,983
51,755
51,527
51,299
51,071
50,843
50,615
50,387
50,159
49,931
49,703
49,475
49,247
49,019
48,791
48,563
48,335
48,107
47,879
47,651
47,423
47,195
46,967
46,739
46,511
46,283
46,055
45,827
45,599
45,371
45,143
44,915
44,687
44,459
44,231
44,003
43,775
43,547
43,319
43,091
42,863
42,635
42,407
42,179
41,951
41,723
41,495
41,267
41,039
40,811
40,583
40,355
40,127
39,899
39,671
39,443
39,215
38,987
38,759
38,531
38,303
38,075
37,847
37,619
37,391
37,163
36,935
36,707
36,479
36,251
36,023
35,795
35,567
35,339
35,111
34,883
34,655
34,427
34,199
33,971
33,743
33,515
33,287
33,059
32,831
32,603
32,375
32,147
31,919
31,691
31,463
31,235
31,007
30,779
30,551
30,323
30,095
29,867
29,639
29,411
29,183
28,955
28,727
28,499
28,271
28,043
27,815
27,587
27,359
27,131
26,903
26,675
26,447
26,219
25,991
25,763 Note: 10 companies report
25,535
25,307
25,079
24,851
24,623
24,395
24,167
23,939
23,711
23,483
23,255
23,027
22,799
22,571
22,343
22,115
21,887
21,659
21,431
21,203
20,975
20,747
20,519
20,291
20,063
19,835
19,607
19,379
19,152
18,924
18,696
18,468
18,240
18,012 zero CO2 emissions*
17,784
17,556
17,328
17,100
16,872
16,644
16,416
16,188
15,960
15,732
15,504
15,276
15,048
14,820
14,592
14,364
14,136
13,908
13,680
13,452
13,224
12,996
12,768
12,540
12,312
12,084
11,856
11,628
11,400
11,172
10,944
10,716
10,488
10,260
10,032
9,804
9,576
9,348
9,120
8,892
8,664
8,436
8,208
7,980
7,752
7,524
7,296
7,068
6,840
6,612
6,384
6,156
5,928
5,700
5,472
5,244
5,016
4,788
4,560
4,332
4,104
3,876
3,648
3,420
3,192
2,964
2,736
2,508
2,280
2,052
1,824
1,596
1,368
1,140
912
684
456
228
0
(all generating facilities)
CO2 – lb/MWh
Breakdown of ownership categories provided in “Endnotes” (slide 47): privately/investor owned public power cooperative
Benchmarking Air Emissions of the 100 Largest Electric Power Producers in the United States *companies with zero emissions are ordered based on total generation
Data tables and maps at: www.mjbradley.com
July 2021 15SO2: Total Emissions and Emission Rates
Sorted from highest to lowest by emissions
(fossil fuel generating facilities)
60
Oil
SO2 – ‘000 ton
Natural Gas
40
Coal
Note: 12 companies report
20
zero SO2 emissions*
(fossil fuel generating facilities)
0
SO2 – lb/MWh
Breakdown of ownership categories provided in “Endnotes” (slide 47): privately/investor owned public power cooperative
Benchmarking Air Emissions of the 100 Largest Electric Power Producers in the United States *companies with zero emissions are ordered based on total generation
Data tables and maps at: www.mjbradley.com
July 2021 16SO2: Total Emissions and Emission Rates
Sorted from highest to lowest by emission rate
(fossil fuel generating facilities)
60
Oil
SO2 – ‘000 ton
Natural Gas
40
Coal
Note: 12 companies report
20
zero SO2 emissions*
(fossil fuel generating facilities)
0
SO2 – lb/MWh
Breakdown of ownership categories provided in “Endnotes” (slide 47): privately/investor owned public power cooperative
Benchmarking Air Emissions of the 100 Largest Electric Power Producers in the United States *companies with zero emissions are ordered based on total generation
Data tables and maps at: www.mjbradley.com
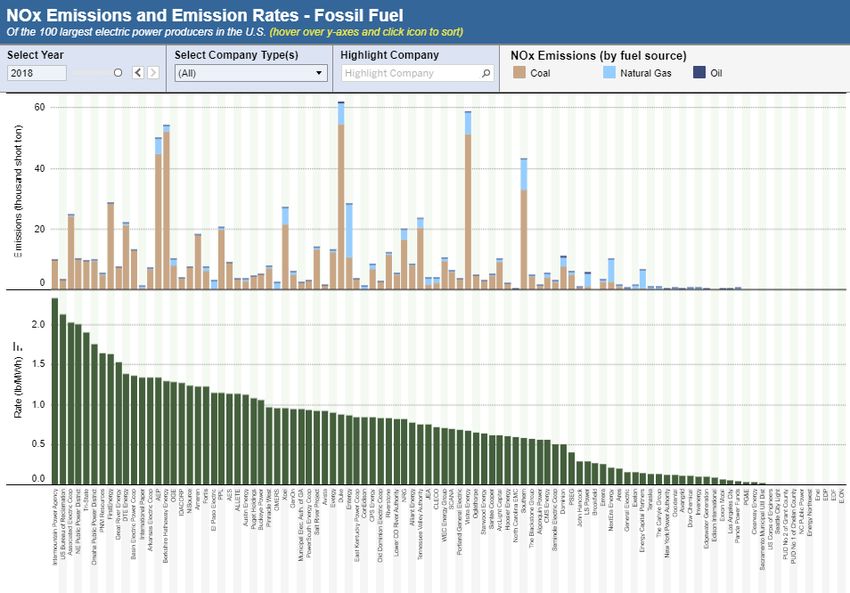
July 2021 17NOx: Total Emissions and Emission Rates
Sorted from highest to lowest by emissions
(fossil fuel generating facilities)
60
Oil
NOx – ‘000 ton
Natural Gas
40
Coal
Note: 11 companies report
20
zero NOx emissions*
(fossil fuel generating facilities)
0
NOx – lb/MWh
Breakdown of ownership categories provided in “Endnotes” (slide 47): privately/investor owned public power cooperative
Benchmarking Air Emissions of the 100 Largest Electric Power Producers in the United States *companies with zero emissions are ordered based on total generation
Data tables and maps at: www.mjbradley.com
July 2021 18NOx: Total Emissions and Emission Rates
Sorted from highest to lowest by emission rate
(fossil fuel generating facilities)
60
Oil
NOx – ‘000 ton
Natural Gas
40
Coal
Note: 11 companies report
20
zero NOx emissions*
(fossil fuel generating facilities)
0
NOx – lb/MWh
Breakdown of ownership categories provided in “Endnotes” (slide 47): privately/investor owned public power cooperative
Benchmarking Air Emissions of the 100 Largest Electric Power Producers in the United States *companies with zero emissions are ordered based on total generation
Data tables and maps at: www.mjbradley.com
July 2021 19Mercury: Total Emissions and Emission Rates
Sorted from highest to lowest by emissions
Mercury – pound
(coal plants)
Note: 38 companies report
zero mercury emissions*
Mercury – lb/GWh
(coal plants)
Breakdown of ownership categories provided in “Endnotes” (slide 47): privately/investor owned public power cooperative
Benchmarking Air Emissions of the 100 Largest Electric Power Producers in the United States *companies with zero emissions are ordered based on total generation
Data tables and maps at: www.mjbradley.com
July 2021 20Mercury: Total Emissions and Emission Rates
Sorted from highest to lowest by emission rates
Mercury – pound
(coal plants)
Note: 38 companies report
zero mercury emissions*
Mercury – lb/GWh
(coal plants)
Breakdown of ownership categories provided in “Endnotes” (slide 47): privately/investor owned public power cooperative
Benchmarking Air Emissions of the 100 Largest Electric Power Producers in the United States *companies with zero emissions are ordered based on total generation
Data tables and maps at: www.mjbradley.com
July 2021 21Rankings by CO2 Emission Rate
(Top 20 Privately-/Investor-Owned Power Producers)
All Sources – CO2 Emission Rate
(lb/MWh)
Ranking based on
2019 total generation 0 400 800 1,200 1,600 2,000
Exelon (3) 98
PSEG (15) 455
NextEra Energy (2) 482
Entergy (7) 595
Dominion (8) 596
Energy Capital Partners (10) 766
Duke (1) 877
Riverstone (19) 879
Southern (4) 935
FirstEnergy (14) 1,043
Berkshire Hathaway Energy (9) 1,158
Xcel (12) 1,198
Vistra Energy (5) 1,224
NRG (16) 1,478
ArcLight Capital (18) 1,485
Ameren (22) 1,491
DTE Energy (17) 1,496
AEP (11) 1,510
Evergy (20) 1,565
PPL (23) 1,967
Note: “Privately/investor owned” power producers include investor owned, privately held, and foreign owned corporations. This chart does not show public power
producers (federal power authorities, state power authorities, municipalities, power districts) or cooperatives.
Benchmarking Air Emissions of the 100 Largest Electric Power Producers in the United States
Data tables and maps at: www.mjbradley.com
July 2021 22Rankings by SO2 Emission Rate
(Top 20 Privately-/Investor-Owned Power Producers)
All Sources – SO2 Emission Rate
(lb/MWh)
Ranking based on
2019 total generation 0.0 0.5 1.0 1.5 2.0 2.5 3.0
Exelon (3) 0.00
Energy Capital Partners (10) 0.00
NextEra Energy (2) 0.02
PSEG (15) 0.04
Dominion (8) 0.08
Southern (4) 0.18
Evergy (20) 0.22
Duke (1) 0.31
Entergy (7) 0.41
Riverstone (19) 0.69
Berkshire Hathaway Energy (9) 0.72
Xcel (12) 0.75
FirstEnergy (14) 0.80
PPL (23) 1.03
AEP (11) 1.19
Vistra Energy (5) 1.25
ArcLight Capital (18) 1.52
NRG (16) 1.56
DTE Energy (17) 1.80
Ameren (22) 2.89
Note: “Privately/investor owned” power producers include investor owned, privately held, and foreign owned corporations. This chart does not show public power
producers (federal power authorities, state power authorities, municipalities, power districts) or cooperatives.
Benchmarking Air Emissions of the 100 Largest Electric Power Producers in the United States
Data tables and maps at: www.mjbradley.com
July 2021 23Rankings by NOx Emission Rate
(Top 20 Privately-/Investor-Owned Power Producers)
All Sources – NOx Emission Rate
(lb/MWh)
Ranking based on
2019 total generation 0.0 0.2 0.4 0.6 0.8 1.0 1.2
Exelon (3) 0.01
PSEG (15) 0.08
NextEra Energy (2) 0.11
Energy Capital Partners (10) 0.12
Dominion (8) 0.21
Southern (4) 0.36
Entergy (7) 0.44
Duke (1) 0.45
Riverstone (19) 0.57
Vistra Energy (5) 0.59
Xcel (12) 0.65
Evergy (20) 0.65
NRG (16) 0.67
ArcLight Capital (18) 0.73
FirstEnergy (14) 0.74
Ameren (22) 0.81
Berkshire Hathaway Energy (9) 0.83
DTE Energy (17) 0.86
AEP (11) 0.95
PPL (23) 1.03
Note: “Privately/investor owned” power producers include investor owned, privately held, and foreign owned corporations. This chart does not show public power
producers (federal power authorities, state power authorities, municipalities, power districts) or cooperatives.
Benchmarking Air Emissions of the 100 Largest Electric Power Producers in the United States
Data tables and maps at: www.mjbradley.com
July 2021 24Section III Emissions Trends Analysis Benchmarking Air Emissions of the 100 Largest Electric Power Producers in the United States Data tables and maps at: www.mjbradley.com July 2021 25
Annual Trends: U.S. Electric Sector
              Electric Sector Emissions2                                      Generation Fuel Mix3                                   Macroeconomic Indicators4
                      (Indexed; 2000 = 100)                                       (Indexed; 2000 = 100)                                   (Indexed; 2000 = 100)

                                                                                                                      269
       250

                                                                                       Natural Gas                    222
       200

                                                                                                                 Renewable*
       150                                                                                                                                              GDP**          140
                                                                                                        Nuclear                                            Total MWh
       100                                                                                                            105                                              105
                                 SO2          CO2
                        NOx                                   63                                   Coal
         50
                                                                                                                       39
                                                              15
          0                                                    7
              2000       2005       2010       2015       2020        2000        2005       2010         2015      2020      2000     2005     2010       2015   2020

              *Includes hydroelectric, wind, solar, biomass, geothermal, and other renewable sources.
              **GDP in chained 2012 dollars.

    The electric power sector has made significant progress in terms of reducing its NOx and SO 2 emissions. From 2000
    through 2020, NOx and SO2 emissions decreased 85 and 93 percent, respectively. From 2000 to 2020, CO 2 emissions
    decreased 37 percent while GDP grew 40 percent. Over the same period, generation from renewables more than
    doubled.5

Benchmarking Air Emissions of the 100 Largest Electric Power Producers in the United States
Data tables and maps at: www.mjbradley.com
July 2021                                                                                                                                                                26
Existing Capacity
U.S. Electric Generating Capacity by In-Service Year: 1940 – 2019
(Nameplate Capacity; MW)
80,000
Renewable/Other
Hydro
70,000
Nuclear
Oil
60,000
Gas
Coal
50,000
40,000
30,000
20,000
10,000
0
1940
1942
1944
1946
1948
1950
1952
1954
1956
1958
1960
1962
1964
1966
1968
1970
1972
1974
1976
1978
1980
1982
1984
1986
1988
1990
1992
1994
1996
1998
2000
2002
2004
2006
2008
2010
2012
2014
2016
2018
Source: U.S. Energy Information Administration. EIA-860 Annual Electric Generator Report. September 15, 2020.
Benchmarking Air Emissions of the 100 Largest Electric Power Producers in the United States
Data tables and maps at: www.mjbradley.com
July 2021 27Average Capacity Factors
Annual Capacity Factors for Select Fuels and Technologies
Capacity factors measure the extent to which a power plant is utilized over the course of time. The technical definition is the ratio of the electrical energy
produced by a generating unit to the electrical energy that could have been produced assuming continuous full power operation.
Coal plant utilization has declined in recent years; the average annual capacity factor of coal plants in the U.S. dropped from 64 percent in 2009 to 40 percent in
2020, while over the same time period, natural gas combined-cycle capacity factors rose from 44 to 57 percent.
Nuclear plants have high utilization rates, consistently running at above 90 percent average capacity factor. Hydropower capacity factors have remained
relatively constant over the past decade.
Wind capacity factors have increased from 28 percent in 2009 to 35 percent in 2020, largely due to improvements in wind turbine technology. Since EIA began
publishing data for utility-scale solar projects in 2014, annual capacity factors have remained steady at around 25-26 percent.
Nuclear Coal Natural Gas* Hydro Wind Solar PV**
*Combined Cycle **Utility-Scale, data first
available in 2014
Source: U.S. Energy Information Administration. Electric Power Monthly, Tables 6.7A and 6.7B (June 2021).
Benchmarking Air Emissions of the 100 Largest Electric Power Producers in the United States
Data tables and maps at: www.mjbradley.com
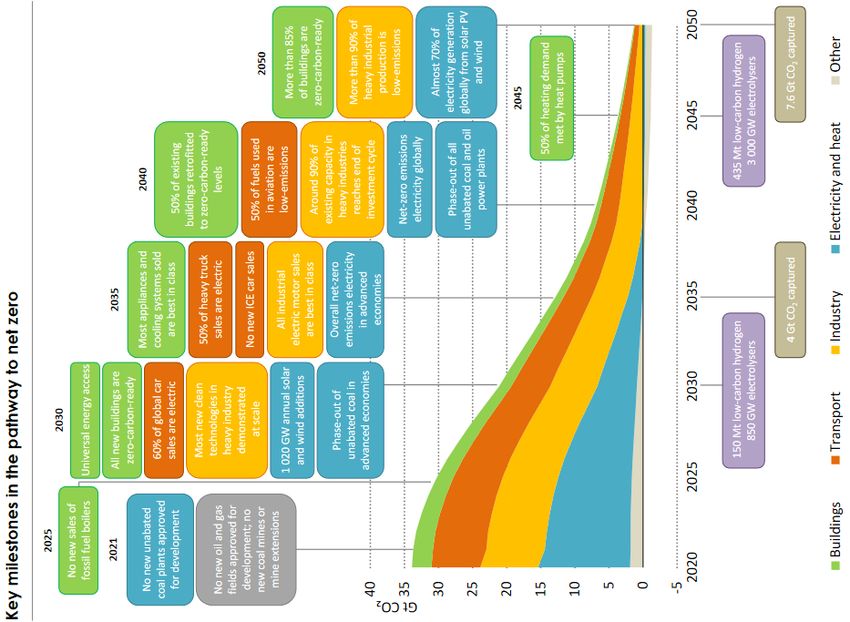
July 2021 28Net Zero by 2050 In 2021, the International Energy Agency (IEA) released a report titled Net Zero by 2050: A Roadmap for the Global Energy Sector. The special report details a comprehensive pathway to achieve a net zero emissions energy system, guarantee reliable and affordable electricity globally, and limit long-term increase in global temperatures to 1.5 °C. The achievements laid out in the report necessitate a complete transformation of the global energy system, which includes annual additions of 630 GW of solar PV and 390 GW of wind by 2030 – a rate equivalent to four times the record levels set in 2020. Electric vehicles constitute 60 percent of global car sales by 2030, and major innovations are required in direct air capture, hydrogen electrolysis, and advanced batteries. Fossil fuel production and use are drastically reduced over the 30-year time period. After 2021, no new oil and gas fields are approved for development – producers empty out reserves. Gas demand declines 55 percent and oil demand declines 75 percent by 2050 globally. Electricity provides 50 percent of total energy consumption in 2050, with 90 percent coming from renewable sources. Benchmarking Air Emissions of the 100 Largest Electric Power Producers in the United States *Graphic reprinted from 2021 IEA Net Zero by 2050 Report Data tables and maps at: www.mjbradley.com July 2021 29
Net Zero Emissions Scenario

                                                        Sector                    In the Net Zero Emissions Scenario (NZE), total electricity demand
                                                                                  grows 40 percent to 2030 and 150 percent by 2050. In advanced
                                                                                  economies, emissions from generation reach net zero by 2035 and
                                                                                  globally by 2040. Electricity production by coal declines sharply and in
                                                                                  2050, 80 percent of coal-fired generation facilities use carbon capture
                                                                                  and storage. Renewables increase from 29 percent of generation in
                                                                                  2020 to 60 percent in 2030 and 90 percent in 2050. Solar becomes the
                                                                                  largest source of renewables in terms of installed capacity and total
                                                                                  annual energy investment reaches $5 trillion by 2030.

                                                                                        Total Energy Supply of Unabated Fossil Fuels & Low-
                                                                                                Emissions Energy Sources in the NZE
                                                                                 EJ
                                                    Gross & Net
                                                   CO2 Emissions

Benchmarking Air Emissions of the 100 Largest Electric Power Producers in the United States
Data tables and maps at: www.mjbradley.com
July 2021                                                                                                                                              30
Section IV State-by-State Emissions Summary Benchmarking Air Emissions of the 100 Largest Electric Power Producers in the United States Data tables and maps at: www.mjbradley.com July 2021 31
State-by-State CO2 Emissions: U.S. Electric Sector, 2019
                          Total CO2 Emissions by State                                                           All Generating Sources – CO2 Emission Rate
                          (million ton; top 5 and bottom 5 are shown)                                                       (lb/MWh; top 5 and bottom 5 are shown)

                                       0               100       200         300                                                       0             1,000    2,000      3,000
                             Texas                                     220.8                                              Wyoming                                1,959
                             Florida                     103.5                                                         West Virginia                             1,958
                            Indiana                     84.4                                                              Kentucky                              1,811
                      Pennsylvania                      82.7                                                                Indiana                            1,653
                               Ohio                    73.7                                                                Missouri                           1,606

                          Delaware          2.4                                                                         Washington              290
                    New Hampshire           2.0                                                                      New Hampshire             220
                              Idaho         1.9                                                                               Idaho            210
                             Maine          0.8                                                                              Maine             145
                           Vermont          0.00                                                                           Vermont         3

                         Electricity Exporters/Importers                                                           Fossil Generators – CO2 Emission Rate
                (2018 Net Trade Index; top 5 exporters and importers are shown)                                             (lb/MWh; top 5 and bottom 5 are shown)

            E                          -1          0         1    2      3         4   Total in-state supply                           0              1,000     2,000       3,000
            X                                                                          of electricity as %
            P
                           Vermont                                           286%      share of total in-state            Nebraska                                       2,327
                                                                                       consumption needs;
            O             Wyoming                                      221%            in-state supply                     Montana                                       2,326
            R                                                                          includes international
            T          North Dakota                               178%                 imports                         North Dakota                                      2,309
            E          West Virginia                              178%                                                    Wyoming                                        2,265
            R
            S              Montana                                163%                                                      Kansas                                       2,232

            I
            M             California              75%                                                                     California                    886
            P
                              Idaho               71%                                                                   New Jersey                      867
            O
            R              Maryland               60%                                                                Massachusetts                      855
            T
                          Delaware           41%                                                                        Connecticut                     846
            E
            R        Massachusetts           39%                                                                              Maine                    793
            S

Benchmarking Air Emissions of the 100 Largest Electric Power Producers in the United States
Data tables and maps at: www.mjbradley.com
July 2021                                                                                                                                                                           32
Section V Fuel Mix of 100 Largest Power Producers in 2019 Benchmarking Air Emissions of the 100 Largest Electric Power Producers in the United States Data tables and maps at: www.mjbradley.com July 2021 33
Fuel Mix of 100 Largest Power Producers, 2019

                                                                                                       Share of Total
                                                                       Total                                                              Renew able /
     Rank Holding Company                                                                 Coal   Gas       Oil          Nuclear   Hydro
                                                                 (million MWh)                                                               Other
        1   Duke                                                       213.6              26%    35%      0.1%           35%        2%        3%
        2   NextEra Energy                                             204.4               3%    48%      0.1%           25%        0%       23%
        3   Exelon                                                     184.0               0%    11%      0.0%           85%        1%        2%
        4   Southern                                                   182.9              22%    53%      0.0%           16%        4%        5%
        5   Vistra Energy                                              177.3              32%    56%      0.0%           11%        0%        0%
        6   Tennessee Valley Authority                                 140.3              19%    23%      0.1%           46%       11%        0%
        7   Entergy                                                    128.0               7%    46%      0.0%           48%        0%        0%
        8   Dominion                                                   118.3              11%    43%      0.2%           42%        1%        4%
        9   Berkshire Hathaw ay Energy                                 115.9              39%    30%      0.1%            3%        2%       25%
       10   Energy Capital Partners                                    104.5               0%    91%      0.0%            0%        0%        9%
       11   AEP                                                        92.7               61%    15%      0.2%           17%        1%        5%
       12   Xcel                                                       77.2               37%    35%      0.0%           18%        2%        8%
       13   US Corps of Engineers                                      74.2                0%    0%       0.0%            0%      100%        0%
       14   FirstEnergy                                                61.9               47%    0%       0.1%           52%        0%        0%
       15   PSEG                                                       56.9                3%    42%      1.2%           53%        0%        1%
       16   NRG                                                        46.5               51%    25%      0.1%           21%        0%        3%
       17   DTE Energy                                                 41.0               60%    7%       0.1%           24%        0%        8%
       18   ArcLight Capital                                           38.3               54%    42%      0.1%            0%        4%        0%
       19   Riverstone                                                 37.8               30%    20%      0.1%           50%        0%        0%
       20   Evergy                                                     37.6               65%    7%       0.2%           23%        0%        5%
       21   US Bureau of Reclamation                                   36.5                0%    0%       0.0%            0%      100%        0%
       22   Ameren                                                     35.4               68%    1%       0.1%           26%        6%        0%
       23   PPL                                                        34.1               79%    19%      0.1%            0%        1%        0%
       24   PG&E                                                       33.8                0%    19%      0.0%           48%       33%        1%
       25   Salt River Project                                         32.1               22%    60%      0.1%           17%        0%        0%
       26   WEC Energy Group                                           30.8               49%    44%      0.1%            0%        3%        4%
       27   LS Pow er                                                  30.3               11%    85%      0.2%            0%        0%        4%
       28   EDF                                                        30.3                0%    0%       0.0%           56%        0%       44%
       29   Invenergy                                                  28.2                0%    67%      0.0%            0%        0%       33%
       30   New York Pow er Authority                                  27.9                0%    11%      0.2%            0%       89%        0%

Benchmarking Air Emissions of the 100 Largest Electric Power Producers in the United States
Data tables and maps at: www.mjbradley.com
July 2021                                                                                                                                                34
Fuel Mix of 100 Largest Power Producers, 2019
Share of Total
Total Renew able /
Rank Holding Company Coal Gas Oil Nuclear Hydro
(million MWh) Other
31 Associated Electric Coop 26.2 57% 43% 0.0% 0% 0% 0%
32 Pinnacle West 25.9 27% 35% 0.0% 36% 0% 2%
33 Oglethorpe 25.4 16% 44% 0.0% 40% 0% 0%
34 Global Infrastructure Partners 25.4 0% 62% 0.0% 0% 0% 38%
35 CPS Energy 25.2 26% 39% 0.0% 35% 0% 0%
36 Panda Pow er Funds 23.9 0% 100% 0.0% 0% 0% 0%
37 CMS Energy 23.8 42% 44% 0.1% 0% 2% 12%
38 Emera 23.1 5% 92% 0.0% 0% 0% 3%
39 Alliant Energy 23.0 38% 48% 0.1% 0% 2% 13%
40 CLECO 21.3 13% 78% 0.0% 0% 0% 9%
41 Avangrid 20.8 0% 17% 0.0% 0% 1% 83%
42 Basin Electric Pow er Coop 19.1 83% 13% 0.1% 0% 0% 4%
43 Starw ood Energy 19.1 13% 78% 0.1% 0% 0% 9%
44 AES 18.3 52% 29% 0.2% 0% 0% 19%
45 Santee Cooper 17.7 51% 31% 0.2% 16% 1% 0%
46 NE Public Pow er District 17.0 54% 4% 0.0% 41% 1% 1%
47 The Blackstone Group 16.9 41% 59% 0.1% 0% 0% 0%
48 Ares 16.5 1% 94% 0.0% 0% 0% 5%
49 OGE 16.0 30% 61% 0.1% 0% 0% 9%
50 EDP 15.9 0% 0% 0.0% 0% 0% 100%
51 Portland General Electric 15.7 27% 53% 0.1% 0% 9% 11%
52 IDACORP 15.3 32% 14% 0.1% 0% 55% 0%
53 Brookfield 14.3 0% 0% 0.0% 0% 67% 33%
54 Enel 13.8 0% 0% 0.0% 0% 5% 95%
55 Edison International 13.6 0% 23% 0.2% 37% 32% 8%
56 Puget Holdings 13.4 33% 50% 0.0% 0% 5% 12%
57 Low er CO River Authority 13.3 50% 47% 0.1% 0% 2% 0%
58 Tenaska 13.0 0% 96% 0.0% 0% 0% 4%
59 The Carlyle Group 12.7 0% 100% 0.1% 0% 0% 0%
60 Exxon Mobil 12.2 0% 87% 0.0% 0% 0% 13%
Benchmarking Air Emissions of the 100 Largest Electric Power Producers in the United States
Data tables and maps at: www.mjbradley.com
July 2021 35Fuel Mix of 100 Largest Power Producers, 2019
Share of Total
Total Renew able /
Rank Holding Company Coal Gas Oil Nuclear Hydro
(million MWh) Other
61 Municipal Elec. Auth. of GA 12.1 17% 25% 0.0% 57% 0% 0%
62 RWE Group 11.9 0% 0% 0.0% 0% 0% 100%
63 Fortis 11.2 48% 50% 0.2% 0% 1% 1%
64 Seminole Electric Coop 10.8 65% 35% 0.2% 0% 0% 0%
65 Occidental 10.7 0% 99% 0.0% 0% 0% 1%
66 Caithness Energy 10.6 0% 86% 0.0% 0% 0% 14%
67 NiSource 10.3 63% 36% 0.0% 0% 0% 0%
68 El Paso Electric 10.2 0% 51% 0.0% 49% 0% 0%
69 OMERS 10.1 0% 59% 0.0% 0% 0% 41%
70 PNM Resources 10.1 42% 22% 0.2% 32% 0% 3%
71 Tri-State 10.0 88% 10% 1.7% 0% 0% 1%
72 Dow Chemical 9.8 0% 96% 0.0% 0% 0% 4%
73 John Hancock 9.7 9% 56% 0.1% 0% 0% 35%
74 Los Angeles City 9.6 0% 68% 0.0% 19% 9% 4%
75 ConEdison 9.4 0% 30% 0.2% 0% 0% 70%
76 Austin Energy 9.3 37% 24% 0.0% 38% 0% 1%
77 Energy Northw est 9.1 0% 0% 0.0% 97% 1% 2%
78 Arkansas Electric Coop 9.0 66% 28% 0.1% 0% 6% 0%
79 Omaha Public Pow er District 9.0 95% 4% 0.1% 0% 0% 1%
80 JEA 9.0 16% 71% 0.0% 0% 0% 13%
81 Buckeye Pow er 8.8 96% 4% 0.3% 0% 0% 0%
82 Algonquin Pow er 8.6 25% 38% 0.3% 0% 1% 36%
83 Argo Infrastructure Partners 8.6 0% 100% 0.0% 0% 0% 0%
84 Great River Energy 8.5 98% 2% 0.2% 0% 0% 0%
85 PUD No 2 of Grant County 8.2 0% 0% 0.0% 0% 100% 0%
86 International Paper 8.0 0% 22% 0.4% 0% 0% 77%
87 TransAlta 7.7 93% 0% 0.1% 0% 0% 7%
88 ALLETE 7.7 55% 1% 0.0% 0% 9% 36%
89 PUD No 1 of Chelan County 7.6 0% 0% 0.0% 0% 100% 0%
90 Intermountain Pow er Agency 7.6 100% 0% 0.3% 0% 0% 0%
Benchmarking Air Emissions of the 100 Largest Electric Power Producers in the United States
Data tables and maps at: www.mjbradley.com
July 2021 36Fuel Mix of 100 Largest Power Producers, 2019
Share of Total
Total Renew able /
Rank Holding Company Coal Gas Oil Nuclear Hydro
(million MWh) Other
91 Avista 7.4 19% 29% 0.0% 0% 48% 4%
92 NC Public Pow er 7.3 0% 0% 0.0% 100% 0% 0%
93 NextEra Energy Partners 7.3 0% 0% 0.0% 0% 0% 100%
94 Capital Pow er 7.1 1% 71% 0.0% 0% 0% 28%
95 Old Dominion Electric Coop 7.0 9% 65% 0.1% 26% 0% 0%
96 Sacramento Municipal Util Dist 6.8 0% 60% 0.0% 0% 32% 8%
97 North Carolina EMC 6.8 0% 11% 0.0% 89% 0% 0%
98 Cooperative Energy 6.7 0% 84% 0.0% 16% 0% 0%
99 Itochu 6.7 0% 100% 0.3% 0% 0% 0%
100 East Kentucky Pow er Coop 6.7 90% 8% 0.3% 0% 0% 2%
Total (top-100 producers) 3,363.7 23% 37% 0.1% 23% 7% 9%
Total (all U.S. producers) 4,100.3 23% 39% 0.3% 20% 7% 12%
Benchmarking Air Emissions of the 100 Largest Electric Power Producers in the United States
Data tables and maps at: www.mjbradley.com
July 2021 37Section VI Appendix Benchmarking Air Emissions of the 100 Largest Electric Power Producers in the United States Data tables and maps at: www.mjbradley.com July 2021 38
Ranking Utility Portfolios
   •     As described above, the Benchmarking Report presents generation and emissions information of power producers,
         not utility companies with obligations to deliver electricity to customers. In order to apply a uniform methodology to
         all power producers, the Report assigns electricity generation and associated emissions to power producers
         according to their known generating asset ownership as of December 31, 2019.
   •     If a power producer is also a distribution utility, the fuel mix and emissions associated with the utility’s total supply
         portfolio may differ substantially from its owned generation, depending on the nature and extent of any power
         purchase agreements and other contractual agreements to which the utility may be party. The distribution utility
         might also rely on market purchases to supply its customers (e.g., purchases from the PJM or MISO markets). A
         power producer might also sell excess supply to the market or to other utilities.
   •     To highlight the potential implications of these two different approaches, the following slides present the generation
         mix and all-source CO2 emission rate for a rural electric cooperative (Great River Energy) and investor-owned utility
         (Xcel). The graph also reports the CO2 emission rate associated with part of the company’s supply portfolio (owned
         generation and long-term contracts); the supply portfolio emission rate does not reflect the emissions associated
         with market purchases, which may be fossil-fired, renewables, or other sources.
   •     In the examples shown, the CO2 emission rate associated with supply is lower because both companies contract for
         non-emitting, renewable resources in addition to owned wind or solar projects (Great River Energy only owns fossil
         assets). Rural cooperatives are non-profit entities that are generally unable to take advantage of renewable tax
         credits, so they will tend to purchase renewable energy under long-term contracts rather than owning the facilities.
   •     Both approaches—generation and supply—can be helpful in evaluating a company’s performance. Unfortunately,
         there is no publicly available source for the data that would be required to benchmark utility resource portfolios in
         the same way that we can benchmark owned-generation assets.
   •     The following slides illustrate the all-source CO2 emissions rates for Great River Energy and Xcel. The companies
         voluntarily supplied the information displayed. The charts include the emission rate for owned generation only
         (consistent with the focus and methodology of the Benchmarking report) as well as the all-source emission rate
         associated with the combination of owned generation and long-term contract purchases.

Benchmarking Air Emissions of the 100 Largest Electric Power Producers in the United States
Data tables and maps at: www.mjbradley.com
July 2021                                                                                                                            39
Case Study: Owned Generation and Contracted Supply
TWh Great River Energy
2019 Generation Mix
Contracted
All Source CO2 Rate
Renewable/Other
With Contracted Power
Hydro 1,822 lb/MWh
Owned Generation
All Source CO2 Rate
Owned Generation Great River
2,153 lb/MWh Energy’s All
Source CO2
Emission Rate
decreases 15%
when factoring in
owned generation
and contracted
supply
Supply Portfolio
Coal Natural Gas Oil Nuclear Hydro Renewable/Other Contracted by Fuel Type
Note: additional supply may be obtained from market purchases; however, these data are not included here.
Benchmarking Air Emissions of the 100 Largest Electric Power Producers in the United States
Data tables and maps at: www.mjbradley.com
July 2021 40Case Study: Owned Generation and Contracted Supply
TWh Xcel Energy
2019 Generation Mix
Contracted
Zero-Emitting/Renewable
All Source CO2 Rate
With Contracted Power
956 lb/MWh
Fossil
Owned Generation
All Source CO2 Rate Xcel Energy’s All
Owned Generation Source CO2
1,230 lb/MWh Emission Rate
decreases 22%
when factoring in
owned generation
and contracted
supply (both fossil
and zero-emitting)
Supply Portfolio
Coal Natural Gas Oil Nuclear Hydro Renewable/Other Contracted by Fuel Type
Note: contracted power includes long-term PPAs, and short-term and spot market purchases
Benchmarking Air Emissions of the 100 Largest Electric Power Producers in the United States
Data tables and maps at: www.mjbradley.com
July 2021 41Data Sources The following public data sources were used to develop this report: EPA AIR MARKETS PROGRAM DATA (AMP): EPA’s Air Markets Program Data account for almost all of the SO 2 and NOx emissions, and about 20 percent of the CO2 emissions analyzed in this report. EPA TOXIC RELEASE INVENTORY (TRI): The 2019 mercury emissions used in this report are based on TRI reports submitted by facility managers. EIA FORMS 923 POWER PLANT DATABASES (2019): EIA Form 923 provides data on the electric generation and heat input by fuel type for utility and non-utility power plants. The heat input data was used to calculate approximately 80 percent of the CO 2 emissions analyzed in this report. EIA FORM 860 ANNUAL ELECTRIC GENERATOR REPORT (2019): EIA Form 860 is a generating unit level data source that includes information about generators at electric power plants, including information about generator ownership. EPA U.S. INVENTORY OF GREENHOUSE GAS EMISSIONS AND SINKS (2019): EPA’s U.S. Inventory of Greenhouse Gas Emissions and Sinks report provides in Annex 2 heat contents and carbon content coefficients of various fuel types. This data was used in conjunction with EIA Form 923 to calculate approximately 20 percent of the CO2 emissions analyzed in this report. Benchmarking Air Emissions of the 100 Largest Electric Power Producers in the United States Data tables and maps at: www.mjbradley.com July 2021 42
Methodology
   Plant Ownership

   This report aims to reflect power plant ownership as of December 31, 2019. Plant ownership data used in this report are primarily based on the EIA-860
   database from the year 2019. EIA-860 includes ownership information on generators at electric power plants owned or operated by electric utilities and non-
   utilities, which include independent power producers, combined heat and power producers, and other industrial organizations. It is published annually by EIA.

   For the largest 100 power producers, plant ownership is further checked against self-reported data from the producer’s 10-K form filed with the SEC, listings on
   their website, and other media sources. Ownership of plants is updated based on the most recent data available. Consequently, in a number of instances,
   ultimate assignment of plant ownership in this report differs from EIA-860’s reported ownership. This primarily happens when the plant in question falls in one
   or more of the categories listed below:

          1.     It is owned by a limited liability partnership of shareholders of which are among the 100 largest power producers.

          2.     The owner of the plant as listed in EIA-860 is a subsidiary of a company that is among the 100 largest power producers.

          3.     It was sold or bought during the year 2019. Because form 10-K for a particular year is usually filed by the producer in the first quarter of the
                 following year, this report assumes that ownership as reported in form 10-K is more accurate.

   Publicly available data do not provide a straightforward means to accurately track lease arrangements and power purchase agreements. Therefore, in order to
   apply a standardized methodology to all companies, this report allocates generation and any associated emissions according to reported asset ownership as of
   December 31, 2019.

   Identifying “who owns what” in the dynamic electricity generation industry is probably the single most difficult and complex part of this report. In addition to the
   categories listed above, shares of power plants are regularly traded and producers merge, reorganize, or cease operations altogether. While considerable
   effort was expended in ensuring the accuracy of ownership information reflected in this report, there may be inadvertent errors in the assignment of ownership
   for some plants where public information was either not current or could not be verified.

   Generation Data and Cogeneration Facilities

   Plant generation data used in this report come from EIA Form 923.

   Cogeneration facilities produce both electricity and steam or some other form of useful energy. Because electricity is only a partial output of these plants, their
   reported emissions data generally overstate the emissions associated with electricity generation. Generation and emissions data included in this report for
   cogeneration facilities have been adjusted to reflect only their electricity generation. For all such cogeneration facilities emissions data were calculated on the
   basis of heat input of fuel associated with electricity generation only. Consequently, for all such facilities EIA Form 923, which report a plant’s total heat input as
   well as that which is associated with electricity production only, was used to calculate their emissions.

Benchmarking Air Emissions of the 100 Largest Electric Power Producers in the United States
Data tables and maps at: www.mjbradley.com
July 2021                                                                                                                                                                    43
You can also read


