Big Digital Data, Analytic Visualization and the Opportunity of Digital Intelligence - White Paper
←
→
Page content transcription
If your browser does not render page correctly, please read the page content below

› White Paper

 Big Digital Data, Analytic Visualization and the
 Opportunity of Digital Intelligence
Contents
Introduction......................................................................... 1          SAS® Visual Analytics Enables Prescriptive
                                                                                                 Analysis for Digital and Integrated Marketing............. 7
A History of Fragmented Data and
Analytics Tools.................................................................... 3                SAS® Visual Analytics and Predictive Marketing:
                                                                                                     Visual Advanced Forecasting...............................................7
Individual Customer-Level Digital Data Is a
Valuable Commodity........................................................ 4                         Improving the Forecast..........................................................8

Solution for Collecting, Normalizing and                                                         SAS® Visual Analytics, Digital Segmentation
Making Digital Behavioral Data Accessible                                                        and Outbound Marketing: Visual Decision Trees....... 9
With Business Context...................................................... 4                        What Drives Conversions on sas.com?..............................9
SAS® Adaptive Customer Experience Supports                                                       Conclusion.........................................................................12
Your Digital Marketing Efforts......................................... 4
                                                                                                 Learn More........................................................................12
    Collecting Digital Interaction Behavior via
    a Single Line Insert..................................................................4          References............................................................................. 12
    Adding Business Context to
    Semistructured Digital Data.................................................5

    Data Roll-Ups: Tying Digital Data
    to the Customer......................................................................5

    Data Management: Ensuring
    Completeness and Quality...................................................5

    Off-Site & On-Site...................................................................6

    Messaging................................................................................6

    Digital Data Model and Data Ownership: Breaking
    Down the Web Analytics Silo...............................................6

Content Provider
Suneel Grover is a Senior Solutions Architect for Customer
Intelligence and Advanced Analytics at SAS. Grover provides
consulting services that blend marketing strategy (integrated/
omnichannel, digital) with marketing analytics, visualization
and customer intelligence technologies from SAS to solve
complex business challenges in the media, entertainment,
hospitality, communications, content and technology indus-
tries. In addition to his role at SAS, Grover is an adjunct
professor at George Washington University, teaching in the
MS in Business Analytics graduate program within the School
of Business and Decision Science. Grover also serves on the
program advisory committee for the Direct Marketing
Association (DMA).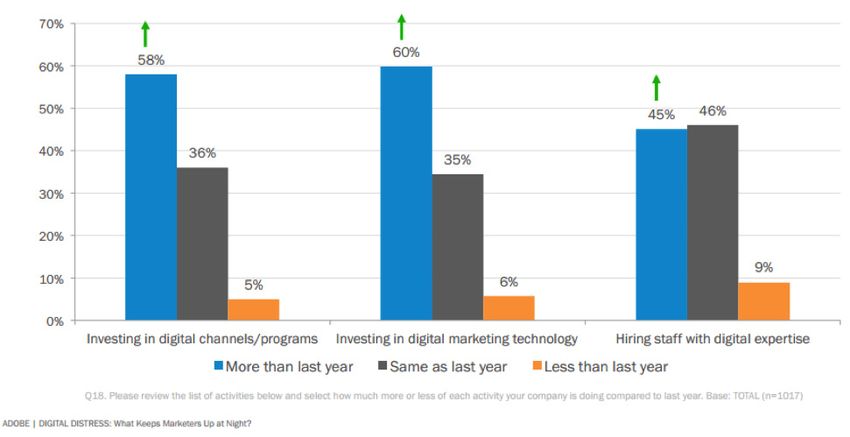
1
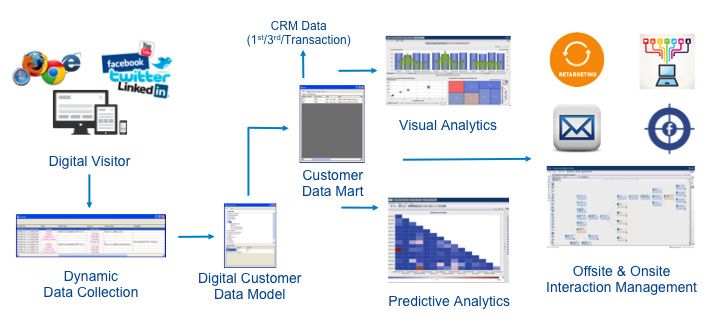
Introduction Research by Adobe in its September 2013 study Digital
Distress: What Keeps Marketers Up at Night? validates this trend
Digital-savvy consumers today have high expectations when it with the following insights:
comes to how brands interact with them. For example, they
• Sixty percent of marketers expect their companies to invest
expect that the companies they engage with and buy from
more in digital marketing technology this year.
understand their preferences – regardless of the interaction
channel. They expect them to provide a nonintrusive, yet • Only one in three marketers surveyed think that their compa-
personalized experience that adds value every step of the way. nies are highly proficient in digital marketing.
• Ultimately, 61 percent of all marketers think that, for most
In “Predictions 2014: The Year of Digital Business,” Martin Gill of companies, digital marketing approaches are a constant
Forrester Research talked about the challenges and trends cycle of trial and error. 2
facing executives as they grapple with how to help their busi-
nesses make the transition to digital, often in the absence of a In “Digital Intelligence Replaces Web Analytics,” James
defined digital leadership role. The vast majority of executives McCormick of Forrester Research noted, “Given the significant
expect their digital budgets to grow this year, and more than new investment and revenue at stake for digital-centric business
half expect to spend more on innovation.1 objectives, analytics is critical to supporting the development,
How much will your firm spend on its consumer-facing
“”
online presence in 2013 and 2014 (in us$)?
14% 2014 Please estimate
$25m or more as best you can —
16% 2013 through the
remainder of the
9% year for 2013 —
$10m to $24.9m
10% include development
work as well as
9% operating costs.
$5m to $9.9m
5%
24%
$2.5m to $4.9m
14%
16%
$1m to $2.4m
22%
27%
Less than $1m
33%
Base: 128 e-business and channel strategy professionals (percentages may not total 100 because of rounding)
Although a few high-spending firms are cutting back their e-business budgets, the vast majority of
e-business professionals expect to have a higher budget in 2014 compared with 2013.
Source: Q4 2013 Global eBusiness and Channel Strategy Professional Online Survey — Forrester Research, Inc.
Figure 1. Predictions 2014: The Year of Digital Business.
1
“Predictions 2014: The Year of Digital Business,” Forrester Research, Inc., December 2013.
2
Adobe. Sept. 23, 2013. “Digital Distress: What Keeps Marketers Up at Night?” Adobe Systems Inc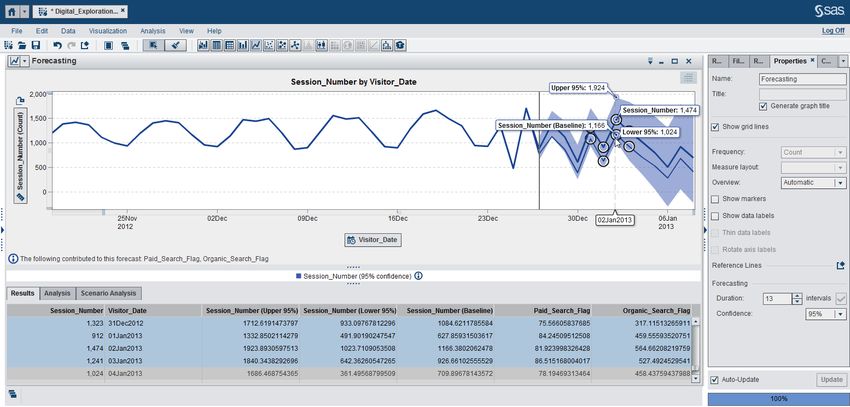
2

          Figure 2. Digital Distress: What Keeps Marketers Up at Night?

validation and optimization of digital channels. And web                  • Data types – structured versus unstructured, known data
analytics is the logical hub of interactive channel analysis, based         versus anonymous.
on the historical centrality of the website.”                             • Skills – data scientist versus web geek.
                                                                          • Analysis – advanced analytics versus ‘good enough’ analytics.
Unfortunately, however, traditional approaches to web analytics
are inadequate for helping organizations accomplish these new             • Time-to-delivery – best possible reporting versus satisfactory
digital objectives. McCormick calls traditional web analytics               instantaneous reporting.”
“vestiges of a simpler time, when understanding traffic sources
and on-site user behavior were paramount.”                                Clearly, marketing analytics must evolve to keep pace with
                                                                          marketing’s evolving responsibility to encompass more and
Updating your approach to digital analytics is critical,                  more interconnected touch points throughout each customer’s
McCormick says, if you want to avoid continually being plagued            journey. To bridge the divide between traditional web analytics
by poor customer experiences, irrelevant business reporting               and comprehensive analytics for digital marketing, organiza-
and siloed customer insights.                                             tions must modernize their approach, says McCormick.
                                                                          Forrester Research calls this “digital intelligence,” defined as:
As web and customer analytics teams attempt to work together
to combine digital data and offline channel data, their success is        “The capture, management and analysis of customer data to
impeded by what McCormick characterizes as “a clash of                    deliver a holistic view of the digital customer experience that
approaches and culture from:                                              drives the measurement, optimization and execution of digital
                                                                          customer interactions.” 3

                                                                          3
                                                                              “Digital Intelligence Replaces Web Analytics,” Forrester Research, Inc.,
                                                                              November 2013.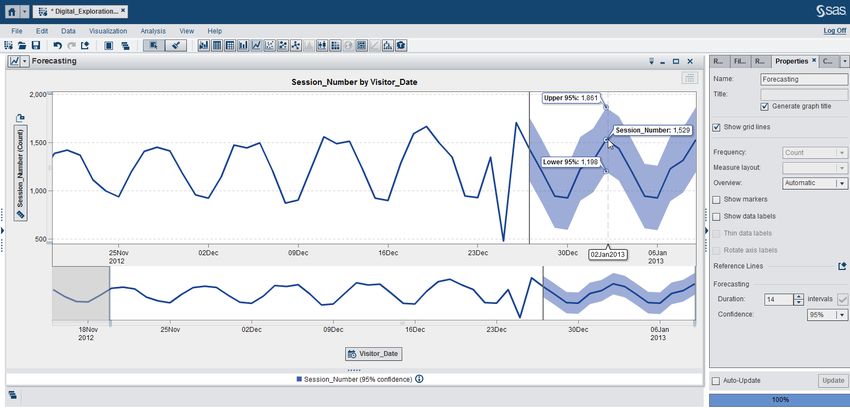
3

                                                          The golden age of web analytics
                                                                                                                                           Figure 3.
                                 1993 to                        2000 to                     2007 to                    2011 to             The journey
                                 1999                           2006                        2010                       present             to digital
                                                                                                                                           intelligence.
                            Web server                          Web                        Digital                    Digital
                           log analytics                      analytics                   analytics                intelligence
                         • The World Wide Web           • There is mainstream        • There is mainstream      • There is mainstream
                           and the web browser            acceptance of                acceptance of social       acceptance of mobile
                           emerge.                        interactive channels         media channels.            and application
                                                          such as search, email,                                  channels.
                         • Firms understand the                                      • Firms understand
                                                          and websites.
                           volume of activity on                                       interactions across      • Firms understand
                           the website.                 • Firms understand             interactive channels       interactions across
                                                          aggregate visitor            and track the success      digital channels in a
                         • Website analysis is
                           conducted, using data          activity on the website,     of interactive             business context and
                           collected from web             content usage, and           marketing campaigns.       can take direct action
                           server logs.                   sources of traffic.          • Data collection            on insights.

                         • The first commercial          • JavaScript is accepted       expands to               • Data collection
                           website analytics              as the web analytics         incorporate social and     expands to
                           software is created.           data collection              interactive channels;      incorporate mobile,
                                                          mechanism of choice.         vendors extend native      applications, and
                                                        • The second generation        data warehousing           media; complimentary
                                                          of web analytics             capabilities and           tag management and
                                                          applications cements         partner integrations.      data syndication
                                                          the market; Google         • Enterprise technology      capabilities emerge.
                                                          launches Google              vendors enter and        • Specialist vendors
                                                          Analytics, a free web        consolidate the web        enter the market to
                                                          analytics application.       analytics application      address emerging
                                                                                       market; site               media, data
                                                                                       optimization               management, and big
                                                                                       application vendors        data analytics.
                                                                                       proliferate.

                           Source: Forrester Research, Inc.

A History of Fragmented Data                                                            Until recently, many marketers depended primarily on various
                                                                                        third-party web analytics tools. These tools were designed to
and Analytics Tools                                                                     aggregate digital data to create reports describing what
                                                                                        happened in the past. Getting an integrated, omnichannel view
Marketers have long had the challenge of stitching together
                                                                                        across such a fragmented digital environment was extremely
different types of data and data sources to achieve their vision
                                                                                        difficult. That made it practically impossible to get a comprehen-
of integrated marketing. This includes:
                                                                                        sive, data-centric view of the customer that could feed inte-
• Internal, first-party CRM and transactional data.                                     grated marketing analytics – or more specifically, prescriptive
• Digital analytics data from web analytics and advertising                             recommendations for marketing processes.
  offerings – e.g., Google Analytics, DoubleClick, Adobe
  Omniture or Right Media.                                                              While data-driven marketers and analysts have used powerful
                                                                                        advanced analytics for many years to perform sophisticated
• Third-party data from data management platforms like
                                                                                        analyses – such as regression, decision trees or clustering – they
  Nielsen, BlueKai or X+1.
                                                                                        have been limited to using offline and traditional channel data.
                                                                                        This has been because of the limited availability of digital data
Unfortunately, it has been difficult to take advantage of such
                                                                                        and insufficient integration capabilities. Additionally, web and
data sources because they have been stuck in silos. Marketers
                                                                                        digital analytics tools primarily aggregate and report on histor-
have struggled to bring together available online, offline and
                                                                                        ical information and do not enable predictive analysis, which
third-party data in a way that is logical, efficient and usable.
                                                                                        requires a combination of both traditional and digital data
                                                                                        sources in order to provide the most insight.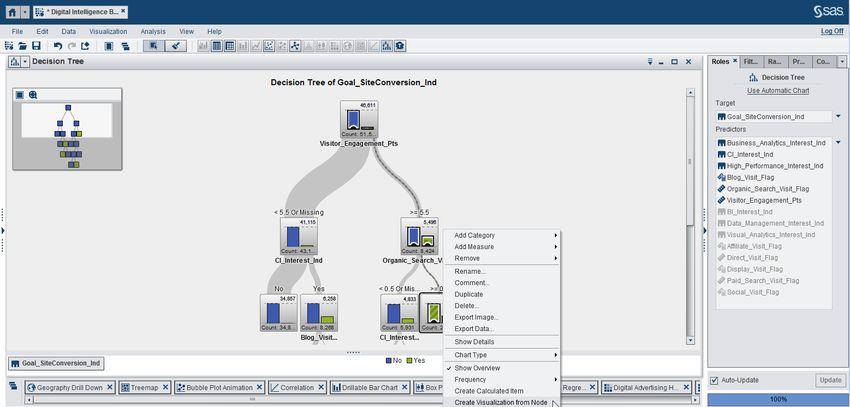
4

For the most part, web analytics tools are designed with the          If this data is collected and prepared appropriately, you can
visualization of data as the primary driver for users. That’s         merge it with your company’s first-party (or company-owned)
because data visualization enables a faster, deeper under-            customer data, and then stream it into your analytics, visualiza-
standing of the insights and trends hidden within data in a more      tion and marketing automation systems.
consumable manner. The ease of use and visual appeal of data
visualization tools have helped marketers get a better under-
standing of the important trends and insights within data.            Solution for Collecting,
However, data visualization largely has been very descriptive in
nature – that is, primarily about reporting, business intelligence
                                                                      Normalizing and Making Digital
and descriptive statistics.                                           Behavioral Data Accessible
                                                                      With Business Context
Individual Customer-Level Digital                                     Recent research has shown the biggest data challenges facing

Data Is a Valuable Commodity                                          digital marketing involve the storage and integration of large
                                                                      amounts of data, and preparing it for analysis. In addition,
The challenge facing marketers today is how to progress               emerging digital data is not being collected to the level it needs
beyond the multichannel analytic limitations of aggregated data       to be in order to glean valuable insight from it; rather, the vast
collection methods used by traditional web analytics. There’s an      majority of organizations have ready access only to traditional
opportunity to have a digital data collection framework that          purchase and demographic data.
enables both business intelligence and predictive analytics.
This methodology requires organizations to:                           In the past few years, there has been a notable upswing in new
                                                                      and incremental abilities to process very large amounts of infor-
• Collect data from web, social and mobile app sessions
                                                                      mation. Data repositories – from Hadoop environments to tradi-
  (that is, multidomain visits).
                                                                      tional relational databases like SAP, Teradata and Oracle – are
• Accurately stitch together digital visits attributed to one         getting bigger, stronger and faster. Now that it’s possible to
  visitor profile (whether anonymous or known).                       handle very large amounts of information, we can approach
• After authentication, accurately connect digital visits across      digital data differently. As Figure 5 depicts, the biggest opportu-
  devices, browsers and multiple domains attributed to one            nity lies in collecting web analytics data and preparing it for
  customer profile.                                                   multichannel integration. Regretfully, aggregated web data
                                                                      does not have the level of detail that predictive analysis
The vision of digital intelligence requires marketers to focus on     requires, and – for the most part – it cannot be de-aggregated.
understanding the who, what, where, when and, most impor-
tantly, the why of digital experiences. In order to do so, however,
you must rethink how you collect digital behavioral data, consid-     SAS® Adaptive Customer
ering larger downstream business applications. For example,
some digital marketers love to perform website pathing
                                                                      Experience Supports Your
analysis, which describes visitor page sequencing. What if you        Digital Marketing Efforts
wanted to perform predictive analysis (e.g., decision trees and
                                                                      SAS Adaptive Customer Experience is a digital marketing
regression) to identify which behaviors in a visitor’s digital
                                                                      support solution that is designed to collect and feed big digital
journey connected strongly with business conversion events?
                                                                      interaction data – in the appropriate structure and context – into
Other predictive digital marketing applications include:
                                                                      your organization’s discovery, enterprise data warehouse, visual-
• Analytically forecasting website and mobile app visitation by       ization, advanced analytics, marketing automation and real-time
  traffic source, and identifying which ad-centric channels best      decision systems. Let’s take a look at the capabilities this
  predict overall traffic.                                            solution provides.
• Predicting techniques and improving outbound and
  inbound targeting rules for future marketing communication          Collecting Digital Interaction Behavior via
  and personalization efforts.                                        a Single Line Insert
                                                                      The single line insert (that is, Client Side Adaptor) records all
To succeed in these endeavors, you must get data that origi-
                                                                      online behavior – down to the millisecond – against the session,
nates from the web or from mobile apps out of traditional silos.
                                                                      visitor and the customer. This gives you an unprecedented level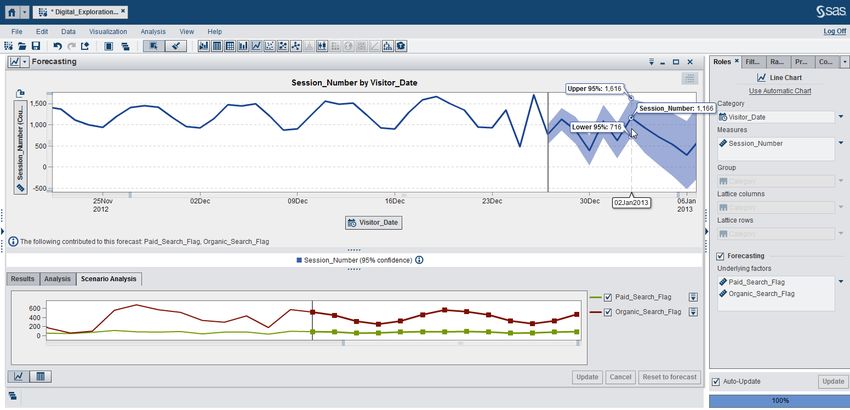
5

of insight into how your customers behave on your single- and         • Perhaps you want to identify which pathing activities result in
multiple-domain digital properties – including websites,                an unusually high number of abandoned sessions. There’s an
browser-based mobile apps and social media branded pages.               online form that you know most customers do not take the
                                                                        time to complete – but you do not understand why. To
Compared with traditional web analytics data collection                 identify and address this, you need to know at what point
methods, this approach has two important benefits:                      most people stop completing the form. Looking at raw data
                                                                        events alone would indicate form activity levels – and you
1. The single line insert captures all interactions. This signifi-
                                                                        could have multiple records per form. A visitor could also try
   cantly reduces tagging management process challenges,
                                                                        to fill in the form twice in the same session – something you
   and it improves analytic potential downstream.
                                                                        would need to use business rules to discern.
2. The single line insert does not need to be updated when
   new content is added to the website or app. As a result,
   issues with outdated, broken and missing tags cease to exist.
                                                                      Data Roll-Ups: Tying Digital Data
                                                                      to the Customer
Adding Business Context to                                            Traditional web analytic solutions and their respective data
                                                                      collection methodologies can populate a data mart with aggre-
Semistructured Digital Data
                                                                      gated data for web business intelligence. This gives you aggre-
Normalization is the conversion of raw event digital data into        gated information about your website, such as:
usable data with a business context. Through normalization,
data is classified into different types of digital activities, each   • Achievement of online goals and completion of online
with its own attributes. SAS Adaptive Customer Experience               transactions.
organizes and structures this data appropriately for feeding into     • Shopping basket information.
its analytical data mart.                                             • General details about visitor origination.

Digital marketing requires data normalization and multi-              SAS Adaptive Customer Experience enables you to combine
channel integration, both of which can be quite complex               this intelligence with individual customer records in the appro-
tasks – especially if you don’t have the right tools. Even the        priate structure and format for use in data mining, predictive
seemingly simple aspect of defining what a web session is             analytics, forecasting and optimization. Without this level of
has hidden complexities. For example, how do you define               information, you would be severely limited in terms of the level
sessions that span multiple data-processing windows or web            of detail to which you could perform analyses.
domains? Regardless of how data normalization is done, you
need to define and set up a huge number of business rules to
                                                                      Data Management: Ensuring
drive the classification process. These two examples illustrate
what we mean:                                                         Completeness and Quality
                                                                      SAS Adaptive Customer Experience uses SAS Data
• Let’s say that you want to understand origination in detail.        Management technologies to identify, match and consolidate
  That is, you want to know whether a customer found your             digital data. Together, these capabilities provide the appropriate
  business via an external referrer, an organic or paid search        context and level of accuracy for one-to-one customer analytics,
  link, a display ad or some other method. Because of the             marketing and relationship management.
  nature of websites, browsers and browser versions, the same
  origination (e.g., a specific Google organic search) might be       For example, given the many channels and devices through
  represented many different ways in your data. Data gover-           which customers can interact with your organization, identity
  nance and business rules are necessary to capture all of the        management is a complex problem for marketing and IT
  different permutations of this digital pathing, as well as unify    departments to tackle. How do you know if a given set of anony-
  them into a coherent customer search record with specific           mous website visits from one IP address involves the same or a
  attributes.                                                         different human being? Sometimes it isn’t possible to be sure,
                                                                      but sophisticated matching techniques that use retrospective
                                                                      processing can ensure the greatest effectiveness and accuracy.

                                                                      SAS Adaptive Customer Experience provides capabilities for
                                                                      synchronizing data, eliminating duplicates and tying data from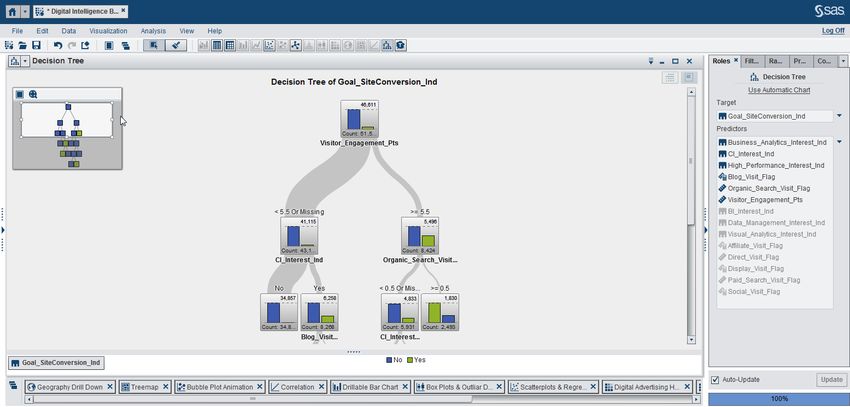
6

current customer web or mobile app visits to data from past       Compared with traditional web analytics data collection tech-
sessions to allow a complete view of customer behavior over       niques, the data model and organizational ownership of SAS
time. Effective data management also involves ensuring data       Adaptive Customer Experience offer three key benefits:
quality; for example, it is crucial to prevent customer records
                                                                  1. Organizations own the digital data streams that come from
from becoming corrupted through false matching data. Good
                                                                     their respective web properties, and it can be used in any
data quality improves the performance potential of marketing
                                                                     way desired, without limitation. In contrast, most web
analytics and visualization.
                                                                     analytics vendors own and limit access to the underlying
                                                                     data.
Digital Data Model and Data Ownership:                            2. You can configure how the data model is populated to match
Breaking Down the Web Analytics Silo                                 your organization’s unique digital properties, objectives and
An open, configurable and fully documented extract, transform        goals.
and load (ETL) data model includes 56 structured tables for       3. The data model not only reduces the time analysts must
session, visitor and customer level views. The information is        spend accessing and preparing data for downstream
stored in a digital data mart that you can access by any SQL         analytics and marketing, but it also provides the level of
query or SAS tool for query, reporting and analysis – for            detail that analysts need. Web analytics data models don’t
example, SAS Visual Analytics or SAS® Enterprise Miner™.             provide this level of detail. The data model enables analysts
                                                                     to combine customer-level digital data with any other source
                                                                     of internal or third-party data, and efficiently move through
                                                                     their workflow.

Figure 7. Visualizing SAS Adaptive Customer Experience.
7
SAS® Visual Analytics Enables SAS® Visual Analytics and Predictive
Marketing: Visual Advanced Forecasting
Prescriptive Analysis for Digital
To illustrate how advanced visual analytics can help you improve
and Integrated Marketing your approach to digital intelligence, let’s analyze digital visita-
Predictive analytics and exploratory data mining thrive on tion to sas.com (collected by SAS Adaptive Customer
detailed data. When we can bring together very granular digital Experience, which uses SAS Visual Analytics as the front-end
data streams that highlight consumer behavior and feed that user interface) from both a historical and predictive perspective.
into visual predictive models, we can improve our approaches
to segmentation, personalization, ad targeting and customer Historical View
experience management. Suppose that a manager asks, “What did our web traffic look
like over the last few months?” You can get the answer in just a
SAS Visual Analytics gives us the opportunity to watch predictive couple of clicks by assigning the Visitor Date and Visit Identifier
analytics and visualization technology mesh together. The elements to the visual, as seen in Figure 8.
biggest value of this data-neutral, advanced visualization
platform is that it enables you to see predictive insights that Predictive View
could never before be seen using traditional web analytics tools. Now suppose the department manager asks, “What’s going to
As the famous mathematician John W. Tukey said in his 1977 happen to web traffic in the next two weeks?” In one click, you
book Exploratory Data Analysis, “The greatest value of a picture can show a forecast of expected site traffic of any duration – no
is when it forces us to notice what we never expected to see.” coding required.
Figure 8.
Historical traffic
visitation pattern.
Figure 9.
Web traffic
forecast.8
What’s more, the technology uses champion/challenger fore- Below the forecast line graph in Figure 10, SAS Visual Analytics
casting. That means that multiple forecasting algorithms are is used to perform scenario analysis, sometimes referred to as
applied to the data in near-real time. The algorithm that is most simulation or what-if analysis. The model identifies that two
statistically accurate is then selected for the visualization. In segments – organic search and paid search – had a significant
other words, you get the most accurate result, no matter your effect on the forecast. You can then simulate inflated and
quantitative skill level. deflated effects of these independent variables.
Improving the Forecast As a digital marketer – and more specifically, a digital advertiser
or media planner – you have a limited amount of control over
You can improve how this model predicts future website traffic
organic search traffic. You have more control over paid search,
by providing more information from which it can learn. In
which is an ad-centric channel. What if you increased your paid
Figures 8 and 9, the visualization only represents visitors by
search advertising budget by varying amounts? What effect
date. Now we will add more data elements to describe the origi-
would that have on overall site traffic? That is actually very easy
nating visitor traffic sources – paid search, organic search, social,
to answer.
blog, affiliate and direct visitors who came to sas.com without
the stimulus of an advertisement.
Figure 11 shows a simulated a 35 percent increase in paid
By adding these segments to the forecast model’s consideration, search advertising. Let’s see how this change will affect the
you can see that the confidence interval (that is, best- and worst- traffic pattern forecast for the entire website. With today’s ever-
case scenarios) of the prediction gets much tighter. This show- changing ad budgets and short time windows, having the ability
cases greater accuracy in the model’s prediction compared with to simulate increases or reductions in ad spending in different
the earlier iteration. In addition, significance testing identifies marketing channels can be very valuable.
which segments have an impact on the prediction.
Figure 10.
Adding
underlying
factors to
improve the
accuracy of the
forecast.
Figure 11.
Inputs for digital
advertising
simulation.
Business Question: What if we increase
our paid search ad budget by 35% in the Showcases only
forecasted time period? How will that significant traffic
impact overall site traffic? source segments:
1. Organic search
Ability to inflate/deflate the impact of 2. Paid search
underlying factors by configurable time
periods and percentage weights or
constant values.9
Figure 12.
Forecast
simulation
visualized.
Now there are two numbers representing website traffic for
Jan. 2 in Figure 12. The baseline is the original prediction:
SAS® Visual Analytics, Digital
1,085. If you increase paid search by 35 percent, you can expect Segmentation and Outbound
1,323 visitors. That means that a 35 percent increase in ad
spending on paid search is predicted to produce a 22 percent
Marketing: Visual Decision Trees
increase in overall traffic over the next two weeks. To illustrate how visual decision trees can help you improve
your predictive marketing approach toward analytically
Based on how your organization manages budgets and deci- defined segmentation and data-driven campaign manage-
sions, you could explore different what-if scenarios. For ment, let’s review a second example of analyzing digital visita-
example, you could determine if the impact of increasing paid tion to sas.com to identify an attractive audience for a future
search advertising by 25 percent or 45 percent would be worth marketing communication.
the investment. This would be valuable information, indeed, for
a manager or director. What Drives Conversions on sas.com?
Suppose that a manager asks, “What are the most important
factors that differentiate visitors who convert and do not convert
on our website?” This is the perfect question for a supervised
predictive model.
Figure 13.
Assigning the
variable.10
Figure 14.
Adding
predictors
(that is,
independent
variables).
Figure 15.
Visual analytic
segmentation.
If visitors showcase high website
engagement and arrive via organic
search, probability to convert
increases from 35% to 73%.
If visitors showcase high website
engagement, probability to convert
increases from 10% to 35%.
Analytic Segment Size = ~2,500
After the target variable has been added, you can see that 90 organic search, display higher likelihoods of converting
percent of visitors did not convert, and 10 percent of visitors did compared with peers who displayed other behaviors. It is the
convert. You can now visually select potential predictors to interaction of these two characteristics together that drives this
identify unique characteristics of higher- and lower-value result. The next logical step is to take action on this insight.
audience segments using an advanced data mining algorithm
that iteratively goes through thousands of potential scenarios The solution enables you to select unique segments and subset
before arriving at a statistically supported answer. the audience to a new visualization. This is empowering, as no
programming or coding is required, and the intelligence of the
The in-memory processing power of SAS Visual Analytics algorithm that defined this audience segment will carry over to
enables you to apply sophisticated math, such as a decision the next step within the filter. In addition, you can easily filter out
tree, to large digital data and get near-real-time responses. This members of this segment who have achieved conversion and
is tremendously beneficial for addressing segmentation chal- focus on lookalike prospects who are showcasing conversion
lenges, as you can very quickly identify attractive audiences. signals, but have not crossed the finish line.
Figure 15 provides one example of how the decision tree The last step is to create a targeted audience list. After selecting
analyzed the parent population of digital visitors and delivered the variables, you can use this attractive segment in a marketing
insights into important behaviors that help explain why this automation system, real-time decision platform or communica-
specific segment is attractive. Specifically, visitors to sas.com tion optimization exercise.
who show high scores of engagement, and originate from an11
Figure 16.
Visual segment
selection.
• Select Segment
• Click
• Choose “Create
Visualization From Node”
Figure 17.
Prepopulated filter.
Figure 18.
Audience
segment table
available for
export.12
Conclusion Learn More
Consumers today have high expectations when it comes to how Get more information about SAS Adaptive Customer
brands interact with them. Marketers understand this. They Experience.
know that to meet these expectations, they need deeper insight
Find out more about SAS Visual Analytics.
into their customers across all channels – including web, social
and mobile. To meet this challenge, the two worlds of advanced Learn about SAS Customer Intelligence solutions.
analytics analysts and digital analysts must converge and begin
Explore hot topics in marketing at Marketing Insights.
working together rather than in silos.
For fresh perspectives from other marketers, read our
SAS Adaptive Customer Experience helps you achieve this by Customer Analytics blog.
collecting detailed digital data and providing business context Follow us on Twitter: @SAS_CI
to connect the integrated marketing department to online
customers. The predictive marketing capabilities that are acces-
sible to data miners and business analysts through SAS Visual
Analytics are designed to meet the market’s rising demand for
enabling big data analytics to take full advantage of digital References
marketing insights. 1
“Predictions 2014: The Year of Digital Business,” Forrester
Research, Inc., December 2013.
2
Adobe. Sept. 23, 2013. “Digital Distress: What Keeps
Marketers Up at Night?” Adobe Systems Inc.
3
“Digital Intelligence Replaces Web Analytics,” Forrester
Research, Inc., November 2013.
4
Gordon, Ruth and Hulls, Katharine. January 2014. “Digital
Marketing Insights Report 2014.” Teradata/Celebrus
Technologies.To contact your local SAS office, please visit: sas.com/offices SAS and all other SAS Institute Inc. product or service names are registered trademarks or trademarks of SAS Institute Inc. in the USA and other countries. ® indicates USA registration. Other brand and product names are trademarks of their respective companies. Copyright © 2014, SAS Institute Inc. All rights reserved. 107076_S123970.0514
You can also read