Harmful Digital Communications in New Zealand - ANNUAL POPULATION SURVEY 2018 Prepared by Neil Melhuish and Dr. Edgar Pacheco - Netsafe
←
→
Page content transcription
If your browser does not render page correctly, please read the page content below

Harmful Digital Communications in New
Zealand
ANNUAL POPULATION SURVEY 2018

Prepared by Neil Melhuish and Dr. Edgar Pacheco

1
HARMFUL DIGITAL COMMUNICATIONS IN NEW ZEALAND: ANNUAL POPULATION SURVEY 2018
Wellington, New Zealand, October 2019
www.netsafe.org.nz
research@netsafe.org.nz
ISSN: 2538-0796

                  ATTRIBUTION-NONCOMMERCIAL-SHAREALIKE
                  https://creativecommons.org/licenses/by-nc-sa/4.0/ [English]
                  https://creativecommons.org/licenses/by-nc-sa/4.0/legalcode.mi [Te Reo Māori]

2
Contents
Executive summary                                    4
    Key findings                                     5
Methodology                                         6
    Objectives                                       6
    Survey tool                                      6
    Population sample                                6
    Ethics                                           7
    Limitations                                      7
Findings                                            8
    New Zealanders’ digital behaviour                8
    Awareness of the legislation                    15
    Experiences of harmful digital communications   17
    Accessing support services                      24
Concluding remarks                                  30
Acknowledgements                                    31
Appendix                                            32
    Demographic information                         32
    Summary of 2017 and 2018 results                35
References                                          38

3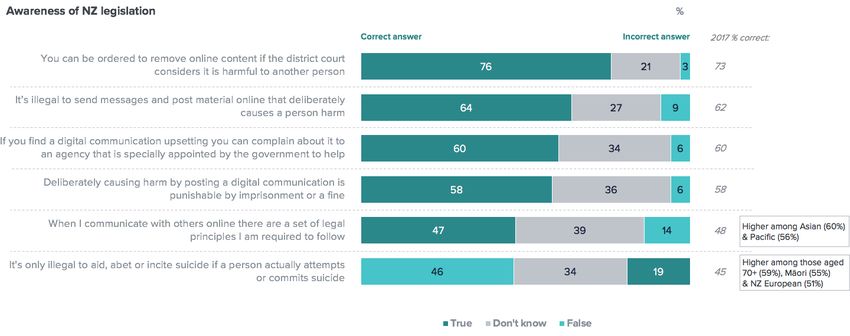
Executive summary
The Harmful Digital Communications Act 2015 (the Act) was introduced to deter, prevent and
mitigate harm caused by digital communications and to provide victims of harmful digital
communications with a quick and efficient means of redress. The Act recognises that online
abuse and harassment is not something that can be improved through regulation and
enforcement alone. In addition to the new tools it created for the Police and the courts,
Netsafe was appointed as the Approved Agency. The role of the Approved Agency under the
Act is to assist New Zealand internet users in dealing with harm and distress caused through
any form of digital communication. To achieve this, Netsafe has statutory functions to provide
online safety advice and education to the public and collaborate with government agencies
and service providers.

Netsafe established a research programme in November 2016 to generate evidence that
informs internet safety policy and practice as part of its broader role as the Approved Agency.
As part of this work Netsafe conducts an Annual Population Survey (APS) to provide research-
based insights into New Zealand adults’ online experiences of unwanted digital
communications, including when this results in emotional distress or harm. Specifically, it
provides information about people’s self-reported experiences of online risks and the actions
they take to reduce them, their awareness of the communications principles underpinning the
Act and other aspects of this legislation, and the responses people had to receiving unwanted
communication. The first APS was carried out in 2017 with its findings being published in early
2018 (see Netsafe, 2018). This paper reports on the second APS carried out in June 2018. We
believe that generating insightful, reliable evidence about New Zealanders’ online
experiences is vital to develop adequate support that reflects their experiences and needs.

The APS, as a research tool, was designed as a modular online survey allowing Netsafe
flexibility to add questions to address new topics as they emerge. For the 2018 APS, we
included two new modules based on topics about which reflection and discussion were based
only on anecdotal evidence. The results from these have been reported separately. In
November 2018, we released Online hate speech: A survey on personal experiences and
exposure among adult New Zealanders (Pacheco & Melhuish, 2018). The study provides, for
the first time, evidence of the extent and nature of a behaviour affecting, primarily, minority
groups in New Zealand. This was followed by Image-Based Sexual Abuse: A snapshot of New
Zealand adults’ experiences (Netsafe, 2019) which explored the prevalence and complexity of
a behaviour that is potentially more distressing and harmful compared to other negative online
experiences. This approach increases the overall contribution the 2018 APS makes to the
body of knowledge about online safety in New Zealand.

A key goal of the APS project is to identify trends regarding harmful digital communications in
New Zealand over the period 2017-2021. We do this based on a core set of questions that are
replicated every year. With a few exceptions the 2018 results are similar to those from 2017
i.e., within or around the margin of error. While it is too early to be able to identify longitudinal
trends in the data, this report does provide comparisons of the 2018 and 2017 results where
the differences between them are significant.

This study’s findings will be of interest to policymakers, researchers, and any individuals or
organisations involved in developing New Zealand’s internet safety policies and practices.

4
Key findings

PEOPLE’S DIGITAL BEHAVIOUR

    1.   Over the last year New Zealanders have become more concerned about their privacy
         and conducting commercial or financial matters online. As observed in 2017, New
         Zealanders tend to view the most effective way of keeping safe online through a
         ‘security lens’. This continues in 2018, with an increased focus on this aspect of keeping
         safe online.
    2. Similar to last year, 7 in 10 people have taken action to protect themselves and others
       online because they are concerned about online security or want to avoid unwanted
       approaches from others.
    3. Those aged over 50 are more likely than average to have taken protective action while
       those under 30 years old are more likely to believe they are safe and free from online
       risk or harm.
    4. More than 5 in 6 of all New Zealanders would consider taking further protective action
       in the future. People tend to say they will keep up to date with security risks or update
       security settings rather than changing their online behaviour.

AWARENESS OF RIGHTS AND OPTIONS

    5. New Zealanders’ awareness of legislation around digital communications is consistent
       with 2017. The lesser known parts of legislation include the existence of legal principles
       about online communication and the fact that it’s illegal to incite someone to suicide
       (regardless of whether they take action).

EXPERIENCES OF HARMFUL DIGITAL COMMUNICATIONS

    6. While over a third of New Zealanders have experienced unwanted digital
       communications in the last year, only 1 in 10 people said it had a negative impact on their
       daily life (this is similar to 2017).
    7. Some types of online communication are more strongly associated with negative
       impacts including deliberately harmful, humiliating, or threatening communication,
       online stalking, false allegations, sharing of intimate pictures/recordings without
       permission, and, to a lesser extent, exclusion from friendship groups.

ACCESSING SERVICES

    8. 18% of those experiencing unwanted digital communication contact support services
       (this proportion has not changed since the 2017 survey).

5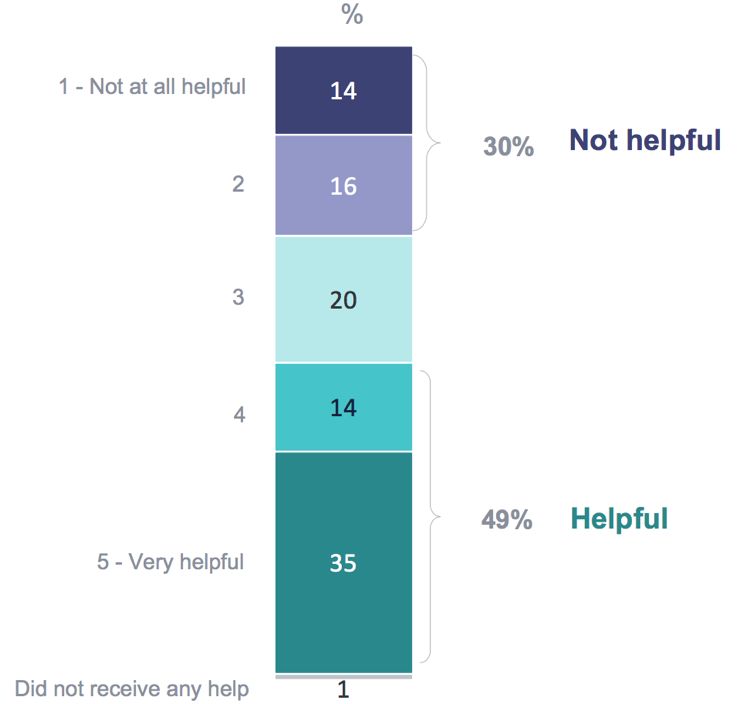
Methodology
Objectives
The general objective of the APS was to measure, describe and understand the attitudes,
behaviours and experiences of adult New Zealanders when using new technologies and
dealing with harm and distress caused by digital communications.

The specific objectives of the APS were:

    1. To measure and explain people’s digital behaviour aimed at addressing online harm and
       distress in the last twelve months;
    2. To understand the extent of people’s awareness of their rights and options under the Act;
    3. To understand the extent of people’s awareness and use of available services; and
    4. To gauge the extent of people’s perceived personal experiences of harm and distress
       through digital communications.

Survey tool
The questionnaire included dichotomous, multiple choice, and semantic differential questions
to measure people’s experiences in the last twelve months. The online survey was conducted
from May 30 to June 30, 2018. The 2018 APS survey shared a set of core questions with the
2017 APS to enable results to be compared. However, questions asked in 2017 about the
digital technologies people use in their daily lives, how they use them, and their perceived
level of competence were omitted from the 2018 survey. As these questions are not directly
related to the purpose of the Act they are not monitored annually. Their omission enabled the
inclusion of two modules of questions focused on the topics of adults’ experiences of online
hate speech (Pacheco & Melhuish, 2018) and image-based sexual abuse (Netsafe, 2019). The
APS also included the collection of some qualitative data. The reason for gathering this was to
uncover new issues and insights based on the perceptions and views of the respondents.

Population sample
The 2018 APS survey was conducted online by Colmar Brunton with 1,001 New Zealanders.
Participants came from a representative sample of New Zealand adults (aged 18+) in terms of
age, gender, ethnicity and region1. The maximum margin of error for the whole sample is
±3.1%, and ±4.4 when comparing survey results between 2017 and 2018 at the 95%
confidence level (assuming 50% agreement).

The 2018 APS included consideration of the experiences of people identifying with different
sexual orientations. Netsafe used Statistics NZ’s (2018b, 2018a) proposed sexual orientation
framework and the concept of sexual identity to inform the questions gathering data on sexual
orientation in consultation with the Human Rights Commission. For the purpose of the 2018
APS, sexual orientation covers the ways in which a person’s sexuality is expressed and the
terms they choose to identify with. Respondents were asked which best describes how they

1
    In each of the 2017 and 2018 surveys, data has been weighted to 2013 Census proportions to ensure it
    represents the NZ population of those aged 18+ in terms of gender, age, ethnicity and regional distribution.

6
think of themselves: Heterosexual or straight, Gay or lesbian, Bisexual, Other (e.g. Pansexual)2,
or Prefer not to say. As there were relatively fewer respondents who identified as gay, lesbian,
bisexual or other, these respondents have been combined for data analysis purposes in order
to make statistically robust comparisons. Therefore, throughout this report we refer to
participants as identifying either as heterosexual or as non-heterosexual.
A detailed description of the demographic profile for APS participants is provided in the
Appendix.
Ethics
In carrying out the 2018 APS, Netsafe adhered to the ethical principles that underpin integrity
and quality in social research. Ethics were given high consideration at all stages of the
development of the project. Considering the nature of the study topic, namely digital
communications and experiences of harm and distress, Netsafe sought to minimise
disturbance to the survey participants. In this respect, the survey questions were designed to
avoid harm. Informed consent from the participants was obtained at the beginning of the
online survey. The participants received information about the purpose of the 2018 APS, the
name of the institutions behind the study, and an explanation of how the data they provided
will be protected and used. Netsafe also ensured that Colmar Brunton, the market research
company in charge of delivering the online survey, had in place protocols to respect and
safeguard the rights and safety of the participants. Furthermore, contact information for
support services, such as Netsafe’s helpline, were also provided to the survey respondents.
Limitations
The following limitations have been identified:
1. A general limitation of surveys is that they collect data at a single point of time. Hence,
they present a snapshot of a particular reality. While the results of the 2017 and 2018
APS can be compared it is still too early to be able to identify trends in the data. This is
why the APS is being conducted annually from 2017-2021.
2. Although the online survey collected qualitative data, it is necessary to be aware that
surveys in general cannot fully capture the meanings and perceptions of respondents.
To cope with this limitation, the qualitative questions in the survey were designed in a
way that was easy to understand for the respondents, so they felt encouraged to share
their opinions. The use of semantic differential questions in the online survey also
helped to minimise this limitation.
3. Identifying specific challenges for “vulnerable” internet users is limited by the
complexity of identifying individuals.
2
Note, respondents who selected ‘Other’ were able to describe in their own words how they prefer to identify
themselves.
7Findings
This section describes the key findings from the APS survey. It is divided into four parts. The
first presents findings about adult New Zealanders’ digital behaviour in terms of the access to
and use of new technologies. The second depicts findings regarding the level of participants’
awareness of related New Zealand legislation, namely the Act. The subsequent part reports
on participants’ experiences of digital communications, including perceptions of harm and
distress. The final sub-section describes participants’ individual responses as well as access to
services and resources to deal with the impact of digital communications.
New Zealanders’ digital behaviour
FOCUS OF INQUIRY
• People’s biggest concerns and perceived risks about going online
• Actions people have taken, and plan to take, to protect themselves or others online
BIGGEST CONCERNS AND PERCEIVED RISKS ABOUT GOING ONLINE
Over the last year New Zealanders have become more concerned about their privacy and
conducting commercial or financial matters online. Respondents generally described a larger
number of specific concerns compared with last year.
The average number of
specific concerns described in
2017 was 1.5; this increased to
1.8 in 2018 (driven by an
increase in privacy concerns
and commercial/financial
concerns).
indicates a significant increase/decrease since 2017
Base: All respondents (1,001)
8In their own words
“Have to watch out for fake websites, phishing scams and spam emails, even by people that
are trusted. Friends’ email addresses can become compromised. Click bait.”
– Male, 18-29 years, NZ European
“Access of my information from outside sources like new websites. Online purchases of
products or services with my financial details. Online storage - How do I know how safe they
are and what happens if I want to change my storage service?”
– Male, 50-59 years, Pacific
“Giving too many people my email address and answering personal questions from inquirers.”
Female, 70 years or older, NZ European
“Cookies and targeted advertising.”
– Female, 18-29 years, NZ European/Māori
“Being phished for personal information, unauthorized use of cookies, malwares clogging up
the PC (the possibility of getting infected with viruses).”
– Male, 30-39 years, Asian
DIGITAL COMPETENCY
Q2. Which of the following best describes your experience when using digital devices?
Two thirds say they rarely require assistance when using technology. Since 2017 there has
been a slight decrease in the proportion that say they ‘very rarely/never’ require assistance
(from 42% to 36%). This decrease was prominent among those who express concern about
online commercial/financial risks (-10%). On the other hand, the proportion that say they
‘frequently/usually/always’ require assistance has grown slightly to 5% (up from 2% in 2017).
indicates a significant increase/decrease since 2017
Base: All respondents (1,001)
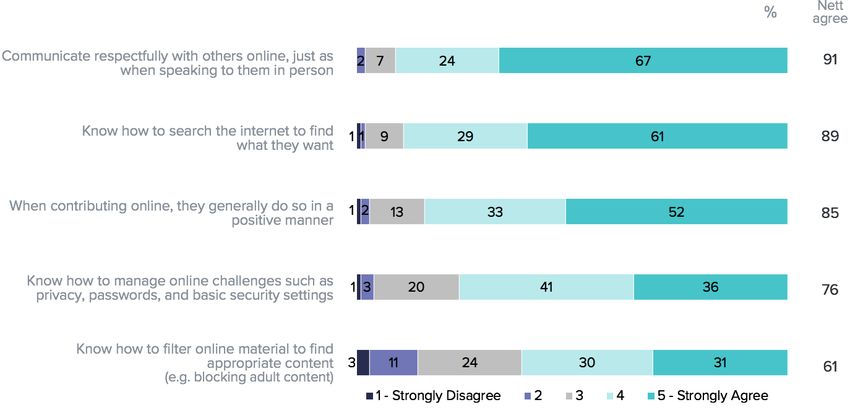
9Q3. How would you rate your personal knowledge about keeping safe and secure online?
More than 8 in 10 say they know at least a fair amount about keeping safe online. Only 6 in 10
agree they know how to filter for appropriate content. These findings (about knowledge and
specific aspects of competency) have not significantly changed since 2017.
Base: All respondents (1,001)
Q4. On a scale of 1 – 5, with 1 being strongly disagree and 5 being strongly agree, how
would you rate the following statements…
Base: All respondents (1,001)
Those aged under 40 are less likely to require assistance when using technology (83% rarely
require assistance, compared to the average of 66%). Those who are Asian (94%), aged under
30 (91%) and males (86%) are more likely to say they know a lot or a fair amount about
keeping safe online. Self-reported knowledge about filtering online material and managing
online safety challenges is higher among those aged under 40.
10ACTION TAKEN TO PROTECT SELF OR OTHERS ONLINE
72% of New Zealanders have taken action in the past year to protect themselves or others
online. This was similar in 2017 (70%) although, since last year, an increasing proportion have
been prompted (by a website) to change their profile. Those aged over 50 are more likely to
have taken protective action (78%).
Q5. In the last 12 months, have you taken any
action(s) to protect yourself or others from
potential risks or harm online?
Base: All respondents (1,001)
Q5.a And which of the following describes your reasons for taking action(s)?
Typical motivations include concern about online security or preventing unwanted
approaches from others. Those aged over 60 are more likely to say the reason was because
they were sent (37%) or came across (25%) unwanted content. Pacific people are also more
likely to give the reason that they were sent unwanted content (43%). Those who haven’t
taken recent action tend to believe they have done everything they can to protect themselves
online. These findings are very similar to 2017.
indicates a significant increase/decrease since 2017
Base: Respondents who have taken action to protect self or others online in last 12 months (713)
11Q5.b And which of the following describes your reasons for not taking action to protect
yourself and others online?
Those aged under 30 are more
likely to say they feel safe and free
from risk and harm online (32%).
Those aged over 60 (16%) and
females (13%) are more likely to
have someone else take action on
their behalf.
Base: Respondents who have not taken action to protect self or others online in last 12 months (218)
Q6 Please describe any action(s) you have taken in the last 12 months to protect yourself
and others from potential risks or harm online.
Two thirds of New Zealanders have improved their online security or privacy settings in the
last year. Since 2017, fewer mentioned using protective technology such as antivirus software.
indicates a significant increase/decrease since 2017
Base: Respondents who have taken action to protect self or others online in last 12 months (713)
12Q6.a. Overall how effective do you think these actions were?
Three quarters of those who have taken protective actions believe their actions were effective
(this has not significantly changed since 2017). People believe their actions to have been more
effective at protecting them online when they have bought or installed protective software, or
if protective software automatically updates.
Males are more likely to use protective technology (57%) while females are more likely to
improve their online security or privacy (75%).
Base: Respondents who have taken action to protect self or others online in last 12 months (713)
13CONSIDERATION OF FUTURE PROTECTIVE ACTIONS
More than 5 in 6 New Zealanders would consider taking further action to protect themselves and others online in future. People tend to say
they will keep up-to-date with security risks and update security settings to protect personal information, rather than changing what they do
online. These findings have not significantly changed since 2017 (although a slightly larger proportion now say they would consider
changing the way they use the internet – such as spending less time online).
Q7. Now thinking ahead to the next 12 months, which of the following precautions would you consider taking to protect yourself and
others from potential online risk or harm?
Base: All respondents (1,001)
14Awareness of the legislation
FOCUS OF INQUIRY
• The principles that people believe are most important when communicating online
• People’s awareness of aspects of the Harmful Digital Communications Act 2015
MOST IMPORTANT PRINCIPLES WHEN COMMUNICATING ONLINE
Q8. Below is a list of ten statements about what digital communication should NOT be or include. Select the three most important to you.
New Zealanders believe the three most important principles for communicating online are: not to get someone to harm themselves, not to share
intimate images of someone without their permission, and not to share indecent or obscene content. See Appendix for more detailed results.
Base: All respondents (1,001)
15RIGHTS AND RESPONSIBILITIES
Q9. Now thinking about your rights and responsibilities under current New Zealand legislation, please indicate whether you think the
following is true or false.
Three quarters of New Zealanders are aware that the district court can order the removal of harmful online content. Consistent with last year, the
lesser known aspects of legislation are the existence of legal principles when communicating online, and that it’s illegal to incite someone to
suicide regardless of whether they take action. These findings have not significantly changed since 2017.
Base: All respondents (1,001)
16Experiences of harmful digital communications
FOCUS OF INQUIRY
• Prevalence of unwanted digital communications, including those that cause harm
• Relationship between sender and receiver of unwanted digital communications
• Channel(s) that unwanted digital communications were received through
• Whether people’s online experiences are part of a wider issue happening offline
• Emotional and behavioural impacts of the experience
NEW ZEALANDERS’ EXPERIENCE OF UNWANTED DIGITAL COMMUNICATIONS
Over a third of New Zealanders (35%) have experienced at least one type of unwanted digital
communication in the past year. 1 in 10 (10%) experienced an unwanted digital communication
which had a negative impact on their ability to perform daily activities3.
Around 1 in 10 have received digital communication(s) that:
• were indecent/obscene with violent or sexual content;
• said offensive things about their lifestyle or religious/political beliefs;
• included unwanted sexual advances; or
• excluded them from a peer or friendship group.
Those who are aged under 30 and do not identify as heterosexual have a greater risk of
experiencing almost all types of unwanted digital communications. Those with long-term
health issues, Māori, and Asian respondents have a greater risk of experiencing particular
types of unwanted communications – see Appendix for more detail on demographic
differences in experience of unwanted digital communications.
3
In 2017, 32% experienced one or more incidents, with 9% experiencing an online communication that had a
negative impact on their life.
17Q10. In the last 12 months, have you personally received an unwanted digital communication (e.g. email, text, photo, video, or online
comment) that…
The most common experience is receiving many unwanted digital communications from the same person (16% in the past year).
Base: All respondents (1,001)
18Q11. And in the last 12 months, have you seen or heard about an unwanted digital communication (e.g. email, text, photo, video, or online
comment) about someone you know (friend, family or colleague)?
11% of those who haven’t personally experienced unwanted communications have witnessed such an incident happening to someone close to
them.
Base: All respondents (1,001)
19PROXIMITY TO SENDER OF UNWANTED DIGITAL COMMUNICATION
Q12. Who was the person that sent this communication?
Half of unwanted digital communications are either sent by a stranger or it is unclear who the
sender was (these findings are not significantly different from 2017).
Base: Respondents at least one incident of unwanted digital communications in the last year (362)
Q12.a. And how well do you know the person that sent this communication?
The sender is known
well by just over two in
five (43%) of people who
received unwanted
communications (the
equivalent proportion in
2017 was similar at 41%).
Base: All respondents (1,001)
20CHANNELS FOR UNWANTED COMMUNICATIONS AND LINKS TO OFFLINE EVENTS
Q13. Where did this experience of harmful digital communication occur?
Unwanted digital communications are primarily received via email (often spam), followed by
posts on social media. These findings are very similar to the 2017 survey.
Base: Respondents experiencing at least one incident of unwanted digital communications in the last year (362)
Q14. And was this experience part of a wider issue that was happening offline?4
These communications tend to be confined to
online interactions, with only about one in five of
all participants experiencing an unwanted digital
communication reporting that this was part of a
wider issue that crossed into their offline lives. In
contrast, this was true for 36% of people with a
long-term disability.
Base: Respondents experiencing at least one incident of unwanted digital communications in the last year (362)
4
By offline we mean in a physical environment, such as through face-to-face interactions.
21IMPACT OF UNWANTED DIGITAL COMMUNICATIONS
Q15. Which of the following describes your emotional reaction to this experience?
Seven in ten people who received
unwanted digital communications say
it did not negatively affect their ability
to do everyday activities. A quarter of
people also did not experience a
negative emotional impact. The most
common emotional reactions are
anger and frustration. Males (32%) and
those who identify as heterosexual
(28%) are more likely to say they were
not bothered.
The only significant change since
2017 is an increase in the proportion
that report feeling ‘frustrated’ (from
22% to 30% of those experiencing
unwanted digital communication).
indicates a significant increase/decrease since 2017
Base: Respondents experiencing at least one incident of unwanted digital communications in the last year (362)
Q16. As a result of this experience, what was the impact on daily life?
70% of participants were not
negatively affected by the
unwanted digital communication.
Experiencing a negative impact on
daily life due to unwanted digital
communication is more common
among those with a long-term
disability (52%), those with long-
term health issues (49%) and Māori
(46%).
Base: Respondents experiencing at least one incident of unwanted digital communications in the last year (362)
22Those experiencing multiple types of unwanted digital communication tend to encounter negative impacts (70% of those who have
experienced 5 or more types of unwanted communications in the past year experienced negative impacts). However, it should be noted this
group is only small within the overall population (6% of all New Zealanders experienced five or more types of unwanted digital
communication in the past year).
Base: Respondents experiencing at least one incident of unwanted digital communications in the last year (362)
23Accessing support services
FOCUS OF INQUIRY
• The types of responses that people have to receiving unwanted digital
communications
• How effective their responses were in mitigating the impact of the situation
• Which support services people accessed and how effective they were
• The support services that people may consider using in future
RELATIONSHIP BETWEEN RESPONSES TO UNWANTED DIGITAL COMMUNICATIONS
AND PERCEIVED EFFECTIVENESS
Q17. How did you respond to this experience in order to change the situation?
The most common responses to receiving an unwanted digital communication continue to be
either blocking the person responsible or ignoring the situation.
Base: Respondents experiencing at least one incident of unwanted digital communications in the last year (362)
24Q18. And, overall, how effective was your response(s) at changing the situation?
Of those who took action to
change the situation, a small
majority (58%) considered their
response effective at having
changed the situation (this is
similar to the equivalent proportion
in 2017, which was 60%).
Responses tended to be perceived
as ineffective because it is hard to
change other people (including
their online behaviour).
Base: Respondents experiencing an unwanted digital communication who did not ignore the situation (262).
In their own words
“There will always be a way for someone to interact with you in the way they choose if they
are intent on doing so."
– Female (18-29 years, Asian) who reported the person responsible to the website or
online service, withdrew from the social media site or online forum and unfriended or
blocked the person responsible.
“Was told there is nothing that can be done about it by Police and Facebook didn’t do a
thing."
– Male (40-49 years, NZ European/Maori) who reported the person responsible to the
website or online service, and reported the problem to law enforcement
“The person causing harm had no idea how I really felt about the situation."
– Male (40-49 years, NZ European) who stopped attending certain offline events or
places
“I don’t know what happened after that. It was a viral post sent via a message that the sender
wasn’t aware of."
– Female (18-29 years, Māori) who reported the person responsible to the website or
online service
“It didn’t change anything about what was said."
– Male (60-69 years, NZ European) who stopped attending certain offline events or
places
25USE OF SUPPORT SERVICES
Q19. Did you contact any of the following services in order to help you? Which of the
following did you rely on as your main source of help or support?5
Those who reached out for support often contacted an Internet service provider (48% of those
who contacted a support service) or the police (31%)6.
% the one main support service used
% used this support service in conjunction with other services
indicates a significant increase/decrease since 2017
Base: Respondents experiencing at least one incident of unwanted digital communications in the last year (362)
5 Other sources of support are family, friends, church and human resources..
6 Note, because of the small sample sizes involved in this analysis (n=66 in 2018), it is inappropriate to compare
changes in the specific support services used since the previous survey.
26Q20. Please describe your reasons for choosing to contact the support service7.
Base: Respondents who had used a support service to help them (66)
Q21. And how helpful was the support you received?
Of those who contacted a support
service, 4 in 10 found the support
helpful and a further 3 in 10 were
neutral.
Those who did not find the support
helpful tend to say this because they
felt that no action was taken or were
not informed what action was taken to
resolve the matter.
Base: Respondents who had used a support service to help them (66)
7
Other reasons include checking the legality of the incident, making others aware of the issue or person
responsible, or to find out their legal rights or options.
27In their own words
"They told me it was a civil matter and that it was beyond their powers. Basically, didn’t want
to know me."
– Male (30-39 years, NZ European/Māori) who sought help from the Police after
someone physically threatened or intimidated them, tried to embarrass or humiliate
them online and said offensive things about them, their lifestyle or their religious or
political beliefs.
“I feel they don’t want to have to do the paperwork involved in dealing with it. A small-town
police station."
– Female (30-39 years, NZ European) who sought help from the Police after someone
physically threatened or intimidated them and they had received many unwanted
communications from the same person.
“The time, money and effort spent did not support a favourable outcome."
– Male (60-69 years, Asian) who sought help from a lawyer after someone “maligned
their reputation”, excluded them from a friend group, and received many unwanted
communications from the same person.
“The lawyer had never come up with anything like this before with things in social media.”
– Female (50-59 years, NZ European) who sought help from a lawyer due to being
excluded from a peer or friendship group.
"Not enough follow up. A notification to say ‘this post has been removed’ would have
sufficed."
– Female (18-29 years, Māori) who sought help from an Internet service
provider/platform after seeing violent or sexual content that was indecent or obscene.
28FUTURE CONSIDERATION (FOR THOSE WHO HAVE NOT EXPERIENCED UNWANTED COMMUNICATIONS)
Q22. Imagine you received an unwanted online message. Who would you turn to for help? And who would you turn to for help first?
Those who had not experienced certain types of unwanted digital communications were asked who they would turn to for help if they
received a particular type of unwanted content in the future. Police are considered the primary source of support in most cases, but in
particular for dealing with intimate images/recordings being shared without consent or for being intimidated or physically threatened online.
People tend to say they would deal with the issues themselves if excluded from friendship groups or receiving unwanted sexual advances.
Online experiences mentioned in boxes indicate experiences which make people more
likely to use that particular support service.
Base: All respondents, excluding those personally experiencing each type of unwanted digital communications in the last year (1,001)
* Other support services mentioned are iwi or marae member (1%) and someone else (3%).
29Concluding remarks This report has presented the main findings of a nationally representative study about the experiences, attitudes, and behaviours of New Zealand adults regarding new technologies and digital communications. It is the second annual report to explore this topic in the context of the implementation of the Harmful Digital Communications Act 2015. In relation to the most important findings in this report – the prevalence of unwanted digital communications people receive and their impact – again, the results are consistent with 2017: over a third of New Zealanders have experienced unwanted digital communications, with 1 in 10 people saying it had a negative impact on their daily life. This, and the closer look at adults’ experiences of image-based sexual abuse (Netsafe, 2019) and online hate speech (Pacheco & Melhuish, 2018), reinforces the 2017 conclusion that “adults can also be affected by digital communications, sometimes with devastating outcomes” (Netsafe, 2018, p. 44). Specifically, this study again highlights how certain population groups (including young adults, people with long-term health issues, Māori and Asian peoples) are at increased risk of experiencing online challenges and risk – see page 37. It is of particular interest and concern to note how non- heterosexual New Zealanders are at elevated risk of experiencing a wide range of unwanted digital communication, including having offensive things said about them, being excluded from friendship groups, being physically threatened or intimidated or receiving an unwanted sexual advance. This finding is again reflected in Netsafe’s reports about online hate speech and image-based sexual abuse (Netsafe, 2019; Pacheco & Melhuish, 2018) and reflects the findings from other research highlighting the vulnerability of same or both sex attracted New Zealanders to bullying and discrimination (Henrickson, 2007; Lucassen et al., 2014). Netsafe believes that, notwithstanding the extensive media coverage of Israel Folau’s controversial online comments in 2018 and 2019 (Newshub, 2018; Radio New Zealand, 2018; Stuff, 2019), this is an issue that deserves more public attention. The findings from the 2018 APS show that most New Zealanders continue to think about improved technical security as the best way to keep safe online, and this is reflected in the nature of the concerns they report about the challenges or risks of going online. At the same time, while it is encouraging that more than 80% say they know at least a fair bit about keeping safe online, there is clearly more work to be done on developing people’s capability to stay safe online. However, while digital competency is a prerequisite for taking action to protect from potential risks or harm online, the only area in which there was a significant shift from 2017 was caused by default rules requiring users to change or review their profile settings. People’s use of protective technology such as antivirus software is still important, though it is interesting to note the reduction in reported use of antivirus software and, in the absence of other respective data on the install base for this type of product, it will be interesting to see whether this develops into a trend in future APS studies. While the reported level of awareness regarding New Zealand legislation is around the same level in 2018 as in 2017 the rates are consistent between the years. As was noted in the 2017 APS report, while most New Zealanders may not be familiar with specific aspects of the Act presented to them, their views of what behaviour is important online are generally well aligned with them. 30
With a few exceptions the 2018 results are similar to those from 2017 i.e., within or around the
margin of error. The range of contextual factors that could influence New Zealanders’
experiences of harmful digital communications are not currently well understood. For
example, there are uncertainties in the tractability of social change related to sending and
sharing such communications, and divergent viewpoints on definitions of online risk and harm.
Such challenges are not unique to understanding and addressing harmful digital
communications issues. As a consequence, while the APS data collected so far provides
valuable insights into New Zealanders’ experiences of unwanted digital communications it is
still early to identify longitudinal trends. However, as Netsafe continues to collect data from
the APS over coming years a better understanding of this phenomenon will emerge.

Acknowledgements
We would like to thank Taine Polkinghorne, the Human Rights Commission’s Advisor on
Sexual Orientation, Gender Identity and Sex Characteristics (SOGISC), who provided advice
on gathering data on sexual orientation. Our gratitude also goes to Lisa Thornhill, Colmar
Brunton, and Ian Binnie, Solasta Consulting, for their contribution to the development of the
survey and initial data analysis.

31
Appendix
Demographic information

AGE GROUP

ETHNICITY

GENDER IDENTITY

                                              Base: All respondents (1,001)

SEXUAL ORIENTATION

     Sexual orientation         Percentage

     Heterosexual or straight   89%

     Gay or lesbian             3%

     Bisexual                   3%           6% non-heterosexual

     Other (e.g. pansexual)     0.3%

     Prefer not to answer       5%

                                              Base: All respondents (1,001)

32
REGIONAL LOCATION
Base: All respondents (1,001)
HIGHEST EDUCATIONAL ATTAINMENT OR QUALIFICATION
Highest educational qualification Percentage
Post-graduate qualification 13%
University degree 27%
Trade qualification 8%
Tertiary diploma/certificate that does not require degree 22%
High school qualification 22%
No qualification 6%
Unsure 1%
Base: All respondents (1,001)
33ANNUAL HOUSEHOLD INCOME, BEFORE TAX
Annual household income Percentage
$20,000 or less 4%
$20,001 - $30,000 5%
$30,001 - $50,000 13%
$50,001 - $70,000 15%
$70,001 - $100,000 19%
$100,001 - $150,000 16%
$150,001 or more 8%
Base: All respondents (1,001)
LONG-TERM HEALTH PROBLEMS
Health problem or a condition (lasting 6 months or more) causing difficulty
Percentage
with, or stopping respondents from…
seeing, even when wearing glasses or contact lenses 4%
hearing, even when using a hearing aid 3%
walking, lifting or bending 14%
using your hands to hold, grasp or use objects 4%
learning, concentrating or remembering 4%
communicating, mixing with others or socialising 4%
no difficulty with any of these 78%
Base: All respondents (1,001)
LONG-TERM DISABILITY
Disability (lasting 6 months or more) stopping participants from doing
Percentage
everyday things other people can do
Yes 11%
No 89%
Base: All respondents (1,001)
34Summary of 2017 and 2018 results
2017 2018
Use of technology and change in digital behaviour (n=1,001) (n=1,001)
Frequently or always require assistance 2% 5%
Change in digital behaviour in last 12 months to protect self/others online 70% 72%
Perceived effectiveness of actions taken to protect self/others online 73% 74%
Perceptions of most unacceptable types of online behaviour (forced to pick top 3) 2017 2018
Digital communication should not… (n=1,001) (n=1,001)
Try to get someone to hurt themselves (e.g. self-harm, commit suicide) 61% 62%
Share intimate images or recordings of someone without their permission 46% 47%
Include indecent or obscene content (e.g. extreme violence or sexually explicit) 43% 41%
Share other personal information about someone without their permission 32% 34%
Threaten to hurt someone or damage their property 32% 30%
Insult someone because of their personal characteristics
(what they look like, their lifestyle, where they come from or what they believe in) 20% 21%
Make a false allegation about someone 19% 20%
Encourage other people to send messages to someone as a way to try and harm them 18% 18%
Be used as a way to get back at someone by harassing them 17% 15%
Include content that most people would agree is offensive to the person receiving it 12% 14%
Significant increase/decrease since 2017
35Knowledge of rights and obligations under the Harmful Digital Communication Act 2017 2018
(% correctly answered) (n=1,001) (n=1,001)
You can be ordered to remove online content if the district court considers it is harmful to another
person 73% 76%
It’s illegal to send messages and post material online that deliberately causes a person harm 62% 64%
If you find a digital communication upsetting you can complain about it to an agency that is
specially appointed by the government to help 60% 60%
Deliberately causing harm by posting a digital communication is punishable by imprisonment or a
fine 58% 58%
When I communicate with others online there are a set of legal principles I am required to follow 48% 47%
It’s only illegal to aid, abet or incite suicide if a person actually attempts or commits suicide 45% 46%
2017 2018
Experience of unwanted digital communications (n=1,001) (n=1,001)
Experienced unwanted digital communications in last year 32% 35%
Experienced unwanted digital communication that had a negative impact on them 9% 10%
Use of support services8 18% 18%
8
Among those who experienced an unwanted digital communication (n= 337 and 362)
36Experience of unwanted digital communications – Demographic differences
Yes (nett) % More likely among the following groups (in 2018):
Received many unwanted communications from the same
person 16 Non-heterosexual (28%)
Included violent or sexual content you thought was indecent or 10 Asian respondents (18%)
obscene
Said offensive things about you, your lifestyle or your religious Non-heterosexual (26%), those aged under 30 (18%), those with long-
or political beliefs 10 term health issues (17%) and Māori (17%)
Made an unwanted sexual advance to you
(e.g. messages propositioning sex acts, naked selfie, images or Non-heterosexual (28%), those aged under 30 (21%), and Asian
9 respondents (20%)
video live stream)
Non-heterosexual (25%), those aged under 30 (18%), those with long-
Excluded you from a peer or friendship group 9
term health issues (8%)
Made a false allegation about your personal or professional life 8 Non-heterosexual (24%), those aged under 30 (12%), and Māori (15%)
Tried to embarrass or humiliate you online in front of your Non-heterosexual (19%), those aged under 30 (15%), those with long-
peers or friends 8 term health issues (13%)
Stalked you by monitoring your online activity to intimidate or
control you 6 Those aged under 30 (11%), those with long-term health issues (10%)
Was harmful in another way 6 Those with long-term health issues (11%), Māori (11%)
Non-heterosexual (13%), those aged under 30 (11%), those with long-
Physically threatened or intimidated you 5 term health issues (15%), and Māori (17%)
Shared intimate images or recordings of you without your Non-heterosexual (11%), those aged under 30 (8%), and Asian
permission 4 respondents (10%)
Came from people that had been encouraged by someone Those aged under 30 (7%), those with long-term health issues (8%),
else to try to harm you 4 and those with a long-term disability (10%)
Those aged under 30 (6%), those with long-term health issues (6%),
Tried to get you to hurt yourself (e.g. self-harm, commit suicide) 2 Māori (6%), and Asian respondents (7%)
37References
Henrickson, M. (2007). “You Have to Be Strong to Be Gay”: Bullying and Educational Attainment in LGB
New Zealanders. Journal of Gay & Lesbian Social Services, 19(3–4), 67–85.
https://doi.org/10.1080/10538720802161565
Lucassen, M. F. G., Clark, T. C., Moselen, E., Robinson, E. M., & The Adolescent Health Research Group.
(2014). The Health and Wellbeing of New Zealand Secondary School Students in 2012: Young
people attracted to the same sex or both sexes. The University of Auckland.
https://www.fmhs.auckland.ac.nz/assets/fmhs/faculty/ahrg/docs/Youth’12 Young People Attracted
to the Same or Both Sexes Report.pdf
Netsafe. (2018). Harmful digital communications in New Zealand: Annual Population Survey 2017. In
http://ssrn.com/abstract=3128121. Netsafe. https://doi.org/10.2139/ssrn.3128121
Netsafe. (2019). Image-Based Sexual Abuse: A Snapshot of New Zealand Adults’ Experiences.
https://doi.org/10.2139/ssrn.3315984
Newshub. (2018). Israel Folau explains why he said gay people are going to hell. Newshub.
https://www.newshub.co.nz/home/entertainment/2018/04/israel-folau-explains-why-he-said-gay-
people-are-going-to-hell.html
Pacheco, E., & Melhuish, N. (2018). Online Hate Speech: A Survey on Personal Experiences and
Exposure Among Adult New Zealanders. SSRN Electronic Journal.
https://doi.org/10.2139/ssrn.3272148
Radio New Zealand. (2018). Rugby Australia to talk to Folau over gay comments. RNZ.Co.Nz.
https://www.rnz.co.nz/news/sport/354250/rugby-australia-to-talk-to-folau-over-gay-comments
Statistics NZ. (2018a). Collecting sexual orientation information: New Zealand and international
practices. www.stats.govt.nz
Statistics NZ. (2018b). Sexual orientation: Consultation for developing a statistical standard for sexual
identity. www.stats.govt.nz
Stuff. (2019). Jacinda Ardern “totally disagrees” with Israel Folau anti-gay social media posts.
Stuff.Co.Nz. https://www.stuff.co.nz/sport/rugby/international/111950375/israel-folau-resumes-
antigay-social-media-posts-as-tasmania-passes-gender-freedom-law
38You can also read