The Relationship between Air Pollution and Depression in China: Is Neighbourhood Social Capital Protective? - MDPI
←
→
Page content transcription
If your browser does not render page correctly, please read the page content below
International Journal of
           Environmental Research
           and Public Health

Article
The Relationship between Air Pollution and
Depression in China: Is Neighbourhood Social
Capital Protective?
Ruoyu Wang 1,2 , Desheng Xue 1,2 , Ye Liu 1,2, *             ID
                                                                  , Penghua Liu 1,2 and Hongsheng Chen 3
 1    School of Geography and Planning, Sun Yat-Sen University, Xingang Xi Road, Guangzhou 510275, China;
      wangry6@mail2.sysu.edu.cn (R.W.); eesxds@mail.sysu.edu.cn (D.X.); liuph3@mail2.sysu.edu.cn (P.L.)
 2    Guangdong Key Laboratory for Urbanization and Geo-simulation, Sun Yat-Sen University, Xingang Xi Road,
      Guangzhou 510275, China
 3    School of Architecture, Southeast University, Si-Pai-Lou Road No. 2, Nanjing 210096, China;
      hongsheng.chen2006@163.com
 *    Correspondence: liuye25@mail.sysu.edu.cn

 Received: 30 April 2018; Accepted: 31 May 2018; Published: 2 June 2018

 Abstract: There is increasing evidence from the developed world that air pollution is significantly
 related to residents’ depressive symptoms; however, the existence of such a relationship in developing
 countries such as China is still unclear. Furthermore, although neighbourhood social capital
 is beneficial for health, whether it is a protective factor in the relationship between health and
 environment pollution remains unclear. Consequently, we examined the effects of cities’ PM2.5
 concentrations on residents’ depressive symptoms and the moderating effects of neighbourhood
 social capital, using data from the 2016 wave of China Labourforce Dynamics Survey and the
 real-time remote inquiry website of Airborne Fine Particulate Matter and Air Quality Index. Results
 showed that PM2.5 concentrations and neighbourhood social capital may increase and decrease
 respondents’ depressive symptoms, respectively. Notably, neighbourhood social capital decreased
 the negative effect of PM2.5 concentrations on respondents’ depressive symptoms. These analyses
 contributed to the understanding of the effect of air pollution on mental health in China and confirmed
 that neighbourhood social capital were protective factors in the relationship between health and
 environment hazards.

 Keywords: PM2.5 concentrations; depressive symptoms; neighbourhood social capital; moderate
 effect; China

1. Introduction
      Depressive symptoms are a fundamental problem globally and are considered one of the most
severe mental health problems [1]. As of 2010, depressive disorder was the 11th leading cause of
disability-adjusted life years globally [2]. Depression is not only associated with physical illnesses
like cardiovascular problems [3,4], decreased quality of life [5], and decreased work productivity [6,7],
but also increases the mortality and suicide rate [3,4]. Data from the China Health and Retirement
Longitudinal Study showed that the rate of depression among the elderly in China reached 31.2% in
2013 [8]. Therefore, depression has become a notable problem in China. Most previous research has
indicated that depressive symptoms are significantly related to socioeconomic status and health-related
behaviour [2–5]. For example, people with higher educational attainment and household income are
less likely to suffer from depression than those who are less affluent and educated [2–5]. Similarly,
people who drink alcohol or smoke frequently and engage in fewer physical activities are more likely
to suffer from depression than those who refrain from drinking, smoking and regularly exercise [2–5].

Int. J. Environ. Res. Public Health 2018, 15, 1160; doi:10.3390/ijerph15061160           www.mdpi.com/journal/ijerph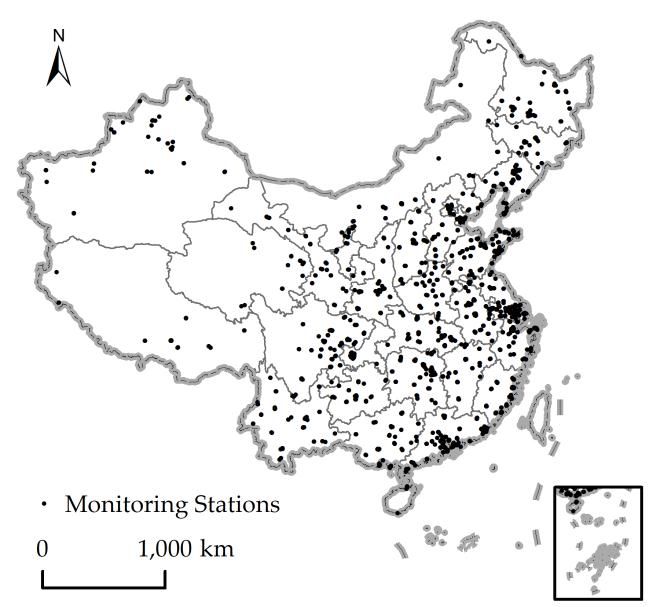
Int. J. Environ. Res. Public Health 2018, 15, 1160                                                   2 of 13

      Recent studies in developed countries have reported that higher air pollution may decrease
residents’ mental health, especially increasing the risk of experiencing depression [9–16]. Although the
biological mechanisms for this association are not completely understood [12], possible pathological
pathways are that: (1) air pollution may increase the risk of cardiovascular illness and thus increases
the risk of depression [11,12,17]; and (2) air pollution influences mental health by affecting the nervous
and digestive system [12,18]. In addition, another possible biological pathway is that air pollution may
reduce the volume of sunlight which may be a stressor for residents’ nervous system and contributes
to the development of depression [19–21]. Besides biological effects, air pollution may also affect
depression through other health-related behaviours. One possible pathway is that air pollution may
pose a barrier to involvement with outdoor physical exercises, which is an effective way to cope
with the risk of mental health problems [16,22–24]. Another explanation is associated with access to
face-to-face social contact. Some studies have shown that air pollution discouraged face-to-face social
contact among neighbours and therefore increased the risk for depression [25–27]. Although a growing
body of literature has investigated the health effect of Particulate Matter 2.5 (PM2.5 ) in Chinese cities,
this body of research is largely related to the effects on physical health rather than those on mental
health [9,10].
      Social capital has been defined as a type of resource that provides people with convenience,
and it has become essential for the maintenance of population health over the last two decades [28].
Thus, many studies have reported that social capital including social trust, social reciprocity, and
social group membership can improve residents’ health, as people living in neighbourhood with
higher neighbourhood social capital could more easily acquire emotional or material support from
others [1,28]. In recent years, social capital research has posited that neighbourhood social capital
may also be protective for mental health, as it weakens the negative influences of neighbourhood
social hazards [29–37]. For example, Feng et al. have noted that neighbourhood social trust can
improve residents’ mental health, since people in communities with high neighbourhood social trust
can get more health information [31]. Lindström et al. have pointed out that neighbourhood social
group membership and participation may benefit residents’ mental health, as residents are more
likely to get support from other neighbourhood group members [32]. Abbott et al. have found
that neighbourhood social reciprocity may increase people’s health by strengthening social ties and
regulating residents’ health related behaviours [33]. Further, neighbourhood social capital may be a
buffer between social environmental hazards and residents’ mental health [29,34–37]. For example,
Niedzwiedz et al. have indicated that neighbourhood group membership may act as a buffer between
the inequity of household income and older people’s mental health [29]. Murayama et al. have also
reported that the presence of both neighbourhood social trust and social reciprocity can weaken the
negative effects of neighbourhood social environment on residents’ depressive mood [37]. However,
other researchers have recently argued that social capital may not only act as a protective factor for
social environmental hazards but also for physical environmental hazards [38]. For instance, social
capital may moderate the effect of industrial pollution exposure on residents’ self-reported health
because air pollution may contribute to feelings of stress in residents, and social capital can be a buffer
its effects [38].
      Although earnest efforts have been adopted to investigate the relationship between air pollution
and depressive symptoms in developed countries, the relationship is still unclear in developing
countries, such as China. Furthermore, although there is a consensus that neighbourhood social capital
is beneficial for mental health, its protective benefits in the relationship between depressive symptoms
and air pollution is still unclear. To bridge these gaps, this study investigated the relationship between
PM2.5 concentrations and depressive symptoms in China using data from the 2016 wave of the China
Labourforce Dynamics Survey (CLDS 2016). We further examine whether neighbourhood social capital
has a protective influence on the relationship between depressive symptoms and PM2.5 concentrations.
This study contributes to the body of literature in two respects: first, it improves our understanding of
how air pollution negatively influences people’s mental health in China; and, second, it provides a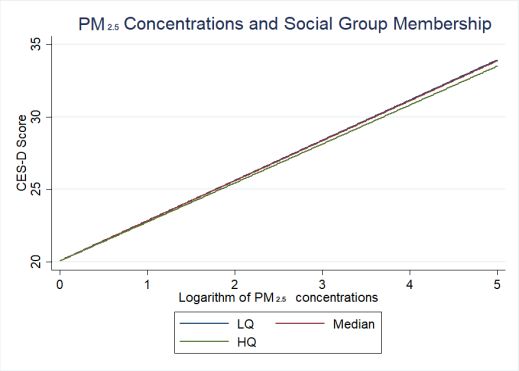
Int. J. Environ. Res. Public Health 2018, 15, 1160 3 of 13
Int. J. Environ. Res. Public Health 2018, 15, x 3 of 13
in China; and, second, it provides a deeper understanding of the protective function of
deeper understanding of the protective function of neighbourhood social capital for mental health.
neighbourhood social capital for mental health. The conceptual model is presented in Figure 1.
The conceptual model is presented in Figure 1.
Figure 1. Conceptual
Figure 1. model of
Conceptual model of the
the moderating
moderating relationship
relationship of
of neighbourhood
neighbourhood social
social capital
capital on
on the
the
relationship between air pollution and depressive symptoms.
relationship between air pollution and depressive symptoms.
Based on
onthe
theconceptual
conceptual model
model andand the review
the review of existing
of existing literature,
literature, we the
we propose propose the
following
following hypotheses:
hypotheses:
Hypothesis 1. Residents who live in cities with higher levels of air pollution are more likely to have
Hypothesis 1. Residents who live in cities with higher levels of air pollution are more likely to have higher
higher levels of depressive symptoms compared to residents in other cities.
levels of depressive symptoms compared to residents in other cities.
Hypothesis 2. Residents who live in neighbourhood with higher neighbourhood social capital are
Hypothesis Residents
likely to2.have who live
lower levels in neighbourhood
of depressive withthan
symptoms higher neighbourhood
residents who livesocial capital are likely
in neighbourhood to have
with
lowerlower
levelssocial
of depressive
capital. symptoms than residents who live in neighbourhood with lower social capital.
Hypothesis
Hypothesis 3. Neighbourhood
3. Neighbourhood social
social capitalweakens
capital weakens the
the negative
negativeeffect
effectof of
air air
pollution on residents’
pollution on residents’
depressive symptoms.
depressive symptoms.
2. Data and Methods
2. Data and Methods
2.1. Data
2.1. Data
The CLDS 2016 conducted by the Centre for Social Science Survey of Sun Yat-sen University [39]
The CLDS 2016
was the primary conducted
source by the
of the data. Centre for from
Respondents Socialthis
Science
survey Survey
wereof Sun Yat-sen
chosen by using University
a probability[39]
was the primary
proportional source
to size of the data.
sampling Respondents
technique. First, 158 from this survey were
prefecture-level chosen
divisions by using
from a probability
29 provinces were
proportional to size sampling
randomly selected. Second, 401 technique. First, 158 were
neighbourhoods prefecture-level
randomly chosendivisions from
from 29prefecture-level
the provinces were
randomly
divisions. Inselected. Second, 401 neighbourhoods
China, neighbourhoods were randomlydivisions
refer to basic administrative chosen from nestedthe prefecture-level
within prefectures
divisions. In China,division
(prefecture-level neighbourhoods
means the refersecond-level
to basic administrative
administrativedivisions nested within
divisions). Overall,prefectures
20,861
(prefecture-level division means the second-level administrative divisions).
individuals nested within 401 neighbourhoods nested within 158 prefectures were included in the Overall, 20,861 individuals
nested within 401 neighbourhoods nested within 158 prefectures were included in the final dataset.
final dataset.
Average
Average annual
annual PMPM2.5 concentrations of
2.5 concentrations of each
each prefecture
prefecture were
were acquired
acquired from from aa real-time
real-time remote
remote
inquiry
inquiry website—Airborne Fine Particulate Matter and Air Quality Index [40]—which provides aa
website—Airborne Fine Particulate Matter and Air Quality Index [40]—which provides
quantitative
quantitative hourly
hourlyindex
indexof ofair
airpollutants
pollutantssuch
suchasasAQI,
AQI,CO,CO,NO NO2 , 2SO 2 ,2,OO
, SO 3 ,3,PM
PM1010,, and
andPM PM2.52.5.. By
By calling
calling
the
the API
API of
of the
the website,
website, the
the AQI
AQI observation
observation datadata from
from January
January to to December
December 2015 2015 in in 1613
1613 monitoring
monitoring
stations were collected and cleaned. However, However, there there was
was aa lot
lot of missing
missing data and noise in the
observation
observation data.
data. Therefore,
Therefore, aa Kalman
Kalman filter
filter was
was used
used for
for the
the optimal
optimal estimate
estimate of ofPM 2.5 observation
PM2.5 observation
values [41].
[41]. A A Kalman filter is a time-domain filtering algorithm,
is a time-domain filtering algorithm,which can which can obtain the optimal
estimation
estimation of the next moment based on the state of the system and the observation value at theatnext
of the next moment based on the state of the system and the observation value the
next
momentmoment
[42]. [42]. Another
Another problem
problem waswas
thatthatthethe recorded
recorded datahad
data hadneither
neitherlongitude
longitude nor nor latitude
information, which may make it difficult to represent spatial variation.
to represent spatial variation. To map To map the data into a
geographical space, geocoding was used used to associate
associate the observation
observation data data withwith spatial
spatial coordinates.
coordinates.
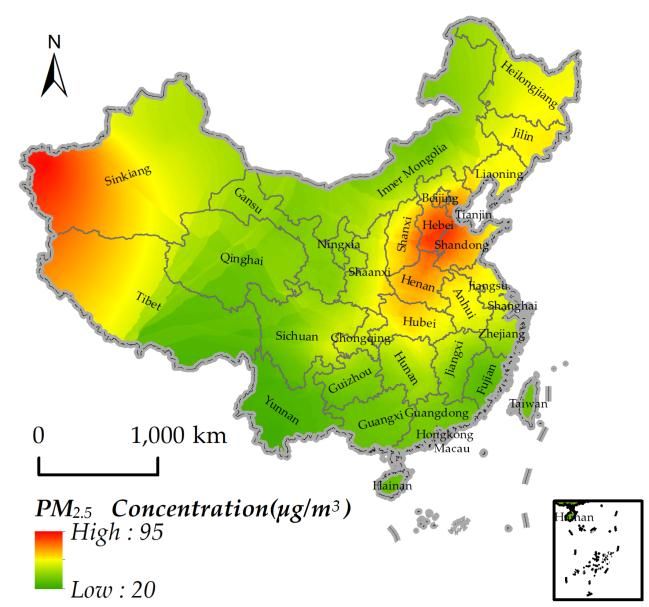
Figure 2a shows the locations of 1613 monitoring stations in China in 373 cities. Further, the ordinary
kriging
kriging interpolation
interpolationmethod
methodwas wasused
usedtotogenerate
generatea continuous
a continuous raster surface
raster surface(pixel sizesize
(pixel = 500= m),500 and
m),
and zonal statistics was applied to extract the mean concentrations of PM2.5 in each prefecture. Figure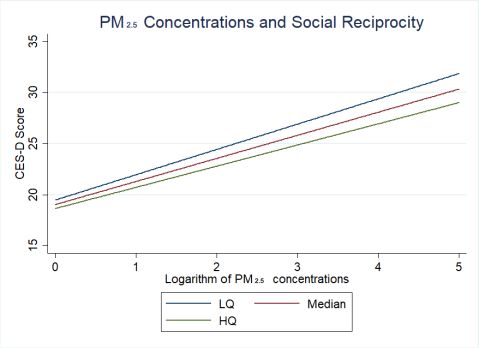
Int. J. Environ. Res. Public Health 2018, 15, 1160 4 of 13
Int. J. Environ. Res. Public Health 2018, 15, x 4 of 13
zonal statistics was applied to extract the mean concentrations of PM2.5 in each prefecture. Figure 2b
2b shows
shows thethe spatial
spatial interpolation
interpolation ofof theaverage
the averagePM
PM 2.5 concentration in 2015, which was obtained by
2.5 concentration in 2015, which was obtained by
applying
applying the Kriging method to the ground-based observations average
the Kriging method to the ground-based observations average in
in 2015.
2015.
(a) (b)
Figure 2.
Figure (a)Locations
2. (a) Locationsof
ofmonitoring
monitoringstations;
stations;(b)
(b) PM2.5
PM2.5 measurement
measurement in
in January
January 2015.
2015.
2.2. Variables
2.2. Variables
The Center
The Center forforEpidemiologic
Epidemiologic Studies
Studies Depression
Depression scale scale (CES-D)
(CES-D) was was used
used to tocalculate
calculatedepressive
depressive
symptoms, which has been widely used in previous studies [1]. The
symptoms, which has been widely used in previous studies [1]. The CES-D has a Cronbach’s alpha CES-D has a Cronbach’s alpha
value of
value of 0.95.
0.95. Independent
Independent variables
variables included
included PM PM2.5 concentrationsand
2.5 concentrations andsocial
social capital
capital indicators.
indicators.
Following existing
Following existing studies
studies ,the
,the average
average annual
annual PM PM2.5 concentrationsof
2.5concentrations ofeach
eachprefecture
prefecture were
were used
used to
to
measure the severity of air pollution in cities in
measure the severity of air pollution in cities in 2015 [11,12]. 2015 [11,12].
Based on
Based on the
the indicators
indicators usedused inin previous
previous studies
studies,,three
three main
main social
social capital
capital indicators
indicators (i.e
(i.e social
social
trust, social reciprocity, and social group membership) were included
trust, social reciprocity, and social group membership) were included [28]. These three social capital [28]. These three social
capital indicators
indicators were measured
were measured based based on variables
on variables included
included in the
in the questionnaire(Part
questionnaire (Partsix:
six: Social
Social
participation and
participation and support)
support)that thatwas wascollected
collected in CLDS
in CLDS 2016. The The
2016. question ‘Would
question you say
‘Would most
you saypeople
most
can be trusted?’ was used to measure respondents’ perceptions of social
people can be trusted?’ was used to measure respondents’ perceptions of social trust. The response trust. The response ‘Neighbours
are extremely/very
‘Neighbours trustworthy’trustworthy’
are extremely/very was definedwas as high
definedsocialas trust. The question
high social trust. The ‘Would you‘Would
question say most of
you
the most
say time people try to
of the time be helpful?’
people try to be was used towas
helpful?’ assess
used respondents’ perceptionsperceptions
to assess respondents’ of social reciprocity.
of social
The responseThe
reciprocity. responsealways/often
‘Neighbours ‘Neighbourshelp each other’help
always/often was each
defined as high
other’ was social
defined reciprocity.
as high Lastly,
social
respondentsLastly,
reciprocity. were asked about membership
respondents were asked about in a various
membershipkind ofinvoluntary
a variousgroups. Following groups.
kind of voluntary existing
studies, theexisting
Following percentage of respondents
studies,the percentagebeing of high trust andbeing
respondents high reciprocity
high trust and within
higheach neighbourhood
reciprocity within
were calculated and defined as aggregated neighbourhood social
each neighbourhood were calculated and defined as aggregated neighbourhood social trust andtrust and aggregated neighbourhood
social reciprocity
aggregated [22]. Furthermore,
neighbourhood the average
social reciprocity [22].number of typesthe
Furthermore, of voluntary
average numbergroups within
of types each
of
neighbourhood was calculated and defined as aggregated
voluntary groups within each neighbourhood was calculated and defined as aggregatedneighbourhood social group membership.
Lastly, we controlled
neighbourhood social group for membership.
a series of individual-level and neighbourhood-level variables including:
gender (dichotomous
Lastly, we controlled variable),
for aage (continuous
series variable), marital
of individual-level status (categorical variables),
and neighbourhood-level variables
educational attainment (categorical variables), employment status (dichotomous
including: gender (dichotomous variable), age (continuous variable), marital status (categorical variables), variable), hukou
status (dichotomous
educational attainment variable),
(categoricallivingvariables),
area (dichotomous
employment variable),
status smoking
(dichotomous history (dichotomous
variable), hukou
variable), drinking history (dichotomous variable), medical insurance
status (dichotomous variable), living area (dichotomous variable), smoking history (dichotomous status (dichotomous variable),
physical status
variable), drinking(dichotomous variable), weekly
history (dichotomous variable),physical
medical exercise
insurancetimestatus
(continuous variable),
(dichotomous annual
variable),
household
physical incomes
status per capitavariable),
(dichotomous (continuous variable),
weekly physical andexercise
annual timeneighbourhood
(continuousincomesvariable),perannual
capita
(continuous variable). Table 1 shows the summary statistics of variables
household incomes per capita (continuous variable), and annual neighbourhood incomes per capita in the regression models.
(continuous variable). Table 1 shows the summary statistics of variables in the regression models.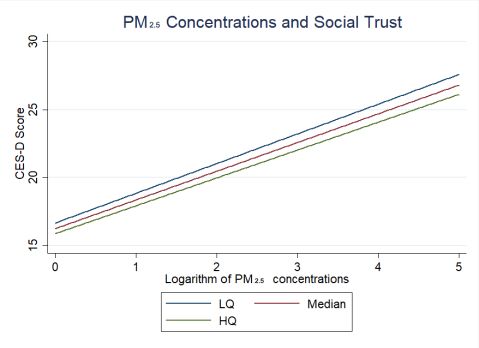
Int. J. Environ. Res. Public Health 2018, 15, 1160                                                                5 of 13

                        Table 1. Summary statistics of variables included in regression analyses.

      Variables                                                                          Proportion/Mean (SD)
      Dependent variables
        CES-D Score (0–60)                                                                      7.3 (9.24)
      Independent variables
        Neighbourhood social capital
        Neighbourhood social trust                                                             0.78 (0.12)
        Neighbourhood social reciprocity                                                       0.48 (0.23)
        Neighbourhood social group membership                                                  0.08 (0.15)
        PM2.5 concentrations (µg/m3 )                                                         49.27 (19.74)
      Control variables
      Gender
        Male                                                                                        0.48
        Female                                                                                      0.52
      Age                                                                                     44.83 (14.61)
      Marital status
        Single, divorced, and widowed                                                               0.19
        Married and living with spouse                                                              0.73
        Married but living apart from spouse                                                        0.08
      Education
        Primary school or below                                                                     0.35
        High school                                                                                 0.52
        College and above                                                                           0.13
      Employment
        Employed                                                                                    0.95
        Unemployed                                                                                  0.05
      Hukou status
        Local hukou                                                                                 0.91
        Non-local hukou                                                                             0.09
      Living area
        Living in urban neighbourhood                                                               0.39
        Living in rural neighbourhood                                                               0.61
      Smoking
        Current smoker                                                                              0.27
        Non-smoker                                                                                  0.73
      Drinking
        Drinker                                                                                     0.19
        Non-drinker                                                                                 0.81
      Medical insurance
        Having medical insurance                                                                    0.90
        No medical insurance                                                                        0.10
      Physical health status
        Have a disease                                                                              0.11
        No disease                                                                                  0.89
      Weekly physical exercise time (minutes)                                                 97.51 (267.95)
      Average annual household incomes per household member (Chinese yuan)                 17991.68 (202477.08)
      Average annual neighbourhood incomes per neighbourhood resident (Chinese yuan)         17814.06 (3.22)
      Individual-level social capital
      Trust in neighbours
        Neighbours are extremely/very trustworthy                                                   0.78
        Neighbours are somewhat/slightly/not at all trustworthy                                     0.22
        Neighbours are helpful
        Neighbours always/often help each other                                                     0.48
        Neighbours sometimes/seldom/never help each other                                           0.52
      Number of types of voluntary groups                                                       0.08 (0.37)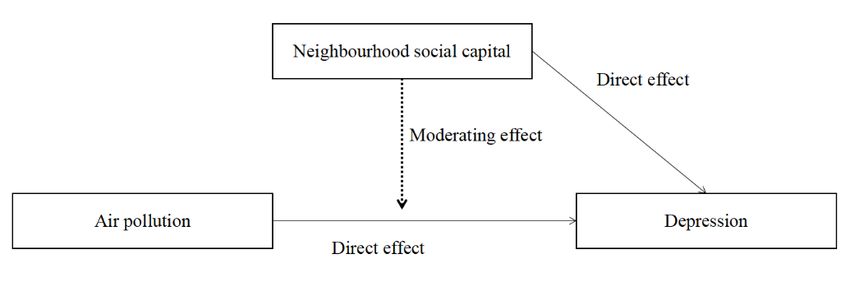
Int. J. Environ. Res. Public Health 2018, 15, 1160                                                           6 of 13

2.3. Statistical Analyses
     We examined the effects of cities’ PM2.5 concentrations on respondents’ depressive symptoms
in China while we also tested whether neighbourhood social capital moderated the effect of PM2.5
concentrations on respondents’ depressive symptom, using three-level linear regression analyses.
Due to the hierarchical structure of this data set, multilevel models were suitable for this research.
     We applied hierarchical liner regression analyses to estimate the effect of PM2.5 concentrations on
depressive symptoms and the moderating effect of neighbourhood social capital. Models presented
here are as follows: a baseline model estimating the effect of controlled variables on depressive
symptoms (Model 1), a model estimating the effect of neighbourhood social capital on depressive
symptoms (Model 2), a model estimating the effect of PM2.5 concentrations on depressive symptoms
(Model 3), and a model adding cross-level interaction variables into Model 3 while following the
multilevel analysis research (Model 4) [43]. All continuous variables were centred on the grand mean in
interaction part. The statistical models were of the following form and the mean value of the variance
inflation factor (VIF) was less than 3:
     CES − Dihj = β 0         + β 1 Neighbourhood social capital indicatorshj + β 2 PM2.5 concentrations j
                              + β 3 Neighbourhood social capital indicatorshj · PM2.5 concentrations j          (1)
                              + β 4 Covariatesh + β 5 Covariatesihj + ε ihj + µhj + ϕ j
where i represents individuals, h represents neighbourhoods, and j represents prefectures. β0 is
the intercept. Neighbourhood social capital indicatorshj represents a vector of neighbourhood-level
variables of social capital. PM2.5 concentrations j represents a vector of prefecture-level variables of
PM2.5 concentration. Social capital indicatorshj · PM2.5 concentrationsj represents a vector of cross-level
interaction effect. Covariateshj represent a vector of neighbourhood-level covariates. Covariatesihj
represent a vector of individual-level covariates. ε ihj , µhj , ϕ j represent random errors at the individual
level, neighbourhood level, and city level, respectively. The interaction effect of interest is expressed in
coefficients β3 .

3. Results
     Table 2 shows the results of the multilevel linear models on respondents’ depressive symptoms.
Model 1 included individual-level and neighbourhood-level control variables. Compared with women,
men had a lower CES-D score (coefficient = −1.243, standard error = 0.153). In addition, respondents’
CES-D scores increased with age (coefficient = 0.040, standard error = 0.005). Married respondents had
a lower CES-D score (married and living with a spouse, coefficient = −1.052, standard error = 0.179;
married and living apart with a spouse, coefficient = −0.718, standard error = 0.264). Respondents with
higher educational attainment had a lower CES-D score, compared with respondents who graduated
from primary school or below, (high school, coefficient = −1.065, standard error = 0.153; college and
above, coefficient = −1.064, standard error = 0.251). Compared with unemployed respondents, employed
respondents have lower CES-D scores (coefficient = −0.558, standard error = 0.265). What’s more,
respondents with medical insurance had lower CES-D scores (coefficient = −0.850, standard error =
0.203) than those without medical insurance. Respondents with physical diseases have higher CES-D
scores (coefficient = 5.897, standard error = 0.196) than those without physical diseases. Furthermore,
respondents’ CES-D scores decreased with physical exercise time (coefficient = −0.119, standard error
= 0.026). Interestingly, respondents’ CES-D scores decreased with the logarithm of household incomes
and neighbourhood incomes (logarithm of household incomes, coefficient = −0.579, standard error =
0.064; logarithm of neighbourhood incomes, coefficient = −1.150, standard error = 0.311). Lastly, CES-D
scores decreased with all three individual-level social capital indicators (neighbours are extremely/very
trustworthy, coefficient = −1.736, standard error = 0.148; neighbours always/often help each other,
coefficient = −1.133, standard error = 0.131; number of types of voluntary groups, coefficient = −0.261,
standard error = 0.131). Model 2 included control variables and neighbourhood social capital indicators.
Int. J. Environ. Res. Public Health 2018, 15, 1160 7 of 13
Table 2. Multilevel liner regression coefficients for the effects of PM2.5 concentrations, social capital, and individual characteristics on depressive symptoms.
Effects and Variables Model 1 (Baseline) Model 2 Model 3 Model 4
Fixed part
Logarithm of PM2.5 concentrations 2.167 ** (1.090) 2.670 ** (1.390)
Neighbourhood-level social capital
Neighbourhood social trust −4.152 *** (1.443) −4.247 *** (1.443) −4.271 *** (1.498)
Neighbourhood social reciprocity −1.959 *** (0.841) −1.878 *** (0.854) −2.083 *** (0.849)
Neighbourhood social group membership −0.968 ** (0.489) −0.962 ** (0.481) −0.146 ** (0.073)
Male (ref: female) −1.243 *** (0.153) −1.240 *** (0.153) −1.240 *** (0.153) −1.240 *** (0.153)
Age 0.040 *** (0.005) 0.040 *** (0.005) 0.040 *** (0.005) 0.040 *** (0.005)
Marital status and family organization(ref: single, divorced, and widowed)
Married and living with spouse −1.053 *** (0.179) −1.050 *** (0.179) −1.050 *** (0.179) −1.050 *** (0.179)
Married but living apart from spouse −0.718 *** (0.264) −0.719 *** (0.264) −0.718 *** (0.264) −0.719 *** (0.264)
Education (ref: primary school or below)
High school −1.065 *** (0.153) −1.075 *** (0.153) −1.077 *** (0.153) −1.074 *** (0.153)
College and above −1.064 *** (0.251) −1.078 *** (0.252) −1.081 *** (0.252) −1.082 *** (0.252)
Employed (ref: unemployed) −0.558 ** (0.265) −0.552** (0.265) −0.553 ** (0.265) −0.553 ** (0.265)
Local hukou (ref: non-local hukou) −0.324 (0.246) −0.273 (0.247) −0.273 (0.247) −0.279 (0.247)
Living in urban neighbourhood(ref: living in rural neighbourhood) 0.108 (0.345) −0.240 (0.424) −0.243 (0.424) −0.223 (0.427)
Current smoking status (ref: non-smoker) 0.100 (0.173) 0.091 (0.173) 0.092 (0.173) 0.088 (0.173)
Current drinking status (ref: non-drinker) −0.057 (0.171) −0.056 (0.171) −0.056 (0.171) −0.055 (0.171)
Medical insurance (ref: no medical insurance) −0.850 *** (0.203) −0.848 *** (0.203) −0.848 *** (0.203) −0.846 *** (0.203)
Have a disease (ref: no disease) 5.897 *** (0.196) 5.886 *** (0.196) 5.887 *** (0.196) 5.889 *** (0.196)
Logarithm of physical exercise time −0.119 *** (0.026) −0.120 *** (0.026) −0.120 *** (0.026) −0.120 *** (0.026)
Logarithm of household incomes per capita −0.579 *** (0.064) −0.588 *** (0.064) −0.588 *** (0.064) −0.587 *** (0.064)
Logarithm of neighbourhood incomes per capita −1.150 *** (0.311) −1.279 *** (0.315) −1.287 *** (0.316) −1.206 *** (0.316)
Individual-level social capital
Neighbours are extremely/very trustworthy (ref: neighbours are somewhat/slightly/not at all trustworthy) −1.736 *** (0.148) −1.698 *** (0.149) −1.698 *** (0.149) −1.698 *** (0.149)
Neighbours always/often help each other (ref: neighbours sometimes/seldom/never help each other) −1.133 *** (0.131) −1.094 *** (0.133) −1.094 *** (0.133) −1.095 *** (0.133)
Number of types of voluntary groups −0.261 ** (0.131) −0.250 ** (0.125) −0.250 ** (0.125) −0.250 ** (0.125)
Cross-level interaction
Neighbourhood social trust × logarithm of PM2.5 concentrations −0.846 ** (0.401)
Neighbourhood social reciprocity × logarithm of PM2.5 concentrations −1.019 *** (0.102)
Neighbourhood social group membership × logarithm of PM2.5 concentrations −0.924 ** (0.437)
Constant 16.929 *** (0.756) 20.021 *** (1.335) 19.482 *** (2.018) 19.111 *** (1.998)
Random part
Var (city-level constant) 2.020 *** 2.210 *** 2.190 *** 1.990 ***
Var (neighbourhood-level constant) 5.192 *** 4.922 *** 4.916 *** 4.917 ***
Var (Residual) 70.301 *** 71.299 *** 70.300 *** 70.300 ***
Number of cities 158 158 158 158
Number of neighbourhoods 401 401 401 401
Number of individuals 20,861 20,861 20861 20,861
AIC 148,666.800 148,664.500 148,662.300 148,660.500
** p < 0.05, *** p < 0.01. All continuous independent variables and covariates were grand-mean centred.Int. J. Environ. Res. Public Health 2018, 15, 1160 8 of 13
Int. J. Environ. Res. Public Health 2018, 15, x 8 of 13
Surprisingly,
Surprisingly, respondents’
respondents’ CES-DCES-Dscores decreased
scores with all
decreased withof neighbourhood
all of neighbourhoodsocial capital
social indicators
capital
(neighbourhood social trust, coefficient = − 4.152, standard error = 1.443; neighbourhood
indicators (neighbourhood social trust, coefficient = −4.152, standard error = 1.443; neighbourhood social reciprocity,
coefficient = −1.959, standard
social reciprocity, coefficienterror = 0.841;standard
= −1.959, neighbourhood
error = social
0.841;group membership,
neighbourhood coefficient
social group =
−0.968, standard
membership, error = 0.489).
coefficient = −0.968,Model
standard 3 included control
error = 0.489). variables,
Model social
3 included capital
control indicators,
variables, and
social
PMcapital
2.5 concentrations.
indicators, The
and results
PM 2.5 showed
concentrations. that respondents’
The results CES-D
showed scores
that increased
respondents’ with logarithm
CES-D scores of
PMincreased with logarithm
2.5 concentrations of PM
(coefficient = 2.5 concentrations
2.167, standard error(coefficient
= 1.090)=which
2.167, means
standard PMerror = 1.090) which
2.5 concentrations had
means PM
significant 2.5 concentrations
negative had significant
effect on respondents’ mental negative
health. effect
Lastly,on respondents’
cross-level mentaleffects
interaction health.
wereLastly,
added
cross-level
in Model 4. The interaction
effect of PMeffects were added in Model 4. The effect of PM 2.5 concentrations on
2.5 concentrations on respondents’ CES-D scores varied by neighbourhood
social capital indicators which meansbythat
respondents’ CES-D scores varied neighbourhood
neighbourhood social capital
social indicators
capital whichmoderated
significantly means thatthe
neighbourhood social capital significantly moderated the
relationship between city’s PM2.5 concentrations and respondents’ depressive symptoms.relationship between city’s PM 2.5
concentrations and respondents’
Figure 3 graphically displays depressive
the predicted symptoms.
PM2.5 concentrations-depressive symptoms differing
Figure 3 graphically displays the predicted PM2.5 concentrations-depressive symptoms differing
by neighbourhood social capital indicators in Model 4, where different neighbourhood social capital
by neighbourhood social capital indicators in Model 4, where different neighbourhood social capital
indicators are represented by the Lower Quartile (LQ = 25%), the median (MQ = 50%) and higher
indicators are represented by the Lower Quartile (LQ = 25%), the median (MQ = 50%) and higher
quartile (HQ = 75%). The result of Model 4 and Figure 3a shows that respondents living in cities with
quartile (HQ = 75%). The result of Model 4 and Figure 3a shows that respondents living in cities with
higher concentrations of PM2.5 with higher neighbourhood social trust had lower CES-D scores than
higher concentrations of PM2.5 with higher neighbourhood social trust had lower CES-D scores than
respondents living in cities with higher concentrations of PM2.5 with lower neighbourhood social trust.
respondents living in cities with higher concentrations of PM2.5 with lower neighbourhood social
With theWith
trust. rise of
theneighbourhood social trust,
rise of neighbourhood socialits moderating
trust, effect was
its moderating effectstrengthened.
was strengthened. Figure 3b shows
Figure 3b
that respondents living in cities with higher concentrations
shows that respondents living in cities with higher concentrations of PM 2.5 with higher neighbourhood
of PM 2.5 with higher social
reciprocity had lower
neighbourhood CES-D
social scoreshad
reciprocity thanlower
did respondents
CES-D scoresliving
than in
didcities with higher
respondents concentrations
living in cities with of
PMhigher
2.5 withconcentrations of PM2.5 with lower neighbourhood social reciprocity. With thereciprocity,
lower neighbourhood social reciprocity. With the rise of neighbourhood social rise of
its neighbourhood
moderating effect was
social strengthened.
reciprocity, its moderating effect was strengthened.
(a) (b)
(c)
Figure
3. 3.
(a)(a) Predictedrelationship
Predicted relationshipbetween
betweenPM
PM2.5 concentrations and CES-D scores differing by social
Figure 2.5 concentrations and CES-D scores differing by social
trust; (b) Predicted relationship between PM 2.5 concentrations and CES-D scores differing by social
trust; (b) Predicted relationship between PM2.5 concentrations and CES-D scores differing by social
reciprocity; (c) Predicted relationship between PM2.5 concentrations and CES-D scores differing by
reciprocity; (c) Predicted relationship between PM2.5 concentrations and CES-D scores differing by
social group membership.Lower Quartile (LQ = 25%), the median (MQ = 50%) and higher quartile
social group membership.Lower Quartile (LQ = 25%), the median (MQ = 50%) and higher quartile
(HQ = 75%).
(HQ = 75%).Int. J. Environ. Res. Public Health 2018, 15, 1160 9 of 13
Figure 3c shows that respondents living in cities with higher concentrations of PM2.5 with higher
neighbourhood social group membership had lower CES-D scores than respondents living in cities
with higher concentrations of PM2.5 with lower neighbourhood social group membership. With the
rise of neighbourhood social group membership, its moderating effect was strengthened; however,
the moderating effect of the difference of median (MQ = 50%) and higher quartile (HQ = 75%) of
neighbourhood social group membership is not obvious.
4. Discussion
In the present study, we investigated the relationship between PM2.5 concentrations and
depressive symptoms in China. First, as has been demonstrated in previous studies respondents’
depressive symptoms increased with cities’ PM2.5 concentrations [11,13,14,16]. Such a finding may be
due to the following reasons: (1) air pollution may increase the risk of cardiovascular diseases, and
cardiovascular diseases are closely related to depressive symptoms [17,44]; therefore, residents living
in cities with more air pollution are more likely experience both cardiovascular diseases and depressive
symptoms, thus continuing a vicious circle. (2) Air pollution may also decrease the frequency of
residents’ outdoor physical activities, and outdoor physical activities are associated with depressive
symptoms [38,39,45,46].
In addition, previous studies we found that neighbourhood social capital was beneficial to
residents’ health [1,28,30,47]. Social capital can increase access to local services and amenities [28]
and provide useful support for residents [28]. Rapid urbanization in China has eroded residents’
connection with friends and relatives [48]. Therefore, neighbourhood social capital has become
essential to residents’ health in China. For this reason, neighbourhood social capital benefits residents’
mental health in China.
Most importantly, the statistical significance of the interaction effect indicates that neighbourhood
social capital can weaken the negative impact of PM2.5 concentrations on depressive symptoms.
In other words, neighbourhood social capital exerts a protective effect on the relationship between
depressive symptoms and PM2.5 concentrations. There are several explanations for the protective
effect. First, as for neighbourhood social trust, previous studies have noted that health knowledge
spreads faster in high-social-trust neighbourhoods (vs. low) since people are more likely to share
health knowledge with others and accept others’ advice [28,30,49,50]. Therefore, residents experiencing
depressive symptoms caused by PM2.5 may acquire useful health knowledge about cardiovascular,
nervous, and digestive system disease prevention more easily and can learn how to cope with stressor
from lack of sunlight in a high-social-trust neighbourhood. Second, social interactions are more
frequent in high-social-trust neighbourhoods, since their residents are more likely to be in contact with
those whom they trust [28,30,49,50]. Thus, although PM2.5 concentrations may lead to a decrease in
face-to-face social contact among neighbours’ , residents living in high-social-trust neighbourhoods
maintain connections with their neighbours through indoor activities (for example, playing card games
or Mah-jong). As a result, the negative effect of PM2.5 may be weakened by neighbourhood social trust.
In addition, as for neighbourhood social reciprocity, residents can not only obtain emotional
support but also can receive material support from neighbours in a high-social-reciprocity
neighbourhood [28,30,51–53]. Therefore, residents experiencing depressive symptoms caused by
PM2.5 may garner emotional comfort by talking to their neighbours about their mood or also acquire
useful health knowledge of cardiovascular, nervous and digestive system disease prevention and
know how to cope with stressor from lack of sunlight. All this will make residents feel less depressed
even while still experiencing PM2.5 .
Furthermore, as for neighbourhood social group membership, living in a high-social-group-
membership neighbourhood, residents are more willing to participate in group activities [28,29].
Although PM2.5 may decrease residents’ willingness to have physical activities outdoor, living in
high-social-group-membership neighbourhood may increase their willingness to have both outdoor
and indoor physical activities. Social interactions among group members are more frequent than thatInt. J. Environ. Res. Public Health 2018, 15, 1160 10 of 13
among non-group members [28,29]. Even with fewer daily interactions, group members can maintain
their interactions by attending routine group activities. In a word, the negative effect of PM2.5 is
weakened by neighbourhood social group membership.
Lastly, this study also revealed that the protective effect of neighbourhood group membership is
relatively weaker than the other two neighbourhood social capital effects, and this may be because
this research used the average number of types of voluntary groups within each neighbourhood to
measure neighbourhood group membership. However, we failed to measure the strength of the social
ties within each group, which means one may be a part of several social groups but fail to garner
strong ties in each respective group [28].
From a policy perspective, to decrease depressive symptoms, the government should pay attention
to the following three aspects. First, more trees and grass should be planted in cities to increase green
space. Green space can benefit residents’ health and reduce air pollution [54,55]. In addition, more
public medical insurance and subsidies should be provided to low-income residents to weaken the
negative effect of environmental hazards on poor residents’ health. Finally, neighbourhood social
capital should be promoted. Existing studies have found that neighbourhood social capital can be
improved by promoting residents’ educational attainment; therefore, more funding should be provided
to improve national education [56–58].
Despite this study’s advantages, some limitations should be noted. First, due to the cross-sectional
nature of the data, we were unable to capture time-fixed effects and only calculated average PM2.5
concentrations in 2015. Second, we used only PM2.5 concentrations as an indicator of air pollution;
previous studies have used other air pollution indicators related to ozone, nitrogen dioxide, and
sulphur dioxide [11,12]. Lastly, we measured the concentration of PM2.5 at the city level; future
research should utilize air quality index at a finer geographical level.
5. Conclusions
This study confirms that neighbourhood social capital plays a protective role in the relationship
between depressive symptoms and PM2.5 concentrations in China. PM2.5 concentrations may increase
respondents’ depressive symptoms, while neighbourhood social capital may decrease respondents’
depressive symptoms. Most importantly, neighbourhood social capital weakens the negative influences
of PM2.5 concentrations on respondents’ depressive symptoms. However, the mechanism through
which air pollution negatively impacts residents’ mental health is still unclear in developing countries.
Therefore, further studies are warranted.
Author Contributions: Conceptualization, Ruoyu Wang and Ye Liu; Methodology, Ruoyu Wang; Software,
Ruoyu Wang and Penghua Liu; Validation, Ruoyu Wang and Penghua Liu; Formal Analysis, Ruoyu Wang
and Penghua Liu; Investigation, Penghua Liu and Hongsheng Chen; Resources, Penghua Liu and Hongsheng
Chen; Data Curation, Penghua Liu and Hongsheng Chen; Writing-Original Draft Preparation, Ruoyu Wang
and Penghua Liu; Writing-Review & Editing, Ruoyu Wang and Penghua Liu; Visualization, Ruoyu Wang and
Penghua Liu; Supervision, Desheng Xue, and Ye Liu; Project Administration, Desheng Xue, and Ye Liu; Funding
Acquisition, Desheng Xue, and Ye Liu.
Funding: This research was funded by the National Natural Science Foundation of China (No. 41320104001,
No. 41501151) and Innovative R&D Team Introduction Program of Guangdong Province supported this research.
Acknowledgments: The National Natural Science Foundation of China (No. 41320104001, No. 41501151) and
Innovative R&D Team Introduction Program of Guangdong Province supported this research. Data analyzed in
this paper were collected by the research project “China Labor-force Dynamics Survey (CLDS)” carried out by
the Center for Social Survey, Sun Yat-sen University. The authors appreciate the assistance in providing data by
the institutes and individuals aforementioned. Please direct your correspondence to liuye25@mail.sysu.edu.cn.
All errors remain ours.
Conflicts of Interest: The authors declare no conflict of interest.Int. J. Environ. Res. Public Health 2018, 15, 1160 11 of 13
References
1. Adjaye-Gbewonyo, K.; Kawachi, I.; Subramanian, S.V.; Avendano, M. High social trust associated with
increased depressive symptoms in a longitudinal South African sample. Soc. Sci. Med. 2018, 197, 127–135.
[CrossRef] [PubMed]
2. Murray, C.J.L.; Vos, T.; Lozano, R.; Naghavi, M.; Flaxman, A.D.; Michaud, C.; Ezzati, M.; Shibuya, K.;
Salomon, J.A.; Abdalla, S.; et al. Disability-adjusted life years (DALYs) for 291 diseases and injuries in
21 regions, 1990–2010: A systematic analysis for the Global Burden of Disease Study 2010. Lancet 2012, 380,
2197–2223. [CrossRef]
3. Rumsfeld, J.S.; Ho, P.M. Depression and cardiovascular disease: A call for recognition. Circulation 2005, 111,
250–253. [CrossRef] [PubMed]
4. Hare, D.L.; Toukhsati, S.R.; Johansson, P.; Jaarsma, T. Depression and cardiovascular disease: A clinical
review. Eur. Heart J. 2014, 35, 1365–1372. [CrossRef] [PubMed]
5. Ruo, B.; Rumsfeld, J.S.; Hlatky, M.A.; Liu, H.; Browner, W.S.; Whooley, M.A. Depressive symptoms and
health-related quality of life: The Heart and Soul Study. JAMA 2003, 290, 215–221. [CrossRef] [PubMed]
6. Stewart, W.F.; Ricci, J.A.; Chee, E.; Hahn, S.R.; Morganstein, D. Cost of lost productive work time among US
workers with depression. JAMA 2003, 289, 3135–3144. [CrossRef] [PubMed]
7. Ekman, M.; Granström, O.; Omerov, S.; Jacob, J.; Landén, M. The societal cost of depression: Evidence from
10,000 Swedish patients in psychiatric care. J. Affect. Disord. 2013, 150, 790–797. [CrossRef] [PubMed]
8. China Health and Retirement Longitudinal Study 2013. Available online: http://charls.pku.edu.cn/zh-CN
(accessed on 25 November 2014).
9. Chan, C.K.; Yao, X. Air pollution in mega cities in China. Atmosphere. Environ. 2008, 42, 1–42. [CrossRef]
10. Xu, X.; Gao, J.; Dockery, D.W.; Chen, Y. Air pollution and daily mortality in residential areas of Beijing, China.
Arch. Environ. Health: Int. J. 1994, 49, 216–222. [CrossRef] [PubMed]
11. Kioumourtzoglou, M.A.; Power, M.C.; Hart, J.E.; Okereke, O.I.; Coull, B.A.; Laden, F.; Weisskopf, M.G.
The association between air pollution and onset of depression among middle-aged and older women. Am. J.
Epidemiol. 2017, 185, 801–809. [CrossRef] [PubMed]
12. Lim, Y.H.; Kim, H.; Kim, J.H.; Bae, S.; Park, H.Y.; Hong, Y.C. Air pollution and symptoms of depression in
elderly adults. Environ. Health Perspect. 2012, 120, 1023. [CrossRef] [PubMed]
13. Cho, J.; Choi, Y.J.; Suh, M.; Sohn, J.; Kim, H.; Cho, S.K.; Ha, K.H.; Kim, C.; Shin, D.C. Air pollution as a risk
factor for depressive episode in patients with cardiovascular disease, diabetes mellitus, or asthma. J. Affect.
Disord. 2014, 157, 45–51. [CrossRef] [PubMed]
14. Szyszkowicz, M. Air pollution and emergency department visits for depression in Edmonton, Canada. Int. J.
Occup. Med. Environ. Health 2007, 20, 241–245. [CrossRef] [PubMed]
15. Szyszkowicz, M.; Rowe, B.; Colman, I. Air pollution and daily emergency department visits for depression.
Int. J. Occup. Med. Environ. Health 2009, 22, 355–362. [CrossRef] [PubMed]
16. Wang, Y.; Eliot, M.N.; Koutrakis, P.; Gryparis, A.; Schwartz, J.D.; Coull, B.A.; Mittleman, M.A.; Milberg, W.P.;
Lipsitz, L.A.; Wellenius, G.A. Ambient air pollution and depressive symptoms in older adults: Results from
the MOBILIZE Boston study. Environ. Health Perspect. 2014, 122, 553. [CrossRef] [PubMed]
17. Naarding, P.; Schoevers, R.A.; Janzing, J.G.; Jonker, C.; Koudstaal, P.J.; Beekman, A.T. A study on symptom
profiles of late-life depression: The influence of vascular, degenerative and inflammatory risk-indicators.
J. Affect. Disord. 2005, 88, 155–162. [CrossRef] [PubMed]
18. Ng, F.; Berk, M.; Dean, O.; Bush, A.I. Oxidative stress in psychiatric disorders: Evidence base and therapeutic
implications. Int. J. Neuropsychopharmacol. 2008, 40, 851–876. [CrossRef] [PubMed]
19. Kent, S.T.; McClure, L.A.; Crosson, W.L.; Arnett, D.K.; Wadley, V.G.; Sathiakumar, N. Effect of
sunlight exposure on cognitive function among depressed and non-depressed participants: A REGARDS
cross-sectional study. Environ. Health 2009, 8, 34. [CrossRef] [PubMed]
20. Benedetti, F.; Colombo, C.; Barbini, B.; Campori, E.; Smeraldi, E. Morning sunlight reduces length of
hospitalization in bipolar depression. J. Affect. Disord. 2001, 62, 221–223. [CrossRef]
21. Zhang, X.; Zhang, X.; Chen, X. Happiness in the air: How does a dirty sky affect mental health and subjective
well-being? J. Environ. Econ. Manag. 2017, 85, 81–94. [CrossRef] [PubMed]
22. Li, F.; Liu, Y.; Lü, J.; Liang, L.; Harmer, P. Ambient air pollution in China poses a multifaceted health threat to
outdoor physical activity. J. Epidemiol. Commun. Health 2015, 69, 201. [CrossRef] [PubMed]Int. J. Environ. Res. Public Health 2018, 15, 1160 12 of 13
23. Giles, L.V.; Koehle, M.S. The Health Effects of Exercising in Air Pollution. Sports Med. 2014, 44, 223–249.
[CrossRef] [PubMed]
24. Wen, X.J.; Balluz, L.S.; Shire, J.D.; Mokdad, A.H.; Kohl, H.W.I. Association of self-reported leisure-time
physical inactivity with particulate matter 2.5 air pollution. J. Environ. Health 2009, 72, 40–44. [PubMed]
25. Lin, G.Z.; Li, L.; Song, Y.F.; Zhou, Y.X.; Shen, S.Q.; Ou, C.Q. The impact of ambient air pollution on suicide
mortality: A case-crossover study in Guangzhou, China. Environ. Health 2016, 15, 90. [CrossRef] [PubMed]
26. Kim, C.; Jung, S.H.; Kang, D.R.; Kim, H.C.; Moon, K.T.; Hur, N.W.; Shin, D.C.; Suh, I. Ambient particulate
matter as a risk factor for suicide. Am. J. Psychiatry 2010, 167, 1100–1107. [CrossRef] [PubMed]
27. Wong, C.M.; Yang, L.; Thach, T.Q.; Chau, P.Y.; Chan, K.P.; Thomas, G.N.; Lam, T.H.; Wong, T.W.; Hedley, A.J.;
Peiris, J.S. Modification by Influenza on Health Effects of Air Pollution in Hong Kong. Environ. Health
Perspect. 2009, 117, 248–253. [CrossRef] [PubMed]
28. Kawachi, I.; Kennedy, B.P.; Glass, R. Social capital and self-rated health: A contextual analysis. Am. J. Public
Health 1999, 89, 1187–1193. [CrossRef] [PubMed]
29. Niedzwiedz, C.L.; Richardson, E.A.; Tunstall, H.; Shortt, N.K.; Mitchell, R.J.; Pearce, J.R. The relationship
between wealth and loneliness among older people across Europe: Is social participation protective?
Prev. Med. 2016, 91, 24–31. [CrossRef] [PubMed]
30. Boneham, M.A.; Sixsmith, J.A. The voices of older women in a disadvantaged community: Issues of health
and social capital. Soc. Sci. Med. 2006, 62, 269–279. [CrossRef] [PubMed]
31. Feng, Z.; Vlachantoni, A.; Liu, X.; Jones, K. Social trust, interpersonal trust and self-rated health in China:
A multi-level study. Int. J. Equity Health 2016, 15, 180. [CrossRef] [PubMed]
32. Lindström, M.; Moghaddassi, M.; Merlo, J. Individual self-reported health, social participation and
neighbourhood: A multilevel analysis in Malmo, Sweden. Prev. Med. 2004, 39, 135–141. [CrossRef]
[PubMed]
33. Abbott, S.; Freeth, D. Social capital and health: Starting to make sense of the role of generalized trust and
reciprocity. J. Health Psychol. 2014, 13, 874–883. [CrossRef] [PubMed]
34. Weitzman, E.R.; Kawachi, I. Giving means receiving: The protective effect of social capital on binge drinking
on college campuses. Am. J. Public Health 2000, 90, 1936–1939. [PubMed]
35. Holtgrave, D.R.; Crosby, R. Is Social Capital a Protective Factor Against Obesity and Diabetes? Findings
from an Exploratory Study. Ann. Epidemiol. 2006, 16, 406–408. [CrossRef] [PubMed]
36. Evans, G.W.; Kutcher, R. Loosening the link between childhood poverty and adolescent smoking and obesity:
The protective effects of social capital. Psychol. Sci. 2011, 22, 3–7. [CrossRef] [PubMed]
37. Murayama, H.; Yu, N.; Matsuo, E.; Nishi, M.; Taniguchi, Y.; Fujiwara, Y.; Shinkai, S. Are neighborhood
bonding and bridging social capital protective against depressive mood in old age? A multilevel analysis in
Japan. Soc. Sci. Med. 2015, 124, 171–179. [CrossRef] [PubMed]
38. Ard, K.; Colen, C.; Becerra, M.; Velez, T. Two mechanisms: The role of social capital and industrial pollution
exposure in explaining racial disparities in self-rated health. Int. J. Environ. Res. Public Health 2016, 13, 1025.
[CrossRef] [PubMed]
39. China Labor Force Dynamics Survey. Secondary China Labor Force Dynamics Survey 2017. Available online:
http://css.sysu.edu.cn/Data (accessed on 27 November 2017).
40. Airborne Fine Particulate Matter and Air Quality Index. Secondary Airborne Fine Particulate Matter and Air
Quality Index 2016. Available online: http://www.pm25.in/ (accessed on 25 June 2013).
41. Liu, P.; Yao, Y.; Liang, H.; Liang, Z.; Zhang, Y.; Wang, H. Analyzing spatiotemporal distribution of PM(2.5) in
China by integrating Kalman filter and multilevel clustering. J. Geo-Inform. Sci. 2017, 19, 475–485. [CrossRef]
42. Kalman, R.E.; Bucy, R.S. New results in linear filtering and prediction theory. J. Basic Eng. 1961, 83, 95–108.
[CrossRef]
43. Davidian, M. Hierarchical linear models: Applications and data analysis methods. J. Am. Stat. Assoc. 2003,
98, 767–768. [CrossRef]
44. Miller, K.A.; Siscovick, D.S.; Sheppard, L.; Shepherd, K.; Sullivan, J.H.; Anderson, G.L.; Kaufman, J.D.
Long-term exposure to air pollution and incidence of cardiovascular events in women. N. Engl. J. Med. 2007,
356, 447–458. [CrossRef] [PubMed]
45. Chen, H.; Liu, Y.; Zhu, Z.; Li, Z. Does where you live matter to your health? Investigating factors that
influence the self-rated health of urban and rural Chinese residents: Evidence drawn from Chinese General
Social Survey data. Health Qual. Life Outcomes 2017, 15, 78. [CrossRef] [PubMed]Int. J. Environ. Res. Public Health 2018, 15, 1160 13 of 13
46. Lü, J.; Liang, L.; Feng, Y.; Li, R.; Liu, Y. Air pollution exposure and physical activity in China: Current
knowledge, public health implications, and future research needs. Int. J. Environ. Res. Public Health 2015, 12,
14887–14897. [CrossRef] [PubMed]
47. Phelan, J.C.; Link, B.G.; Tehranifar, P. Social conditions as fundamental causes of health inequalities: Theory,
evidence, and policy implications. J. Health Soc. Behav. 2010, 51, S28–S40. [CrossRef] [PubMed]
48. Wang, Y.P.; Wang, Y.; Jiansheng, W.U. Urbanization and informal development in China: Urban villages in
Shenzhen. Int. J. Urban Reg. Res. 2009, 33, 957–973. [CrossRef]
49. Cornwell, B.; Laumann, E.O. The health benefits of network growth: New evidence from a national survey
of older adults. Soc. Sci. Med. 2015, 125, 94–106. [CrossRef] [PubMed]
50. Feng, Z.; Jones, K.; Wang, W.W. An exploratory discrete-time multilevel analysis of the effect of social support
on the survival of elderly people in China. Soc. Sci. Med. 2015, 130, 181–189. [CrossRef] [PubMed]
51. Fuhrer, R.; Stansfeld, S.A. How gender affects patterns of social relations and their impact on health:
A comparison of one or multiple sources of support from “close persons”. Soc. Sci. Med. 2010, 54, 811–825.
[CrossRef]
52. Kumar, S.; Calvo, R.; Avendano, M.; Sivaramakrishnan, K.; Berkman, L.F. Social support, volunteering and
health around the world: Cross-national evidence from 139 countries. Soc. Sci. Med. 2012, 74, 696–706.
[CrossRef] [PubMed]
53. Lee, S.Y.D.; Arozullah, A.M.; Cho, Y.I. Health literacy, social support, and health: A research agenda.
Soc. Sci. Med. 2004, 58, 1309–1321. [CrossRef]
54. Gascon, M.; Triguero-Mas, M.; Martínez, D.; Dadvand, P.; Rojas-Rueda, D.; Plasència, A.;
Nieuwenhuijsen, M.J. Residential green spaces and mortality: A systematic review. Environ. Int. 2016,
86, 60–67. [CrossRef] [PubMed]
55. Liu, X.; Liang, X.; Li, X.; Xu, X.; Ou, J.; Chen, Y.; Li, S.; Wang, S.; Pei, F. A future land use simulation model
(FLUS) for simulating multiple land use scenarios by coupling human and natural effects. Landsc. Urban
Plan. 2017, 168, 94–116. [CrossRef]
56. Torpe, L.; Lolle, H. Identifying social trust in cross-country analysis: Do we really measure the same?
Soc. Indic. Res. 2011, 103, 481–500. [CrossRef]
57. Liu, Y.; Xu, W. Destination choices of permanent and temporary migrants in China, 1985–2005. Popul. Space
Place 2017, 23, e1963. [CrossRef]
58. Liu, Y.; Zhang, F.; Wu, F.; Liu, Y.; Li, Z. The subjective wellbeing of migrants in Guangzhou, China:
The impacts of the social and physical environment. Cities 2017, 60, 333–342. [CrossRef]
© 2018 by the authors. Licensee MDPI, Basel, Switzerland. This article is an open access
article distributed under the terms and conditions of the Creative Commons Attribution
(CC BY) license (http://creativecommons.org/licenses/by/4.0/).You can also read