A Digital Age Read NZ Te Pou Muramura - NZ Book Council
←
→
Page content transcription
If your browser does not render page correctly, please read the page content below

September 2019

                    Detailed
                    Reading in
                    Findings
                    a Digital Age
                     Read NZ
                     Te Pou Muramura

Lead Authors:
Carl Davidson: Chief Social Scientist
Rachel Harris: Research Manager
Research First Ltd
Read NZ   Reading in a Digital Age                                                                                                           2

          1             Context			                                                                                           3
          2             Key messages			                                                                                      4
          3             The need for this research			                                                                        5
          4             Research design 			                                                                                  9
          5             Detailed findings 			                                                                                13
                        General reading attitudes			                                                                         14
                        A snapshot of reading in 2019			                                                                     17
                        Online vs non-online
                        reading behaviour			                                                                                 24
                        The impact of digital
                        behaviour on reading habits			                                                                       32
          6             Appendix			                                                                                          35
                        Sample profile			                                                                                    36
                        Behavioural data profile			                                                                          37
                        Reading and device profile			                                                                        37

          Prepared for:                Disclaimer:
          Jo Cribb, Chief Executive,   Research First notes that the views presented in the report do not necessarily represent the
          Read NZ Te Pou Muramura      views of Read NZ Te Pou Muramura. In addition, the information in this report is accurate to the
          jo@read-nz.org               best of the knowledge and belief of Research First Ltd. While Research First Ltd has exercised
                                       all reasonable skill and care in the preparation of information in this report, Research First Ltd
                                       accepts no liability in contract, tort, or otherwise for any loss, damage, injury or expense,
                                       whether direct, indirect, or consequential, arising out of the provision of information in this report.
Read NZ   Reading in a Digital Age                                                   3

          1. Context
          The research reported here set out to better understand New
          Zealanders’ online reading behaviours. Unlike previous research, this
          report used a version of an ‘experiential sampling’ design, asking about
          what people were reading at various points across the day and week.
          This kind of approach is a more reliable guide to what people are doing
          than based simply on asking them to recall what they have done.
          As a result, this research likely presents a unique insight into our
          reading behaviour. This is important because we read in different ways
          - we can quickly scan material and we can immerse ourselves in longer
          texts. Both ways of reading are useful but there is a strong argument
          that many of the benefits of reading are closely linked to a deeper
          engagement that occurs with those longer texts (see Section 3: The
          need for this research).
Read NZ Reading in a Digital Age 4
2. Key messages
The key messages from the research are:
• The participants in this research report reading more online sources than print, regardless of the age or
gender of the reader.
• However, while online reading is displacing traditional reading, it is not replacing it. Both formats continue
to be read by the majority of readers every week.
• Indeed, the growth of online sources may be helping to grow reading. One in three participants in this
research believe they are reading more now than ever before because of the availability of online content
and the ease and enjoyment gained from switching between materials. Others also reported finding online
reading pleasurable.
• High levels of reading behaviour are reported across a number of subgroups.
- Females are generally more avid readers than males; reading enjoyment increases with age; people
of Maori/Pasifika ethnicity find reading less enjoyable.
- Digital content is read by New Zealanders of all ages, with blogs and e-magazines more likely to be
read by those who are tertiary qualified.
- Traditional reading material is also read by a range of New Zealanders, albeit generally lower for
Asian New Zealanders.
• Yet it is likely that much of this ‘reading’ does not reach the level of engagement that has been shown to
provide the benefits associated with reading longer form pieces (see Section 3: The need for this research).
• The participants in this research report being more engaged with longer form reading material whereas
their interaction with online content is more likely to be brief, and involve switching between material.
• At the same time, the research suggests they are engaging with those longer form pieces less often:
44% of the readers in this research report finding it harder to read long and challenging content than they
did in the past, more so for those aged 25-54 and tertiary qualified New Zealanders.
• They also report being able to concentrate less and being less likely to read longer online content. This is
particularly so for females and those aged 25-34.
Read NZ   Reading in a Digital Age                                                                                                           5

          3. The need for this research

          Read NZ Te Pou Muramura (formerly New Zealand
          Book Council) aims to grow a nation of readers.
          It wants more New Zealanders to read more.1 It
          wants to do this because New Zealand’s literacy
          rates directly impact on its future prosperity
          and wellbeing. The research about the societal
          benefits of reading is clear – it increases empathy
          and social skills, and it improves health and
          wellbeing.2

          1   http://www.read-nz.org/
          2   Department for Education (2012) Research evidence on reading for pleasure. Education standards research team, Department for
              Education, UK Government, May 2012. Reference: DFE-57519-2012, https://assets.publishing.service.gov.uk/government/uploads/
              system/uploads/attachment_data/file/284286/reading_for_pleasure.pdf
Read NZ   Reading in a Digital Age                                                                                                                    6

          3. The need for this research
          Research by the UK think-tank Demos has shown the profound impact reading can have on alleviating
          loneliness, mental health problems, dementia, and social immobility.3 This led the Demos researchers to
          conclude

               It’s time we take reading seriously … and recognise books for more than their educational value.
               We must start to see reading as a crucial tool for maintaining mental wellbeing and something worth
               investing in.4

          To help Read NZ Te Pou Muramura grow a nation of readers, it is important to understand how New
          Zealanders are reading today. While there is some baseline data about how often New Zealanders read
          books, there is an incomplete understanding of how we read online. For instance, distinguishing between
          how much time is spent reading longer form pieces (such as blogs or online articles) and how much time
          is spent scrolling through social media posts or following hypertext links.

          This research is important because so many of the benefits of reading follow from being fully engaged in
          the act of reading. It is possible that the increase in online reading is undermining that engagement in at
          least two ways. The first is that it simply displaces traditional reading, with no time left for reading longer
          form pieces due to the greater attraction of online content. The second, potentially more damaging, is
          that increased time online undermines the ability to read those longer form pieces.

          The displacement argument is easy to see. The earliest recorded use of the internet in New Zealand
          occurred in 1985, and the first local website was created in 1992. By 1996, only one in five New
          Zealanders had heard of the internet.5 And yet by 2018 New Zealand had become one of ‘the most
          internet-addicted nations in the world’,6 with one study suggesting Kiwis spend 56 hours (or 47 per cent
          of their average waking hours in a week) on a digital device.7 Another study shows that in 2018 New
          Zealanders owned an average of 6.5 digital devices, with 67 per cent of them being connected to the
          internet.8

          As internet pioneer Steve Crocker noted, “there has not been, in the entire history of mankind, anything
          that has changed so dramatically as computer communications”.9

          Given the rapid growth in time spent online or with a digital device, it is perhaps no surprise that the time
          available for reading longer form pieces has declined. Read NZ Te Pou Muramura’s own research shows
          that 400,000 New Zealanders did not pick up a book in 201710; and in 2018 New Zealand came 30th out of
          50 OECD countries in a study of childhood reading comprehension, a list that New Zealand topped in the
          1970s.11

          3    Demos (2018) A Society of Readers, London. https://demosuk.wpengine.com/wp-content/uploads/2018/12/A-Society-of-
               Readers-Formatted.pdf
          4     Demos (2018) Want to tackle loneliness? Invest in a society of readers, https://demos.co.uk/blog/want-to-tackle-loneliness-
               invest-in-a-society-of-readers/
          5    Russell Brown, ‘Digital media and the internet’, Te Ara - the Encyclopedia of New Zealand, http://www.TeAra.govt.nz/en/digital-media-
               and-the-internet (accessed 16 July 2019)
          6    Internet World Stats: Internet World Usage > Links > New Zealand. https://www.internetworldstats.com/usage/use016.htm
          7    ConsumerScape research cited in ‘Proof that Kiwis love their devices’. https://www.stuff.co.nz/technology/digital-living/96220747/
               proof-that-kiwis-love-their-devices
          8    IDC research quoted in ‘Proof that Kiwis love their devices’. https://www.stuff.co.nz/technology/digital-living/96220747/proof-that-
               kiwis-love-their-devices
          9    In Burkeman, O. (2009) “Forty Years of the Internet: How the World Changed For Ever”/The Guardian/October 23rd 2009.
          10 New Zealand Book Council (2017) Book Reading in New Zealand, July 2017, Wellington.
          11   OECD (2000) Literacy in the Information Age: Final Report of the International Adult Literacy Survey, OECD Publications, Paris.
Read NZ   Reading in a Digital Age                                                                                                               7

          The argument that time spent online or with digital devices potentially undermines (rather than simply
          displaces) longer form reading is based on what all the time online does to our brains. In particular, the
          move to engaging with material through ‘continuous partial attention’12 means an increase in ‘cognitive
          impatience’13. This leads to the loss of what Professor Maryanne Wolf has called ‘deep reading’ – the kind
          of reading that requires the reader’s complete attention to understand the thoughts on the page. This lack
          of engagement means opportunities to develop the brain circuitry needed for deep reading are absent,
          which may also affect the ability to engage in deep reflection and original thought. Or, as Professor
          Maryanne Wolf and Mirit Barzilla put it, this change in reading behaviour might:

                   Short-circuit the development of slower, more cognitively demanding comprehensive processes
                   that go into the formation of deep reading and deep thinking. If such truncated development occurs,
                   we may be spawning a culture so inured to sound bites and thought bits that it fosters neither
                   critical analysis nor contemplative processes in its members14.

          What is not in doubt is that when people read materials on a screen, they read in very different ways from
          the traditional printed page. In particular, skimming is much more common. Research shows that when
          engaging with online content, readers tend to read in a F pattern scanning for key words.15 Also, readers
          need to make a decision about which hyperlinks to follow rather than directing their full attention to the
          text. It’s for these reasons that Sam Anderson has noted “when we read online, we hardly read at all”.16
          Or, as Dana Gioia, the Chair of the National Endowment for the Arts in the USA, put it;

                   Whatever the benefits of newer electronic media, they provide no measurable substitute for the
                   intellectual and personal development initiated and sustained by frequent reading.17

          The increase in cognitive impatience and lack of engagement with online materials is perhaps best
          illustrated with the creation of the label TL;DR (‘too long; didn’t read’). It’s not entirely clear where and
          when TL;DR first began but the first Urban Dictionary entry was submitted on January 15th, 2003. The
          Google Insights graph for the term indicates a noticeable spike in search interest circa 2006. This idea
          has been expanded by the Scottish cartoonish Tom Gauld who, with his “Useful abbreviations for the
          time-pressed online reader” suggested the addition of:
                                                                                          © Tom Gould/ heartagency.com

          Given this context, it is clear why Read NZ / Te Pou Muramura was so interested in better understanding
          how New Zealanders are reading in 2019, with a special emphasis on exploring how engaged they are
          with the things they are reading.

          12 Rose, E (2010) “Continuous Partial Attention: Reconsidering the Role of Online Learning in the Age of Interruption”, Educational
             Technology / Vol. 50, No. 4 (July-August 2010), pp. 41-46
          13   Wolf, M. (2018) “Skim reading is the new normal. The effect on society is profound”, The Guardian, August 25th 2018
          14   Wolf, M. and Barzillao, M. (2009) “The Importance of Deep Reading”, Education Leadership March 2009 | Volume 66 | Number 6
               Pages 32-37
          15 Wolf, M. (2018) “Skim reading is the new normal. The effect on society is profound”, The Guardian / August 25th 2018
          16 Anderson, S. (2009) “In Defense of Distraction”, New York Magazine, May 17th 2009.
          17   Rich, M. (2018) “Literacy Debate: Online, R U Really Reading?”, New York Times, July 27th 2018, https://www.nytimes.com/2008/07/27/
               books/27reading.html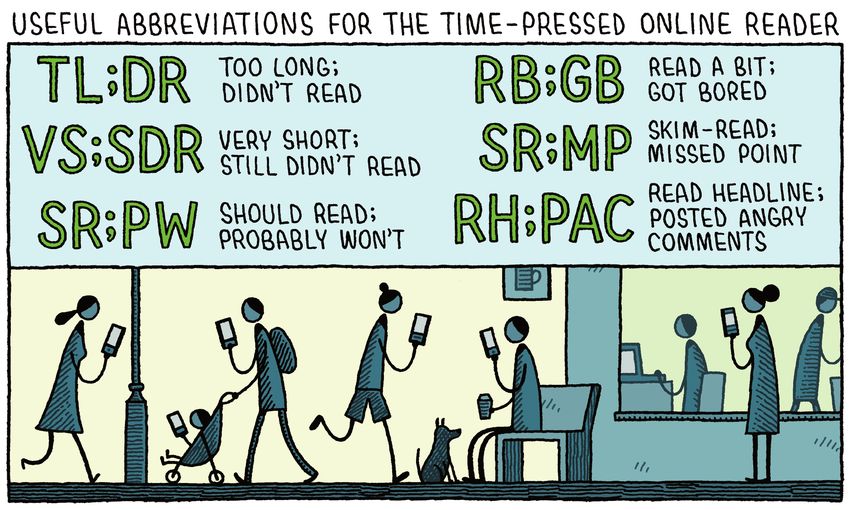
Read NZ   Reading in a Digital Age                                                                                        8

          The increase in cognitive impatience and lack of engagement with online materials is perhaps best
          illustrated with the creation of the label TL;DR (‘too long; didn’t read’). It’s not entirely clear where and
          when TL;DR first began but the first Urban Dictionary entry was submitted on January 15th, 2003. The
          Google Insights graph for the term indicates a noticeable spike in search interest circa 2006.

          This idea has been expanded by the Scottish cartoonish Tom Gauld who, with his “Useful abbreviations
          for the time-pressed online reader” suggested the addition of useful abbreviations suggested additions as
          referenced in Figure 3.1 below.

          Figure 3.1: Useful abbreviations for the online reader

                                                                                                                              © Tom Gould/ heartagency.com
          Given this context, it is clear why Read NZ Te Pou Muramura was so interested in better understanding
          how New Zealanders are reading in 2019, with a special emphasis on exploring how engaged they are
          with the things they are reading.
Read NZ   Reading in a Digital Age                                                                                                              9

          4. Research design

          Providing an accurate picture of online reading
          behaviour is an interesting challenge. We know
          from international research that media multi-
          tasking is common, with users either ‘stacking’ or
          ‘meshing’ the use of devices. What is less clear                           18

          is the impact this has on the level of engagement
          readers have with the various sources. As a
          result, Read NZ Te Pou Muramura recognised
          the need for an intellectually sophisticated and
          methodologically robust research response.

          18 OFCOM (2013) Communications Market Report. UK Office of Communications, London. ‘Meshing’ involves multi-tasking focused on
             interacting or communicating about content they are viewing, while ‘stacking’ means multiple device use for conducting unrelated
             media tasks. In the 2013 OFCOM survey nearly half of the respondents reported regularly media stacking, and one-quarter reported
             media stacking.
Read NZ   Reading in a Digital Age                                                                                                                10

          4. Research design
          This research needed to be nationally representative to enable Read NZ Te Pou Muramura to look at
          reading behaviour by a series of stakeholder groups. Given this need to measure behaviour, the research
          needed a method that sampled behaviour in real time.19

          This meant that the Experiential Sampling Method was the obvious solution for Read NZ Te Pou
          Muramura’s needs. This approach (also known as ‘ecological momentary assessment’) involves asking
          participants about their behaviour on multiple occasions over time. By asking about behaviour in the
          moment it occurs, the method overcomes the biases associated with recall. For instance recall can be
          distorted by ‘social desirability bias’ (where respondents provide answers they believe are socially
          desirable rather than an accurate reflection of their actual behaviour) and ‘recency bias’ (where their
          answers are based on their most recent behaviour rather than on typical behaviour patterns). Memory is
          often distorted by phenomena like the Von Restorff Effect (where an item that sticks out is more likely to
          be remembered than other items), and the Zeigarnik Effect (where uncompleted or interrupted tasks are
          remembered better than completed ones). The Experiential Sampling Method was designed to overcome
          the inherent fallibility of recall and it is a method that is common in psychological research,20 where its
          validity for studies such as this has been repeatedly confirmed.21

          In practice, using this method meant empanelling a randomly-selected sample of New Zealanders and
          sending them a short SMS survey every day across a seven day period (at various times of day). As well
          as tracking reading behaviour, this research was interested in hearing from readers about how they think
          their reading has changed over time, and this was done via an online survey after the SMS data collection
          was complete. Given New Zealand’s high internet penetration rate (86% of the population in 201222),
          the panel was recruited online. This approach does mean that those without access to the internet were
          unable to participate in the research, and suggests the results should skew towards those who are
          digitally connected.

          19 Because recall of behaviour is unreliable and subject to a series of cognitive biases. Given how often participants in the research may
             be ‘reading’ online, it makes little sense to ask them to recall those instances over a protracted period.
          20 Larson, R.; Csikszentmihalyi, M. (1983). “The experience sampling method”. New Directions for Methodology of Social and Behavioral
             Science; and 15: 41–56 and Hektner, J.M., Schmidt, J.A., Csikszentmihalyi, M. (Eds.). (2006). Experience Sampling Method: Measuring
             the Quality of Everyday Life”, Sage Publications, Inc
          21 Csikszentmihalyi, M. (July 2014). Validity and Reliability of the Experience-Sampling Method. New York: Springer.
          22 Internet World Stats, June 2012 https://www.internetworldstats.com/sp/nz.htm
Read NZ Reading in a Digital Age 11
A two-stage research process
Behavioural Broader
data collection reading habits
survey
• Experiential sampling. • Supplementary survey to
• SMS surveys over 2 week period. understand online reading
habits in general.
• 19th June - 2nd July 2019.
• Nationally representative
• 216 New Zealanders.
sample of 515 New
Zealanders.
• July 2019.
Stage One: Behavioural data collection:
• 500 New Zealanders were invited to participate in the SMS survey. Data was collected across seven
days, with a series of text messages sent to participants in the morning, afternoon and evening across
different days.
• As to be expected with this method, partial responses were achieved at different points of the SMS
survey period (due to not everyone responding to every SMS). Overall 216 people responded to any of
the text messages, providing behavioural data across multiple days of the survey period. This number
of responses provided over 1000 points of behavioural data from which to garner a picture of what
typical reading behaviours look like in New Zealand.
Stage Two: Broader reading habits survey:
• At the completion of the behavioural survey, all participants were invited to complete the broader
reading habits survey. 135 respondents followed through to submit their answers to this survey.
• An online panel was used to supplement this data, with N=515 additional responses collected to be
representative of age, gender and region across New Zealand.Read NZ Reading in a Digital Age 12
Some caveats and limitations
The research results presented here are based on over 1000 daily SMS behavioural surveys and two
perception surveys that have a combined sample of 647 responses. This is clearly a significant dataset
and perhaps even a unique one. The validity of the results is underpinned by an analytical technique
known as ‘triangulation’, which is the use of multiple perspectives to create a coherent picture of the topic
being studied. By constructing such a picture from multiple standpoints and approaches, Read NZ Te Pou
Muramura can be confident that it presents a robust and valid view. It is the presence of this ‘triangulation’
in the dataset that gives Research First confidence that the themes uncovered in this research can be
generalised to a broader audience.
But this is not to say that the research results presented here are without limitations, or should be
accepted uncritically. The limitation of the online selection method has been noted above, and this skew
towards digitally connected readers is likely compounded by the selection bias that occurs as people
opt-in to the SMS behavioural survey sample. Similarly, while the overall sample is large, the results for
any sub-groups in the sample will be less useful than for the sample as a whole. Where these groups are
particularly small, the results for those groups need to be read with some caution.
Finally, there are places in this report where the data from the behavioural survey and the data from the
attitudinal survey seem to point in different directions. This is most likely due to the difference in methods
and samples used for the two surveys. For all the reasons noted in Section 4, the SMS survey will present
a more accurate picture of reading behaviour while the supplementary survey, because its sample is
larger, likely presents a more reliable picture of reading attitudes.Read NZ Reading in a Digital Age 13
5.Detailed
findingsRead NZ Reading in a Digital Age 14
5. Detailed findings
General reading attitudes
Read NZ Te Pou Muramura wants to grow a nation of readers. This research shows that we are already a
nation that enjoys reading and that many wish they had more time to be able to read. In this research:
• Females are more avid readers than males, but certainly wish they could have more time to read.
• Enjoyment of reading increases with age:
- The youngest generation (18 to 24 year olds) are less positive. Nearly 1 in 4 say they dislike
reading, find it stressful, are less likely to finish every book they start, and feel like they have to
read rather than choose to read.
• Those whose highest qualification is school level are significantly less likely to want more time to read
(albeit the proportion is still high at 54%).
• There are some indicative variations by ethnicity. These are outlined on pages 16 and 24.
Figure 5.1: General reading attitudes
I really dislike reading 10% I really enjoy reading 75%
I find reading quite stressful 14% I find reading therapeutic 67%
I read because I have to 19% I read because I want to 67%
If I had spare time, the last
thing I would do is read 18% I wish i had more time to read 63%
something
I rarely had books in my I grew up with books in the
25% 62%
home/family as a child home/family
I often get overwhelmed I like to read and
19% 62%
and only skim the detail understand the detail
I am a slow reader 21% I am a fast reader 55%
There are lots of books I finish every book i start
27% 50%
I’ve only partially read
Source: Research First, July 2019, survey 515Read NZ Reading in a Digital Age 15
Reading
makes me
feel ...
Relaxed, happy, calm,
interested.
Relaxed. It’s what I
do to unwind and
distract myself from the
busyness of life.
It takes me away
from my present day
problems. It teaches me
new things. It relieves
boredom.
It can feel
overwhelming, or
boring, or just dull -
as it’s text.
It can make me
feel impatient or
exasperated.Read NZ Reading in a Digital Age 16
• The attitudinal survey does suggest some interesting differences by ethnicity. For instance, Maori and
Pasifika respondents:
• - Were more likely to associate negative emotions (bored, stressed, etc.) with reading than Pakeha
respondents (21% vs 10%).
• - Were more likely to say they disliked reading (21% vs 9%).
• But Maori and Pasifika in this research were also just as likely to say they grew up with books in their
homes as Pakeha (70% vs 67%).
•
• There were greater differences in the survey between those who identified as Pakeha and as Asian New
Zealanders. For instance:
• - Asian New Zealanders were less likely than Pakeha or Maori and Pasifika to say they grew up with
books in their homes (41% vs 67% for Pakeha and 70% for Maori and Pasifika).
• - Asian New Zealanders were much less likely to say they read because they ‘want to’ (37%
compared with 74% of Pakeha and 60% of Maori and Pasifika).
••
•• .Read NZ Reading in a Digital Age 17
Detailed Findings
A snapshot of reading in 2019
The behavioural data show that at any point in the day (between 7am and 10pm), 2 in 3 New Zealanders
are reading something. Of those surveyed, 17% report reading digital and printed material simultaneously.
Figure 5.2: Reading behaviour
Something digital Something printed Both
31% 20% 17%
Source: Research First behavioural data, July 2019, N=1048
Online reading behaviour
As noted in Section 3, the growth and diffusion of online content in New Zealand has been remarkable
(with other research showing that by 2018 New Zealand had become one of ‘the most internet addicted
23
nations in the world’ ). That high level of engagement with the internet is seen in this research, where
e-mails, online news, other digital communication channels and social media are all consumed regularly.
Figure 5.3: Any digital content being read 2019
•
37%
••
30% 30% 29%
•• .
21%
18%
12%
10%
6% 6% 6%
2%
Email
Online news
Other communication
Social media
Online articles
Work documents
e-book
Online shopping
Study material
Blog
e-magazine
Something else
Source: Research First behavioural data, July 2019, N=266
23 Internet World Stats: Internet World Usage > Links > New Zealand. https://www.internetworldstats.com/usage/use016.htmRead NZ Reading in a Digital Age 18
The supplementary survey also shows that digital communications are not just channels for younger New
Zealanders:
• Digital communication tools (Messenger, WhatsApp etc) have high use right across the age spectrum.
• Social media scrolling has high use across 18-54s and first starts to drop off for 55+, but is still used by the
majority of people (76% of 55-64s and 64% of 65+).
•
Figure 5.4: Digital content ever read
Most common online content
• Email and websites are read less often by Asian New
96% email
Zealanders
89% websites
85% online articles • News sites and articles are more likely to be read by
85% online news sites those who are university qualified
81% other communication • Both statistically higher among females than males
79% social media scrolling • Social media sees less use by those who are retired
Work and education focus • Work documents naturally higher among working age
71% work documents 25-54s
61% study material • Study material among 18-24s
Other online • Females more likely to read blogs than males
57% blogs • Both forms get statistically higher use among those who
44% e-magazines are university qualified
Source: Research First survey, July 2019, total sample 515Read NZ Reading in a Digital Age 19
Reasons for reading online
Most online reading is done for pleasure. However, much is also done for ‘no real reason’.
• 1 in 10 18-24 year olds claim to ‘never’ read online content for pleasure.
• 63% of females are more likely to read online content daily for ‘no real reason’.
• Similarly, those with university level qualifications are more likely to read regularly for no real reason.
Figure 5.5: Frequency of reading digital/online content
For pleasure 60% 22% 6%
For no real reason 55% 24% 6%
For work 41% 15% 5% 13% 22%
For study 20% 14% 9% 7% 25% 24%
Daily Weekly Monthly Every couple of months Less often Never
Source: Research First survey, July 2019, total sample 515Read NZ Reading in a Digital Age 20
Non-online reading behaviour
The research suggests these high levels of digital engagement have not replaced traditional forms of
reading but have displaced some of it and found new ways to sit alongside it.
The printed non-online content most commonly read was a book, but work documents and newspapers
were also common.
Figure 5.6: Non-online/printed content being read 2019
43%
13% 12%
8% 7%
5% 4%
2%
A book Work Newspaper Study material Magazine Pamphlets Hand written Opinion piece
documents e.g. letter
Source: Research First behavioural data, July 2019, N=266
In fact, the supplementary survey reports high levels of engagement across many traditional reading
materials (except for Asian New Zealanders who have lower levels of reported reading of all of these
materials).Read NZ Reading in a Digital Age 21
Print or
hard copies
of content
ever read:
Most common print content
94% newspaper
93% a book
90% a magazine
90% something handwritten
87% pamphlets
Books and magazines have higher
claimed readership by females than
males.
Newspapers and books have lower
readership by 25-34 year olds.
Magazines and pamphlets have
lower consumption by 18-34
year olds.
Work and education focus
84% work documents
82% study material
Source: Research First survey, July 2019,
total sample 515Read NZ Reading in a Digital Age 22
Non-online behaviour
As with online reading, most offline reading is also done for pleasure:
• 18-34s are much less likely to read hard copy content for pleasure.
• Those aged 55+, or with university qualifications, are more likely to read for pleasure.
And just like with online materials, many people report reading printed materials for ‘no real reason’. In
particular:
• 74% of females are more likely to read non-online content daily for ‘no real reason’.
However, while 74% of the research participants said they read online materials ‘for no real reason’ every
day or every week, the percentage doing the same with printed materials was 65%.
Figure 5.7: Frequency of reading non-online content
For pleasure 41% 26% 10% 8% 11%
For no real reason 35% 30% 10% 7%12% 6%
For work 30% 22% 6%5% 15% 21%
For study 13% 14% 11% 9% 30% 22%
Daily Weekly Monthly Every couple of months Less often Never
Source: Research First survey, July 2019, total sample 515Read NZ Reading in a Digital Age 23
Online is displacing rather than replacing traditional reading forms
The previous sections show that both online and non-online reading sources are readily consumed by
New Zealanders – the online formats are not necessarily being used as substitutes for traditional formats,
rather both continue to be read.
However, the behavioural data shows that New Zealanders are reading more sources of digital content at
any point in the day (between 7am and 10pm). On average, the number of items being read are:
Figure 5.8 General reading attitudes average number of reading sources
Something digital Something printed Both
2.5items
1.8
items
3.5
items
Source: Research First, July 2019, QA1, behavioural data 680
The behavioural data shows that people read more online; however, the supplementary survey shows
that more New Zealanders believe they still read more in hard copy than online. However, they all agree
that they read more in detail when engaging with non-online content.
Figure 5.9: General reading attitudes
I read more things online I read more things in hard
35% 42%
than in hard copy copy than online
I read more things in detail I read more things in detail
22% 47%
online than in hard copy in hard copy than online
Source: Research First, July 2019, behavioural data 135, supplementary survey 515Read NZ Reading in a Digital Age 24
Differences in behaviour by ethnicity
As noted on page 16, Maori and Pasifika respondents:
• Were less likely to read things in hard copy than online (28% for Maori and Pasifika vs 44% for Pakeha).
• Were more likely to read online materials in depth than other readers (40% for Maori and Pasifika vs 19%
for Pakeha).
Similarly, Asian New Zealanders were much more likely to read for work/study purposes. For instance 75% of
the Asian New Zealanders in the survey said they read hard copy for work vs 56% for Pakeha, and 46% for
Maori and Pasifika, with a similar distribution for online work reading.
Online versus non-online reading behaviour
Who is reading what?
Looking at regular (at least weekly) readers of online or non-online content, the majority of New
Zealanders claim to be reading both formats. Only 10% of respondents said they read exclusively online
materials.
Figure 5.10: Online and other reading overlap
10%
regularly read online
content weekly,
and not hard copy/
82%
printed content
4%
regularly read both online and
non-online content weekly regularly read non-online
content weekly, and not
digital content
4%
don’t read either
Source: Research First supplementary survey, July 2019, QB4a/b, N=515
The profile of the 10% who are ‘regular online and not hard-copy/print readers’ is small and therefore
indicative only, but points to:
• A younger demographic (40% are aged 18-34).
• Slightly more males than females.
• School educated (no tertiary or vocational qualifications).
• Those who are not currently working.
• People who are less likely to want to read in their spare time.
• Those who are less likely to enjoy reading, and more likely to find it stressful.Read NZ Reading in a Digital Age 25
Weekday versus weekend behaviour
New Zealanders are reading less over the weekend, whether online or non-online formats:
• Within this, we naturally see levels of work and study reading decline on the weekend.
• Meanwhile reading of other communications and e-books increases at weekends.
• Reading of books, newspapers and handwritten content is broadly stable throughout all days of the week.
Figure 5.11: Reading behaviour by time of day
Morning Afternoon Evening Weekday Weekend
Reading
nothing
33% 26% 38% 32% 41%
something
Reading
digital
32% 33% 28% 29% 28%
something
Reading
printed
21% 22% 17% 21% 18%
Reading
both
14% 19% 17% 19% 13%
Source: Research First behavioural data, July 2019, N=266Read NZ Reading in a Digital Age 26
We also see a decline in the number of items read, especially digitally, at the weekend. Those reading
digital content tend to read more sources throughout the day, whereas those that read non-online content
certainly read less of it in the evenings.
Figure 5.12: Average number of items read
Weekday Weekend Morning Afternoon Evening
3.6 3.7
3.4
3.2
3.0
2.7 2.8
2.5
2.2
1.9 2.0
1.8 1.8
1.6
1.4
Something digital Something printed Both
Source: Research First, July 2019, behavioural data 680
Figure 5.13: Reading format over a week
Nothing Digital Printed Both Avg. number of items read
Nothing Digital Printed Both Avg. number of items read
50% 3.5
50% 3.5
3.0
40%
3.0
40% 2.5
30% 2.5
2.0
30%
2.0
1.5
20%
1.5
20% 1.0
10% 1.0
0.5
10%
0.5
0% 0.0
0% Monday Tuesday Wednesday Thursday Friday Saturday Sunday 0.0
Monday
Source: Tuesday
Research First behavioural Wednesday
data, July 2019, Thursday Friday Saturday SundayRead NZ Reading in a Digital Age 27
A typical High digital consumption at the
start of the week.
reading week Printed media peaks mid-week.
for New Overall reading levels decline
Zealanders as the weekend approaches:
looks like this: more people read ‘nothing’
on Thursdays, Saturdays and
Sundays than earlier in the
week.
Work based reading is lower
on a Wednesday and on the
weekend.
Reading for study purposes is
also lower on a Wednesday
and Saturday.
Items read gradually decline by
the time the weekend arrives.Read NZ Reading in a Digital Age 28
While fewer people read on weekends, those that do tend to do so for pleasure
Figure 5.14: Purpose of reading over a week
100% 8% 12%
80%
58% 55% 59% 66%
60% 79% No reason
82%
79%
40% Pleasure
8%
8% 7% Study
7%
20%
27% 31% 4% 27% Work
23% 8%
13% 5%
0% 6% 5%
Monday Tuesday Wednesday Thursday Friday Saturday Sunday
Source: Research First behavioural data, July 2019,
Correspondingly, the reading of hard copy books is high throughout the week, but peaking on
Wednesdays:
• Emails and online articles also peak on a Wednesday and again on Friday.
• Online news and social media fluctuating less over the week.
• Digital work documents reach lows on the weekend as other forms of digital communication
see a slightly greater uptake on the weekend instead.
Figure 5.15: Formats read over a week
Monday Tuesday Wednesday Thursday Friday Saturday Sunday
Hard copy
book
29% 41% 53% 33% 43% 39% 46%
Other digital
comms 22% 38% 28% 27% 31% 36% 39%
Digital work
documents 10% 27% 20% 25% 18% 16% 10%
Email 36% 33% 49% 22% 38% 36% 22%
Social
media 29% 23% 29% 20% 31% 26% 27%
Online
news site 22% 26% 37% 29% 27% 24% 32%
Online
article 19% 16% 30% 17% 23% 24% 14%
Source: Research First behavioural data, July 2019, N=259 (49-97 per category)Read NZ Reading in a Digital Age 29
Engagement
This research is clear that New Zealanders believe they engage less deeply with online content than
traditional reading material. In particular:
• A printed book gets the most immersion by the reader.
• Other digital categories get close attention to the detail but lack complete immersion, while more
skimming behaviour is evident when reading online articles or social media.
Figure 5.16: Engagement
A hard copy book 19% 5% 42% 34%
Digital work documents 6% 18% 55% 20%
Other digital communication 18% 11% 53% 18%
Online news sites 21% 14% 54% 11%
Email 27% 10% 47% 15%
Scrolling through social media 37% 11% 41% 12%
Online articles 29% 21% 38% 13%
Just browsing / skimming it Looking for key words
Paying close attention to the detail Completely immersed in the content
Source: Research First behavioural data, July 2019, N=259Read NZ Reading in a Digital Age 30
We can combine the data in the behavioural survey to create a direct comparison between those reading
a hard copy book and those reading online articles. The time and nature of the reading session is different
along with the level of engagement.
Figure 5.17: Reading behaviours for hard copy book versus online articles
Reading a Reading
hard copy book online articles
Who?
Aged 65+ Aged 18-34
1 in 3 over 1 in 3
When?
Mixture of afternoon Nearly half are reading
and evening reading in the afternoon
Higher readership on a Wednesday, More weekday reading
but also more likely to be read on (especially Wednesday)
weekends
How?
34% 42% 38% 29%
Completely Paying close Paying close Browsing/
immersed attention attention skimming it
Session?
Greater chance of being read on its More likely read while multi tasking
own without multitasking, with many with other content. Reading session
reading for half an hour or longer of 10-30 mins for 1 in 3, or longer than
30 minutes
Source: Research First behavioural data, July 2019, N=259Read NZ Reading in a Digital Age 31
This research also shows that New Zealanders are most likely to read more intensely or deeply with
content that is handwritten, (e.g. a letter or a postcard) followed by a traditional book, and then with
email. Study and work documents also get a high amount of engagement.
Outside of emails, it is noteworthy how frequently readers skim online content, magazines and
newspapers. And beyond this, several online content categories get only partial attention, reinforcing that
content on a screen is often consumed in a different way. However, many digital sources are read in a
similar vein to a hard copy newspaper, pamphlet or magazine whereby it’s read in ‘bits’ rather than in full.
Figure 5.18: Level of perceived engagement with reading material
Something hand written (hard copy) 41% 41%
A book (hard copy) 50% 29%
Other communications(digital) 45% 28%
Email (digital) 50% 27%
Study material (hard copy) 49% 25%
Study material (digital) 43% 23%
Work documents (digital) 49% 22%
Work documents (hard copy) 47% 22%
Online articles (digital) 35% 8%
A blog (digital) 31% 7%
Online news (digital) 29% 7%
A newspaper (hard copy) 23% 7%
Pamphlets (hard copy) 22% 7%
A magazine (hard copy) 29% 6%
Social media (digital) 18% 6%
e-magazine (digital) 23% 5%
A website (digital) 27% 5%
I skimmed the whole thing and would dread the exam I read some bits in detail
I read most of it in detail I read it all in detail and would ace the exam
Source: Research First survey, July 2019, total sample 515, those that have ever read each category (226-496)Read NZ Reading in a Digital Age 32
The impact of digital behaviour on reading habits
As noted above, international research shows that media multi-tasking is common, with users either
24
‘stacking’ or ‘meshing’ the use of devices . This pattern is repeated in this research and is common whilst
watching TV but also while reading hard copy materials.
Figure 5.19: Meshing behaviour
Multi-tasking focused on interacting or communicating about content they are viewing
61% of New Zealanders ‘mesh’ while watching TV
44% ‘mesh’ while reading printed material
40% read about something and comment or share it online
Figure 5.20: Stacking behaviour:
Multiple device use for conducting unrelated media tasks
74% of New Zealanders ‘stack’ while watching TV
33% ‘stack’ while reading printed material
read about something online while commenting or sharing
24% something else online
Interestingly, females are significantly more likely to exhibit each of these behaviours, while those aged
65+ are less likely to do these, especially stacking.
The fact that ‘stacking’ while watching TV is more common is interesting and can be interpreted in three
ways:
- The first is that this rapid switching between content and tasks might reflect a newfound flexibility and
fluidity in how readers process information, developed in response to how they are now immersed in
digital worlds.
- The second, more pessimistic interpretation, is that this popularity of stacking shows the growth of a
‘cognitive impatience’, and a lower tolerance of cognitively challenging material, resulting in a desire to
click through to something novel and more stimulating.
- Thirdly, it could be that ‘stackers’ are aware that some content requires more attention than others,
so as well as becoming adept at rapid switching between materials, they are consciously choosing to
function this way too.
24 OFCOM (2013) Communications Market Report. UK Office of Communications, London. ‘Meshing’ involves multi-tasking focused on
interacting or communicating about content they are viewing, while ‘stacking’ means multiple device use for conducting unrelated
media tasks. In the 2013 OFCOM survey nearly half of the respondents reported regularly media stacking, and one-quarter reported
media stacking.Read NZ Reading in a Digital Age 33
Meshing
Figure 5.21: while watching
Frequency of mediaTV 29%
multi tasking 47%
Meshing while reading non-online
Meshing while watching TV 29%
23% 41% 47%
material
Meshing
Read while
about readingonline
something non-online
while
23%
24% 41%
38%
sharing/commenting about material
it online
Read about something online while
24% 38%
sharing/commenting about it online
Stacking while watching TV 50% 32%
Stacking while reading non-online
Stacking while watching TV 29%50% 41% 32%
material
Read about something online while
Stacking while reading non-online
sharing/commenting about something 29%
33% 41%
41%
material
else online
Read about something online while
sharing/commenting about something 33% 41%
Daily Weeklyelse online
Monthly Every few months Less often
Source: Research First survey, July 2019, those that have ever done each behaviour (123-379)
Daily Weekly Monthly Every few months Less oftenRead NZ Reading in a Digital Age 34
How is reading changing?
The participants in this survey are clear they are, on balance, less likely to read longer pieces of content
online, and that they are finding it harder to read longer content than in the past. Interestingly, university
educated New Zealanders are more likely to say they find it harder to read longer content.
Figure 5.22: Personal impact of screens
I sometimes feel content is too long, so I don’t read it
19% 53%
when I see longer pieces online
I find it harder to read longer and denser articles and
29% 44%
books than I once did
Strongly / slightly disagree Strongly / slightly agree
Source: Research First survey, July 2019, Total sample (515), those saying ‘neither’ not shown
And yet, for some, this means reading more now than ever before, with added enjoyment from switching
between tasks and sources:
• Females and those who are studying are more likely to enjoy switching between sources.
• Those aged 65+ that are more likely to say they read more now than ever before, are also less
likely to switch between sources.
Figure 5.23: Personal impact of screens
On balance, I read more now than I ever have 33% 37%
I like swapping between sources when reading and
26% 34%
watching
Strongly / slightly disagree Strongly / slightly agree
Source: Research First survey, July 2019, Total sample (515) , those saying ‘neither’ not shownRead NZ Reading in a Digital Age 35
6. AppendixRead NZ Reading in a Digital Age 36
6 Appendix
Sample profile
Behavioural data Broader reading
collection habits survey
N=216 N=515
Gender
Male 35% 46%
Female 64% 53%
Gender diverse 1% 0%
Age
18-24 10% 9%
25-34 19% 18%
35-44 22% 18%
45-54 19% 19%
55-64 16% 17%
65+ 11% 18%
Region
Auckland 32%
Wellington 11%
Other North Island 32%
Canterbury 13%
Other South Island 12%
Ethnicity
NZ European 76%
Maori 6%
Pacific peoples 3%
Asian 14%
Middle Eastern/Latin American/African 3%
Other 5%Read NZ Reading in a Digital Age 37
Behavioural data profile
Behavioural data
collection
N=1048
Time of survey completion
Morning 28%
Afternoon 38%
Evening 33%
Day of week
Monday 13%
Tuesday 14%
Wednesday 17%
Thursday 15%
Friday 14%
Saturday 14%
Sunday 13%
Reading and device profile
Behavioural data
collection Broader reading
Those who completed habits survey
final survey N=515
N=135
Average number of books in the house 287 245
Average number of internet enabled devices in the
5.8 5.3
house
When last purchased a book
In the last month 39% 29%
Between 2-3 months ago 23% 21%
Between 3-6 months ago 10% 11%
Between 6-12 months ago 8% 10%
More than a year ago 8% 16%
I can’t remember 13% 4%Research First Ltd Level 1, 23 Carlyle Street Sydenham, Christchurch 8023 New Zealand 0800 101 275 www.researchfirst.co.nz
You can also read