DigitalCommons@UMaine - The University of Maine
←
→
Page content transcription
If your browser does not render page correctly, please read the page content below
The University of Maine
DigitalCommons@UMaine

Honors College

Spring 5-2021

Assessment of Potential Measures at Admit of Harbor Seal Pup
Rehabilitation Success
Shannon Brown

Follow this and additional works at: https://digitalcommons.library.umaine.edu/honors

   Part of the Marine Biology Commons, and the Other Rehabilitation and Therapy Commons

This Honors Thesis is brought to you for free and open access by DigitalCommons@UMaine. It has been accepted
for inclusion in Honors College by an authorized administrator of DigitalCommons@UMaine. For more information,
please contact um.library.technical.services@maine.edu.
ASSESSMENT OF POTENTIAL MEASURES AT ADMIT OF HARBOR SEAL PUP

                          REHABILITATION SUCCESS

                                         by

                                 Shannon R. Brown

                     A Thesis Submitted in Partial Fulfillment of
                     the Requirements for a Degree with Honors
                                 (Marine Science)

                                The Honors College

                                University of Maine

                                     May 2021

Advisory Committee:
      Kristina Cammen, Assistant Professor of Marine Mammal Science
      Heather Hamlin, Associate Professor of Marine Biology and Aquaculture
      Pauline Kamath, Assistant Professor of Animal Health
      Anne Lichtenwalner, Associate Professor of Animal & Veterinary Science
      Chris Mares, Lecturer, Honors College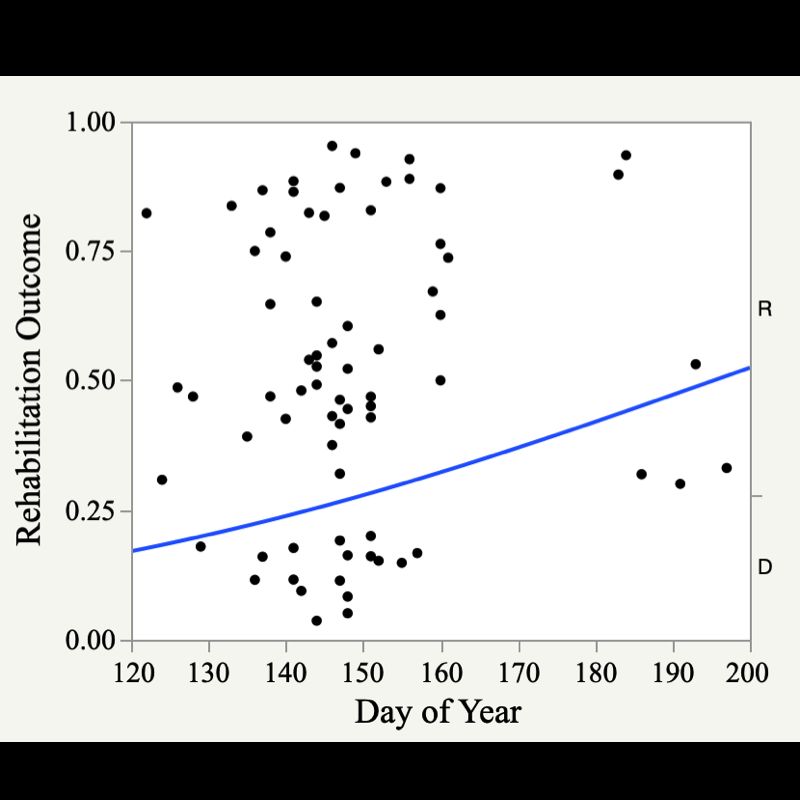
© 2021 Shannon R. Brown
   All Rights Reserved
ABSTRACT

       Harbor seals frequently strand along the northeast coast of the United States due

to injury, illness, disease, and human interaction. In Maine, a non-profit organization,

Marine Mammals of Maine (MMoME), is federally authorized to respond to these

stranded animals and provide short- and long-term rehabilitation, with the ultimate aim to

release the seals back into the wild. I investigated the role of multiple potential measures

of marine mammal health that are evaluated at admit in determining rehabilitation

success of dependent and weaned harbor seal pups from 2016 to 2019. The variables

assessed were the day of the year the patients were first observed in the field, the amount

of time they were observed in the field before collection, findings of human interaction,

age class, weight:length ratio, and 43 blood parameters. This analysis found that pups

have a greater likelihood of being released if they strand later in the year (p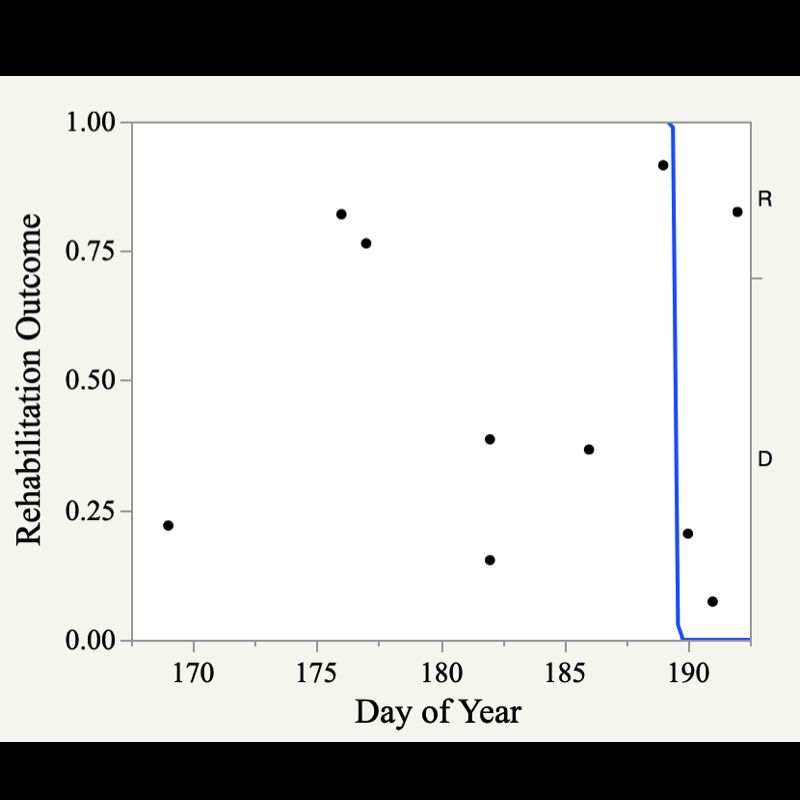
ACKNOWLEDGMENTS

I would like to thank the volunteers and staff (Lynda Doughty, Dr. Kipp Temm, and

Dominique Walk) at Marine Mammals of Maine for their commitment to marine

mammal stranding and rehabilitation and for providing access to data used in this thesis. I

would also like to thank Ainsley Smith, for providing access to data from the US Marine

Mammal Health and Stranding Response Program’s National Stranding Database.

Finally, I would like to thank my thesis advisor, Kristina Cammen, and thesis committee,

Heather Hamlin, Pauline Kamath, Anne Lichtenwalner, and Chris Mares for their advice

and support throughout this process.

                                            iv
TABLE OF CONTENTS
Introduction 1
Methods 5
Stranding Data 5
Data Analysis 5
Explanatory Variables 6
Results 10
Discussion 17
References 24
Appendices 27
Appendix A: Additional Figures 28
Appendix B: Additional Tables 31
Author’s Biography 33
vLIST OF FIGURES
Figure 1: Rehabilitation Outcome vs Day of Year First Observed Stranded (All 11
Individuals)
Figure 2: Rehabilitation Outcome vs Day of Year First Observed Stranded 11
(Dependent Pups)
Figure 3: Rehabilitation Outcome vs Day of Year First Observed Stranded 12
(Weaned Pups)
Figure 4: Rehabilitation Outcome vs Time Spent in Rehab 13
Figure 5: Rehabilitation Outcome vs Transferred to Another Rehab Facility 13
Figure 6: Rehabilitation Outcome vs Age Class 14
Figure 7: Rehabilitation Outcome vs Lymphocyte Concentration 15
Figure 8: Rehabilitation Outcome vs Total Protein Concentration 15
Figure 9: Bloodwork Outliers 16
Figure 10: Rehabilitation Outcome vs Time Spent in the Field Before Collection 28
Figure 11: Rehabilitation Outcome vs Findings of Human Interaction 29
Figure 12: Rehabilitation Outcome vs Weight:Length Ratio 30
LIST OF TABLES
Table 1: Bloodwork Sample Size 8
Table 2: Bloodwork P-Values 31
viINTRODUCTION
Marine mammals, and pinnipeds in particular, can be important indicators of
coastal ecosystem health. Marine mammals live in coastal waters, are exposed to
environmental stressors, and eat similar food to humans (Bossart, 2010). Climate change,
pollution, and other factors that affect marine mammals may therefore also impact
humans. For example, microplastic fragments and fibers have been found in many marine
mammal species and humans, with the primary route of exposure being through ingestion
(Meaza et al. 2021). Learning about the problems coastal species, including humans, are
facing, gives us the power to lessen the impact.
In Maine, where threats to coastal ecosystem health are mainly caused by
increased warming trends (Morrison et al. 2012), the most common pinniped species is
the harbor seal. These warming waters may lead to shifts in species’ habitat ranges and
the introduction of mid-Atlantic species to the Gulf of Maine (Kleisner et al. 2017).
Increased competition for resources is expected to be seen for many species, including
harbor seals.
Harbor seals are small phocids that are found on both coasts of the United States,
Europe, and Asia (Harbor Seal, NOAA Fisheries). On the east coast of the US their
habitat spans from the Arctic to New York. In the Gulf of Maine, pups are usually born
from late April through June (Harbor Seal, NOAA Fisheries). The average time of
weaning is about a month after birth (Cottrel et al. 2006), and then pups are responsible
for foraging on their own.
1Following historical depletion, harbor seal populations in Maine increased rapidly
from the 1970s through the late 1990s as a result of the Marine Mammal Protection Act
(MMPA), federal legislation that prohibits the taking of any marine mammal (Gilbert et
al. 2005). Take is defined as “to harass, harm, pursue, hunt, shoot, wound, kill, trap,
capture or collect, or to attempt to engage in any such conduct” (United States, National
Oceanic and Atmospheric Administration, 2005). Since 2001, the population growth rate
of harbor seals in this region has declined or potentially reversed (Waring et al. 2015).
This could be a result of competition with the more recently increasing gray seal
population, or an indicator that this harbor seal population has reached carrying capacity
(Johnston et al. 2015).
In 1992, an amendment was made to the MMPA that instituted the Marine
Mammal Health and Stranding Response Program. A national network of stranding
organizations provides one of the primary ways we collect information about the health
of marine mammal populations, and thus about our coastal ecosystem health. There are
currently two stranding organizations in Maine, Marine Mammals of Maine (MMoME)
and Allied Whale (AW). MMoME responds to stranded marine mammals in the southern
half of Maine, while AW is responsible for the northeastern half. Beachgoers and
members of the community call a state hotline to report a stranded animal. Volunteers or
staff will then go respond to the stranded animal and assess what further care will be
needed.
Beyond stranding response, MMoME also has the capacity to provide both short-
term and long-term rehabilitation care to stranded pinnipeds with the ultimate goal of
releasing healthy animals back into the wild. Short-term patients can be housed at
2MMoME for up to four days and then transferred to another rehabilitation facility. Long-
term patients can spend weeks to months in rehabilitation at MMoME. Rehabilitation is
important because it can help steady or increase the population of threatened or
endangered species, improve the livelihood and lifespan of sick and injured animals, and
provide valuable data that can be used to study a population (Moore et al. 2007).
However, rehabilitation is costly, and any information that can help rehab organizations
predict which animals are most likely to be successful throughout the rehab process is
helpful in effectively determining how to spend critical resources. In regions that provide
rehab care to multiple types of marine animals, it has been shown that phocids are more
likely to be released than cetaceans and sea turtles (Gallini et al. 2021).
Previous studies have evaluated the probability of harbor seal rehabilitation
success against variables that changed throughout rehabilitation, for example bloodwork
and mass (Morgan et al. 2009, Salazar-Casals et al. 2020). Others have compared
bloodwork of seals in rehabilitation to healthy, wild seals, attempting to create reference
values (Lander at al. 2003, Trumble and Castellini, 2006). In this analysis, I plan to
investigate if the probability of rehabilitation success can be determined at admit. My
analysis will focus on harbor seal pups, which are the most commonly stranded type of
pinniped in Maine, and the most vulnerable age class (Ashley et al. 2020).
For all seals that are rehabilitated at MMoME, data are collected at admit and
throughout rehabilitation to determine health status and a treatment plan. Before a seal is
admitted to rehabilitation, data such as date, location, age class, sex, body condition,
behavior, signs of human interaction, injury, illness, and other observational notes are
collected at the stranding site. Data such as weight, length, blood chemistry and
3hematology, body condition, behavior, medication, and feeding are taken at admit and
throughout rehabilitation. This study will analyze how the day of the year a pup is first
observed stranded, time spent in the field before collection, findings of human
interaction, age class, weight:length ratio at admit, blood chemistry and hematology at
admit, whether or not an individual was transferred from MMoME, and the time spent in
rehabilitation is related to rehabilitation outcome.
4METHODS
Stranding Data
I analyzed data from dependent (N=72) and weaned (N=10) harbor seal pups that
stranded in Maine and were originally admitted to rehabilitation at Marine Mammals of
Maine (MMoME) from 2016 to 2019. The majority of pups in Maine strand during the
late spring and summer. Because a previous study found that bloodwork differs between
seasons due to changes in foraging (Trumble et al. 2006), for this study, only pups that
stranded between May and September were included.
For each seal, the initial observation date, findings of human interaction, date
admitted to rehabilitation, straight length at admit, weight at admit, transfer facility,
rehabilitation outcome, date died, and date released were extracted from the US Marine
Mammal Health and Stranding Response Program’s National Stranding Database. Blood
chemistry and hematology data, as well as data on age class (dependent vs weaned pup),
were further provided by MMoME. Because a previous study reported that the difference
in bloodwork between male and female pups was not significantly related to survival
(Witte et al. 2014), I did not consider sex in this study.
Data Analysis
To assess the role of multiple potential measures of marine mammal health that
are evaluated at admit in determining rehabilitation success, I compared variation in the
following explanatory variables to rehabilitation outcome using independent logistic
regression analyses for continuous variables and contingency analyses for binary
variables in the program JMP. Rehabilitation outcome was evaluated as a binary variable;
5the “released” outcome was denoted as “1” and the “died” outcome was denoted as “0”.
Prior to each analysis, I identified outliers in all non-binary independent variables using a
box and whisker plot and removed these outliers from the analysis. I also noted how
many outliers were identified for each blood parameter and compared the number of
outliers between rehab outcome groups.
Explanatory Variables (N, sample size after outliers were removed)
• Day of year first observed (N = 98). The date that each seal was first observed in
the field was converted to a day of the year (1 through 365) using the formula
(month/day/year)-DATE(YEAR(month/day/year),1,1)+1 in Excel. This analysis
was done with all individuals and then, to account for the different time spans
dependent and weaned pups are present in one season, by age class.
• Time observed in the field before collection (N = 100). The observation date was
subtracted from the date admitted to rehabilitation to analyze the amount of time
they were observed in the field before being collected.
• Human interaction (N = 85). Findings of human interaction were denoted as “1”
if Yes and “0” if No. “Cannot be determined” cases were excluded. Human
interaction is direct or indirect contact from a human to a seal, including boat
collision, gunshot, fishery interaction (i.e. entanglement), unauthorized relocation
or collection, physical touch, or harassment by humans or dogs.
• Age class (N = 95). Dependent pups were denoted as “0” and weaned pups were
denoted as “1”. Harbor seal pups are nursed by their mothers for 4-6 weeks, after
this stage has ended, they are known as weaned pups. At MMoME, both
dependent and weaned pups were not with their mothers.
6• Weight:Length ratio (N = 105). Weight and straight length at admit were used to
find the weight:length ratio at admit for each seal. The weight:length ratio is often
used throughout the rehabilitation process as a measure of general body condition.
• Bloodwork. I analyzed 43 blood parameters (Table 1) that are measured in-house
at MMoME using a LaserCycte and CatalystOne. For each blood parameter,
outliers were compared by whether they belonged to a seal who was released or
one that died. Bloodwork is taken throughout the rehabilitation process to assess
health and create a treatment plan for each patient.
7Table 1. Blood parameters and sample size.
Parameter Sample Size
Red Blood Cells (RBC) 107
Hematocrit 106
Hemoglobin 101
Mean Corpuscular Volume (MCV) 107
Mean Corpuscular Hemoglobin (MCH) 99
Mean Corpuscular Hemoglobin Concentration 69
(MCHC)
Red Cell Distribution Width (RDW) 103
% Reticulocytes 95
Reticulocytes 97
White Blood Cells (WBC) 105
% Neutrophils 105
% Lymphocytes 107
% Monocytes 110
% Eosinophils 105
% Basophils 106
Neutrophils 105
Lymphocytes 103
Monocytes 107
Eosinophils 103
Basophils 106
Platelets 108
Platelet Distribution Width (PDW) 103
Mean Platelet Volume (MPV) 104
Plateletcrit 102
Glucose 100
Creatinine 101
Blood Urea Nitrogen (BUN) 102
Blood Urea Nitrogen:Creatinine Ratio 96
Phosphorus (P) 91
Calcium (Ca) 97
Sodium (Na) 97
Potassium (K) 102
Sodium:Potassium Ratio 102
Chlorine (Cl) 99
Total Protein 102
Albumin 107
Globulin 105
Albumin:Globulin Ratio 106
Alanine Aminotransferase (ALT) 104
Alkaline Phosphatase (ALKP) 106
Gamma-Glutamyl Transpeptidase (GGT) 88
Total Bilirubin 90
Cholesterol 95
8• Transferred to other rehabilitation facility (N = 98). If the seal was transferred to
another facility (Mystic Aquarium or National Marine Life Center) besides
MMoME during the rehabilitation process that was denoted as “1”, and if not, that
was denoted at “0”. Only seals that survived long enough (4 days) to be
considered long-term patients were included in this analysis.
• Time spent in rehabilitation (N = 72). I converted the date each seal was admitted
to rehabilitation and either the day they died or were released to a day of the year
and subtracted the former from the latter to assess the time spent in rehabilitation.
9RESULTS
The day of the year an individual was first observed, the time they were observed
in the field before collection, and findings of human interaction are all variables that
describe what occurred in the field. Of these variables, only the day of the year first
observed was significantly correlated with rehabilitation outcome (p=0.04747,
R2=0.0308), with pups stranding later in the year having a high probability of
rehabilitation success (Figure 1). Although not statistically significant, dependent pups
had a greater likelihood of being released if they strand later in the year (p=0.2217) (Fig.
2). Weaned pups that strand earlier in the year were significantly more likely to be
released (p1.00
Rehabilitation Outcome 0.75
1
0.50
0.25
0
0.00
120 130 140 150 160 170 180 190 200
Day of Year
Figure 1. Rehabilitation outcome (0=died, 1=released) as a function of the day of the year all harbor seal
pups were first observed stranded. Day 120 is April 30th and day 200 is July 19th. Each point represents the
predicted probability of being released if a seal stranded on that day of the year. The blue line represents
the logistic curve.
Figure 2. Rehabilitation outcome (0=died, 1=released) as a function of the day of the year only dependent
harbor seal pups were first observed stranded. Day 120 is April 30th and day 200 is July 19th. Each point
represents the predicted probability of being released if a seal stranded on that day of the year. The blue
line represents the logistic curve.
11Figure 3. Rehabilitation outcome (0=died, 1=released) as a function of the day of the year only weaned
harbor seal pus were first observed stranded. Day 120 is April 30th and day 200 is July 19th. Each point
represents the predicted probability of being released if a seal stranded on that day of the year. The blue
line represents the logistic curve.
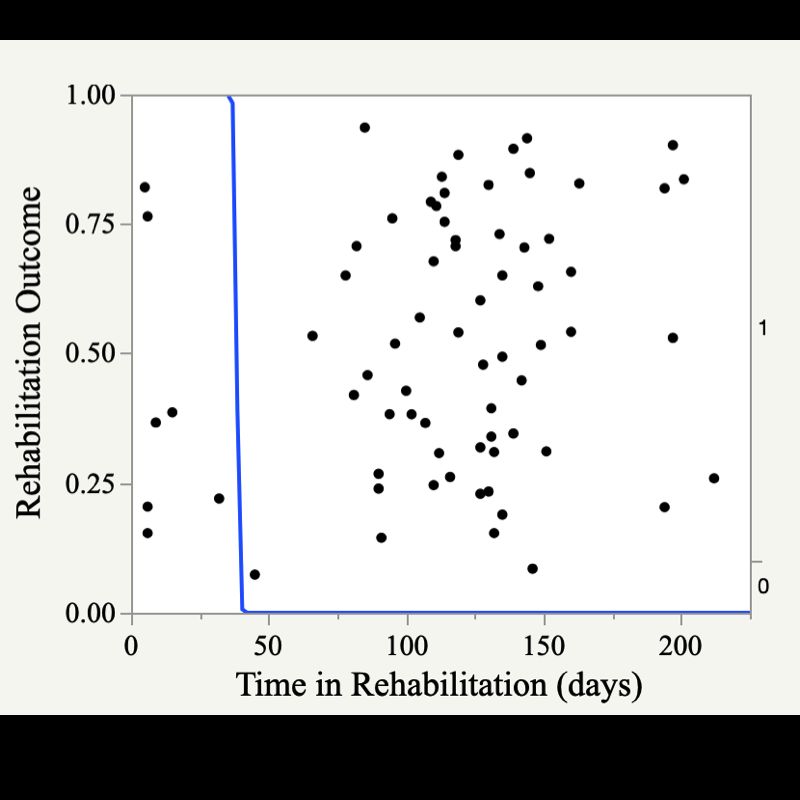
Time spent in rehabilitation and whether or not an individual was transferred from
MMoME to another facility are variables that pertain to the rehabilitation process. Both
time spent in rehabilitation (pFigure 4. Rehabilitation outcome (0=died, 1=released) as a function of days spent in rehabilitation, from
admit to release or death. Each point represents the predicted probability of being released if a pup spent
that many days in rehabilitation. The blue line represents the logistic curve.
Figure 5. Rehabilitation outcome (0=died, 1=released) as a function of whether or not an individual was
transferred (0=not transferred, 1=transferred). The size of each box corresponds to the proportion of
individuals in that category.
Age class, weight:length ratio, and bloodwork are variables related to
physiological characteristics of the seals in this study. Age class (p=0.0126, R2=0.0503),
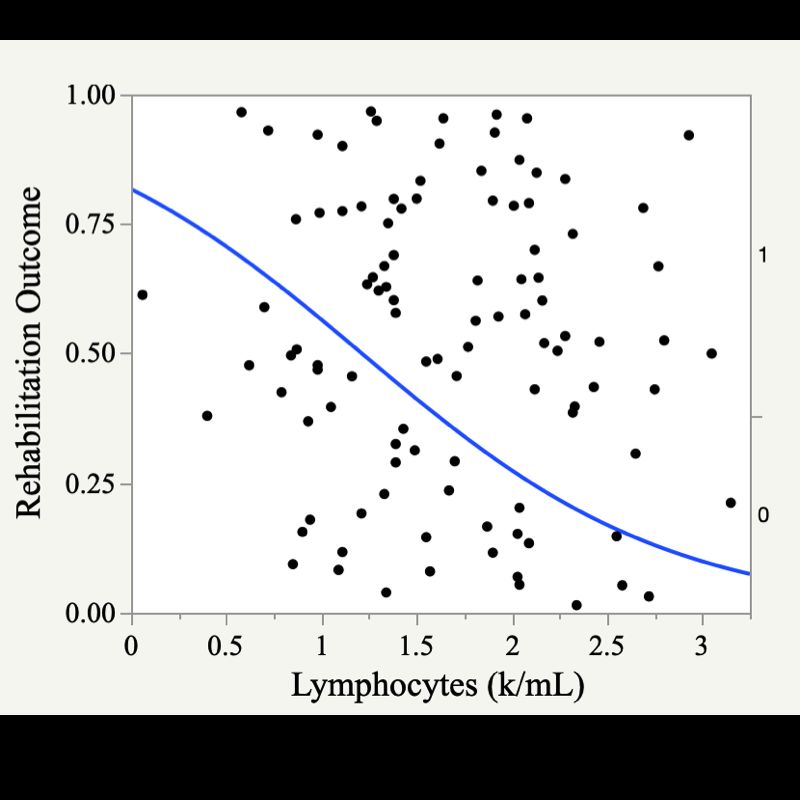
13lymphocytes (p
Figure 7. Rehabilitation outcome (0=died, 1=released) as a function of lymphocyte concentration (k/mL).
Each point represents the predicted probability of being released if a pup has that concentration of
lymphocytes. The blue line represents the logistic curve.
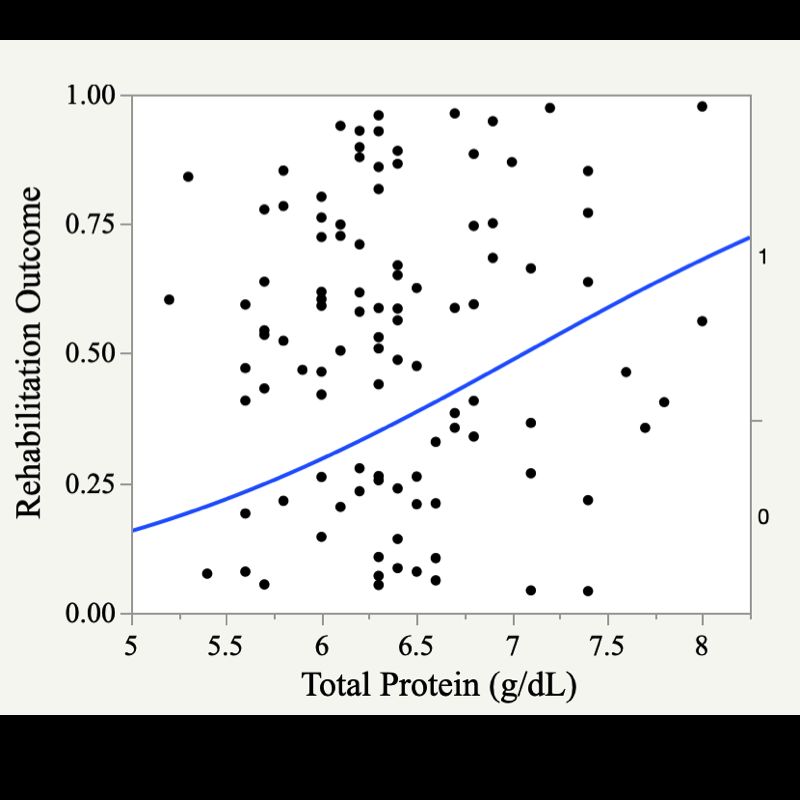
Figure 8. Rehabilitation outcome (0=died, 1=released) as a function of total protein concentration (g/dL).
Each point represents the predicted probability of being released if a pup has that concentration of total
protein. The blue line represents the logistic curve.
15Albumin, the albumin:globulin ratio, % monocytes, and Ca did not have outliers.
Blood parameters where extreme values were more often observed in animals that died
were % reticulocytes, basophils, hematocrit, MPV, Na/K, neutrophils, platelets,
plateletcrit, RBC, reticulocytes, and WBC (Fig. 9). Blood parameters where extreme
values were more often observed in animals that were released were % eosinophils, %
lymphocytes, % neutrophils, ALT, BUN, cholesterol, Cl, creatinine, GGT, globulin,
glucose, hemoglobin, K, lymphocytes, MCH, MCHC, monocytes, Na, P, and total
bilirubin (Fig. 9). Blood parameters that had a similar number of outliers that belonged to
pups that died and were released were the BUN:creatinine ratio, % basophils,
eosinophils, MCV, osmolality, PDW, RDW, and total protein (Fig. 9).
15.0
Released
Died
12.5
10.0
# of Outliers
7.5
5.0
2.5
0.0
Platelets
% Basophils
% Eosinophils
% Lymphocytes
% Monocytes
% Neutrophils
% Reticulocytes
Albumin
Albumin/Globulin
ALKP
ALT
Basophils
BUN
BUN/Creatinine
Ca
Cholesterol
Cl
Creatinine
Eosinophils
GGT
Globulin
Glucose
Hematocrit
Hemoglobin
K
Lymphocytes
MCH
MCHC
MCV
Monocytes
MPV
Na
Na/K
Neutrophils
Osmolality
P
PDW
Plateletcrit
RBC
RDW
Reticulocytes
Total Bilirubin
Total Protein
WBC
Bloodwork Parameter
Figure 9. Stacked bar chart comparing the number of outliers between pups that were released and those
that died for each blood parameter.
16DISCUSSION
The objectives of this study were to compare certain health measures and
rehabilitation variables that are taken at admit to determine their relationship with
rehabilitation success. The ultimate goal was to determine if rehabilitation outcome can
be predicted at admit. The variables that were significantly correlated with rehabilitation
outcome were the day of the year first observed, whether or not an individual was
transferred from MMoME, time spent in rehabilitation, and age class. Two bloodwork
parameters were significantly correlated with rehabilitation success: lymphocytes and
total protein. Time observed in the field before collection, findings of human interaction,
and weight:length ratio were not significantly correlated with rehabilitation outcome.
Pups that were observed stranded later in the summer were found to have an
increased probability of rehabilitation success (Fig. 1). The trend in this analysis mainly
came from the dependent pups that were included. Dependent pups that stranded later on
in the year were more likely to be released (Fig. 2). This is consistent with a study on harbor
seal pups in the German North Sea. They found that if a pup was going to die, they were
most likely to die within ten to twenty days after their birth (Witte et al. 2014). Pups that
strand earlier in the season are usually younger and can even be premature. Weaned pups
were significantly more likely to be released if they stranded earlier in the year (Fig. 3),
however, the sample size for this analysis was very small, being only 10 individuals.
Weaned pups may have been more likely to be released if they stranded earlier in the year
because they were still young and had not been in the wild, and exposed to environmental
threats, for as long. This explanation is also in agreement with the age class analysis that
17was done in this study, which suggested that dependent pups had a higher likelihood of
rehabilitation success.
I found that dependent pups were more likely to be released than weaned pups.
Pups are weaned after an average of 32 days (Cottrel et al. 2006), so pups that strand later
on in the season are usually weaned. However, this analysis found that weaned pups have
a greater probability of dying in rehabilitation. Studies from San Juan County, WA and the
Netherlands found the main cause of death for dependent harbor seal pups was malnutrition
and emaciation (Ashley et al. 2020, Osinga et al. 2012). Weaned pups’ main cause of death
was malnutrition, infection, or trauma (Ashley et al. 2020). The treatment of pups suffering
from malnutrition and emaciation may be easier than those with infection and trauma
because the former mainly require food and rehydration whereas the latter require more
intense medical treatment. Weaned pups may also have been exposed to more
environmental threats during their longer lifetimes in the wild, which is why they are more
prone to illness and injury.
Similar to many other studies that have reported that bloodwork at admit is not a
good predictor of rehabilitation outcome (Frouin et al. 2013, Witte et al. 2014, Greig et
al. 2010, Marrie and Gaydos, 2007), I found little to no association between most
bloodwork parameters and rehabilitation success. Bloodwork values at admit may
instead reflect life history or cause of stranding; for example, Morgan et al. (2009) found
that dependent and weaned pups had different bloodwork at admit. The only exceptions
in my analysis were lymphocytes and total protein, which had a statistically significant
relationship with rehabilitation outcome.
18Pups that had a higher total protein concentration were more likely to be released
(Fig. 8). The range of total protein from my data (5.2-8 g/dL) was consistent with the
reference values established by Greig et al. (2010) (5.2-8.9 g/dL) and Trumble and
Castellini (2002) (5.0-8.2 g/dL). Higher than normal total protein is an indicator of
dehydration and chronic illness, where lower than normal total protein is an indicator of
malnutrition and liver damage (Bossart et al. 2001). A study of rehabilitated harbor seal
pups from Vancouver Aquarium found that emaciated pups had lower total protein
concentrations than those that were moderately malnourished (Frouin et al. 2013). Pups
that are dehydrated may be easier to treat than those that have an extreme nutrition
deficiency and/or liver damage.
Pups with a lower lymphocyte concentration were more likely to be released (Fig.
7). A comparison between lymphocyte concentration in this study and previous studies
cannot be made because the reference values established for lymphocytes were not in the
same units. Lymphocytes are a part of the immune system, involved in antigen response,
and will increase due to stress and infection (Latimer, 2011). Pups with a higher
lymphocyte concentration may have had a more severe response to stranding, and/or
were fighting an infection around the same time. Lymphocyte count has also been found
to decrease with age (Latimer, 2011). The animals that did have a lower lymphocyte
concentration may have been older and more mature.
The bloodwork outliers analysis had a small sample size, so it is difficult to draw
conclusions, however there may be value in considering the trends observed. For sodium,
all of the extreme values were higher than the average, and six out of seven of those pups
19were released. High sodium levels are a sign of dehydration, and early detection of this
may increase the probability of a successful rehabilitation (Frouin et al. 2013).
For two of the variables tested in this study, whether or not an individual was
transferred from MMoME to another facility and time spent in rehabilitation, there is
very little previous research indicating a gap in knowledge. Pups are transferred from
MMoME to NMLC or the Mystic Aquarium when MMoME’s rehabilitation facility is
full. When compared to rehabilitation outcome, pups that were transferred were more
likely to be released (Fig. 5). I am not sure how MMoME chooses which seals are
transferred, but I would guess that they may select those that are healthier and who they
think will survive the trip to another facility. The drive from MMoME to NMLC or
Mystic is at least three to four hours, so the seals have to be stable enough to be able to
survive the car ride without extra care.
Pups that spent around 45 days or less in rehabilitation were found to be more
likely to have a successful rehabilitation resulting in release (Fig. 4). With the average
weaning time for harbor seal pups being 32 days (Cottrel et al. 2006), I suspect that the
majority of these pups were admitted as dependent pups who were malnourished or
dehydrated. These pups would have needed to gain enough weight and mature enough so
that they are able to survive in the wild on their own. If there were little to no other illness
or injury present, their treatment plan would be relatively simple, and the animals should
be able to be released soon after they are weaned. It would make sense that those
individuals that enter rehab due to a serious injury or illness would take longer to recover
and have lower likelihood of success.
20The weight:length ratio at admit was not significantly correlated with
rehabilitation outcome. This contradicts previous studies that found a higher
weight:length ratio to be a good predictor of rehabilitation success (Witte et al. 2014,
Marrie and Gaydos, 2007). My data showed the opposite trend, though not significant
(Appendix 1). Other studies have also reported that high body mass at release is
important in predicting survival in the wild (Greig et al. 2019, Frouin et al. 2013). The
extra body mass may act as an important energy store during the time that rehabilitated
pups need to learn how to forage for food in the wild (Greig et al. 2019). In this study,
pups that were more likely to be released were dependent pups. One of this group’s main
causes of stranding is emaciation. If it is true that the dependent pups that were emaciated
were more likely to survive, that would explain why the pups with a lower weight:length
ratio had a higher likelihood of rehabilitation success. The results of this analysis may
also not have been found significant because a majority of the pups in this study were
dependent pups and there may have been a small range of weight:length ratios.
Evidence of human interaction was also not found to be a good predictor of
rehabilitation success. The types of human interaction included in this study were
harassment, touching/picking up, boat collisions, gunshots, or a fishery interaction such
as entanglement. All of these behaviors are examples of direct interaction between
humans and protected wildlife. It would be interesting to see how indirect human
interaction, such as pollution and contamination, affects stranded harbor seals in the
northwest Atlantic. A study on Pacific harbor seals found that weaned pups that were
admitted to rehabilitation had similar blood contaminant levels to adult harbor seals, and
weanlings with higher contaminant levels were less likely to have a successful
21rehabilitation (Greig, 2011). These high contaminant levels could be another reason why
weaned pups had a lower likelihood of release than dependent pups.
There were a few limitations to this study. One being that MMoME’s definition of
a pup was different from the definition from the US Marine Mammal Health and
Stranding Response Program’s National Stranding Database. While MMoME separated
dependent pups and weanlings, the National Stranding Database grouped them together
as one age class. I also noted some inconsistencies in the age class designations, with a
few pups listed as dependent despite stranding later in the season when most pups were
categorized as weanlings. This made it difficult to determine whether the analyses should
have been further separated by age class. In addition to this, not all of the data collected
were consistent for all individuals in the sample population, resulting in differing sample
sizes between the analyses. If I were to perform this study again, I would like to confirm
age class designations with MMoME and perform each analysis by age class, separating
dependent and weaned pups.
There were also other research questions I became interested in after examining
the results of this study. First, I would like to know how causes of stranding, such as
emaciation, illness, and injury affect rehabilitation success. Changes in bloodwork,
weight:length ratio, medication, and feeding would also be interesting to assess in
relation to outcome. Finally, I would like to research levels of contamination and
pollution that harbor seals are exposed to at admit and how that impacts rehabilitation
success.
The findings of this study can be useful for rehabilitation organizations to
consider when there is limited space or resources for patients. Dependent pups and those
22that strand earlier in the year are most likely to have a successful rehabilitation. It would
be important to verify that pups that are emaciated and malnourished at admit are more
likely to be released than those that are admitted with a serious illness or injury so that
these results can be used to prioritize certain patients if needed. This study also
reenforced the idea that harbor seals of different age classes are physiologically different
and that should be taken into account. From an ecological perspective, pups that are
admitted to rehabilitation after spending more time in the wild are less likely to be
released. This indicates that there is something in the wild that is causing more serious
health problems for harbor seals. It is important that we research what is causing these
strandings that ultimately lead to death, because what could be harming seals will most
likely have negative effects on the rest of the coastal ecosystem.
23REFERENCES
Ashley, E. A., Olson, J. K., Adler, T. E., Raverty, S., Anderson, E. M., Jeffries, S.,
Gaydos, J. K. (2020). Causes of mortality in a harbor seal (Phoca vitulina)
population at equilibrium. Front. Mar. Sci. 7:319. doi: 10.3389/fmars.2020.00319
Bossart, G. D., Reidarson, T. H., Dierauf, L. A., Duffield, D. A. (2001). Clinical
Pathology. In: Dierauf, L. A., and F. M. D. Guland (eds.). Marine Mammal
Medicine, 2nd ed. CRC Press Inc., Boca Raton, Florida. Pp. 383
Bossart, G. D. (2011). Marine mammals as sentinel species for oceans and human health.
Vet Pathol. 48(3):676-90. doi: 10.1177/0300985810388525.
Cottrell, P. E., Jeffries, S., Beck, B. and Ross, P. S. (2002). Growth and development in
free‐ranging harbor seal (Phoca vitulina) pups from southern British Columbia,
Canada. Marine Mammal Science. 18: 721-733. https://doi-org.wv-o-ursus-
proxy02.ursus.maine.edu/10.1111/j.1748-7692.2002.tb01069.x
Frouin, H., Haulena, M., Akhurst, L. M. F., Raverty, S. A., Ross, P. S. (2013). Immune
status and function in harbor seal pups during the course of rehabilitation.
Veterinary Immunology and Immunopathology. 155: 98-109.
https://doi.org/10.1016/j.vetimm.2013.06.011
Gallini, S.H., Di Girolamo, N., Hann, E., Paluch, H., DiGeronimo, P. M.
(2012). Outcomes of 4819 cases of marine animals presented to a wildlife
rehabilitation center in New Jersey, USA (1976–2016). Sci Rep. 11: 2182.
https://doi.org/10.1038/s41598-021-81634-5
Gilbert, J. R., Waring, G. T., Wynne, K. M., Guldager, N. (2005). Changes in abundance
of harbor seals in Maine, 1981-2001. Society for Marine Mammology. 21(3): 519-
535.
Greig, D. J., Gulland, F. M. D., Rios, C. A., Hall, A. J. (2010). Hematology and serum
chemistry of stranded harbor seals in central California: Reference intervals,
predictors of survival, and parameters affecting blood variables. J Wildlife Dis.
46: 1172-1184. doi: 10.7589/0090-3558-46.4.1172.
Greig, D. J. (2011). Health, disease, mortality and survival in wild and rehabilitated
harbor seals (phoca vitulina) in san francisco bay and along the central california
coast. ProQuest Dissertations & Theses Global.
Greig, D. J., Gulland, F. M. D., Harvey, J. T., Lonergan, M. and Hall, A. J. (2019).
Harbor seal pup dispersal and individual morphology, hematology, and
24contaminant factors affecting survival. Mar. Mam. Sci. 35: 187-209. https://doi-
org.wv-o-ursus-proxy02.ursus.maine.edu/10.1111/mms.12541
Harbor Seal. (n.d.). Retrieved March 22, 2021, from NOAA Fisheries: Harbor Seal |
NOAA Fisheries
Johnston, D.W., Frungillo, J., Smith, A., Moore, K., Sharp, B., Schuh, J., et al. (2015).
Trends in Stranding and By-Catch Rates of Gray and Harbor Seals along the
Northeastern Coast of the United States: Evidence of Divergence in the
Abundance of Two Sympatric Phocid Species? PLoS ONE. 10(7): e0131660.
doi:10.1371/journal.pone.0131660
Kleisner, K. M., Fogarty, M. J., McGee, S., Hare, J. A., Moret, S., Perretti, C. T., Saba,
V. S. (2017). Marine species distribution shifts on the U.S. Northeast Continental
Shelf under continued ocean warming. Progress in Oceanography. 153: 24-36.
https://doi.org/10.1016/j.pocean.2017.04.001
Lander, M. E., Harvey, J. T., Gulland, F. M. D. (2003). Hematology and serum chemistry
comparisons between free-ranging and rehabilitated harbor seal (Phoca vitulina
richardsi) pups. Journal of Wildlife Diseases. 39(3): 600-609.
https://doi.org/10.7589/0090-3558-39.3.600
Latimer, K. S. (2011) Duncan & Prasse’s Veterinary Laboratory Medicine: Clinical
Pathology, Fifth Edition. John Wiley & Son’s, Inc. West Sussex, UK. Pp. 77-78.
Marrie, K. and Gaydos, J. (2007). Determining risk factors associated with mortality of
stranded harbor seals (Phoca vitulina) during rehabilitation. Proc Intern Assoc
Aqua Ani Med. 38: 144.
Meaza I., Toyoda J. H., Wise Sr., J. P. (2021). Microplastics in sea turtles, marine
mammals and humans: a one environmental health perspective. Front. Environ.
Sci. 8:575614. doi: 10.3389/fenvs.2020.575614
Moore, M., Early, G., Touhey, K., Barco, S., Gulland, F., Wells, R. (2007). Rehabilitation and
release of marine mammals in the United States: risks and benefits. Society for Marine
Mammalogy. 23(4): 731-750. doi:10.1111/j.1748-7692.2007.00146.x
Morgan, L., Jakush, J., Simpson, A., Norman, M., Pabst, D., & Simmons, S. (2009).
Evaluation of hematologic and biochemical values for convalescing seals from the
coast of Maine. Journal of Zoo and Wildlife Medicine. 40(3): 421-429. Retrieved
March 22, 2021, from http://www.jstor.org/stable/27751715
Morrison, J. R., Pettigrew, N. R., O'Donnell, J., Runge, J. A. (2012). Rapid detection of
climate scale environmental variability in the Gulf of Maine. Oceans 2012. pp. 1-
5. doi: 10.1109/OCEANS.2012.6405064
25Osinga, N., Shahi Ferdous, M. M., Morick, D., Garcia Hartmann, M., Ulloa, J. A.,
Vedder, L., Udo de Haes, H. A., Brakefield, P. M., Osterhaus, A. D. M. E.,
Kuiken, T. (2012). Patterns of stranding and mortality in common seals (Phoca
vitulina) and grey seals (Halichoerus grypus) in the Netherlands between 1979
and 2008. Journal of Comparative Pathology. 147: 550-565.
https://doi.org/10.1016/j.jcpa.2012.04.001
Roletto, J. (1993). Hematology and Serum Chemistry Values for Clinically Healthy and Sick
Pinnipeds. Journal of Zoo and Wildlife Medicine. 24(2): 145-157. Retrieved March
22, 2021, from http://www.jstor.org/stable/20095256
Salazar-Casals, A., Arriba-Garcia, A., Mignucci-Giannoni, A. A., O’Connor, J., Rubio-Garcia,
A. (2020). Hematology and serum biochemistry of harbor seal (Phoca vitulina) pups
after rehabilitation in the Netherlands. Journal of Zoo and Wildlife Medicine. 50(4):
1021-1025. https://doi.org/10.1638/2018-0098
Trumble, S. and Castellini, M. (2002). Blood chemistry, hematology, and morphology of wild
harbor seal pups in Alaska. The Journal of Wildlife Management. 66(4): 1197-1207.
doi:10.2307/3802953
Trumble, S.J., Castellini, M.A., Mau, T.L., Castellini, J.M. (2006). Dietary and seasonal
influences on blood chemistry and hematology in captive harbor seals. Marine
Mammal Science. 22(1):104-123.
United States, National Oceanic and Atmospheric Administration. (2005). NOAA
fisheries glossary. National Marine Fisheries Service (NMFS).
Waring, G. T., DiGiovanni Jr., R. A., Josephson, E., Wood, S., Gilbert, J. R. (2015). 2012
Population estimate for the harbor seal (Phoca vituline concolor) in New England
water. NOAA Technical Memorandum NMFS-NE.
Witte, K.A., Driver, J., Rosenberger, T., Adler, S., Siebert, U. (2014). Analysis of blood
gases, serum fat and serum protein: a new approach to estimate survival chances
of stranded harbor seal (Phoca vitulina) pups from the German North Sea. Acta
Vet Scand. 56: 10. https://doi.org/10.1186/1751-0147-56-10
26APPENDICES
27APPENDIX A: ADDITIONAL FIGURES
1.00
Rehabilitation Outcome
0.75
1
0.50
0.25
0
0.00
0 1 2 3 4 5
Time in the Field
Figure 10. Rehabilitation outcome (0=died, 1=released) as a function of the amount of days monitored in
the field before being transported to MMoME. Each point represents the predicted probability of being
released if a pup spent that amount of time in the field before collection. The blue line represents the
logistic curve.
281.00
Rehabilitation Outcome
0.75
1
0.50
0.25
0
0.00
0 1
Human Interaction
Figure 11. Rehabilitation outcome (0=died, 1=released) as a function of findings of human interaction
(0=no, 1=yes). The size of each box corresponds to the proportion of individuals in that category.
291.00
Rehabilitation Outcome
0.75
1
0.50
0.25
0
0.00
0.08 0.09 0.1 0.11 0.12 0.13 0.14 0.15 0.16 0.17
Weight:Length
Figure 12. Rehabilitation outcome (0=died, 1=released) as a function of weight:length ratio at admit.
Weight was measure in kilograms and straight length was measured in centimeters. Each point represents
the predicted probability of being released if a pup had that weight:length ratio at admit. The blue line
represents the logistic curve.
30APPENDIX B: ADDITIONAL TABLES
Table 2. P-values of logistic regression analyses for each bloodwork parameter compared to rehabilitation
outcome.
Parameter P-Value
RBC 0.4551
Hematocrit 0.3483
Hemoglobin 0.5281
MCV 0.3562
MCH 0.2966
MCHC 0.0949
RDW 0.975
% Reticulocytes 0.8782
Reticulocytes 0.5224
WBC 0.3518
% Neutrophils 0.3456
% Lymphocytes 0.264
% Monocytes 0.4001
% Eosinophils 0.5925
% Basophils 0.2306
Neutrophils 0.4195
Lymphocytes 0.0004
Monocytes 0.3808
Eosinophils 0.5002
Basophils 0.3735
Platelets 0.1296
PDW 0.7964
MPV 0.0599
Plateletcrit 0.4969
Glucose 0.893
Creatinine 0.7208
BUN 0.6419
Blood Urea Nitrogen:Creatinine Ratio 0.7281
Phosphorus 0.994
31Table 2. (continued)
Calcium 0.7379
Sodium 0.762
Potassium 0.5689
Sodium:Potassium Ratio 0.5508
Chlorine 0.8917
Total Protein 0.0238
Albumin 0.7002
Globulin 0.1083
Albumin:Globulin Ratio 0.8684
ALT 0.2581
ALKP 0.5669
GGT 0.3987
Total Bilirubin 0.5821
Cholesterol 0.6225
Osmolality 0.7824
32AUTHOR’S BIOGRAPHY
Shannon R. Brown was born on August 30, 1999 in Melrose, Massachusetts and
graduated from Medford High School in 2017. Shannon is expecting to graduate from the
University of Maine in 2021, majoring in marine science with a concentration in marine
biology. During her time at UMaine, she was a student research assistant in the Cammen
Lab and a member of Dance Club, Hip Hop Club, and UMaine Undergraduate Women in
STEMM. In the summer of 2019, Shannon interned at the National Marine Life Center
and in the fall of 2020, she was an intern at the New England Aquarium. After
graduation, Shannon hopes to pursue a career in marine mammal health and conservation.
33You can also read