MICRORNA-5572 IS A NOVEL MICRORNA-REGULATING SLC30A3 IN SPORADIC AMYOTROPHIC LATERAL SCLEROSIS - MDPI
←
→
Page content transcription
If your browser does not render page correctly, please read the page content below
International Journal of
            Molecular Sciences

Article
MicroRNA-5572 Is a Novel MicroRNA-Regulating
SLC30A3 in Sporadic Amyotrophic Lateral Sclerosis
Hisaka Kurita 1 , Saori Yabe 1 , Tomoyuki Ueda 1 , Masatoshi Inden 1 , Akiyoshi Kakita 2
and Isao Hozumi 1, *
 1    Laboratory of Medical Therapeutics and Molecular Therapeutics, Gifu Pharmaceutical University,
      1-25-4 Daigaku-nishi Gifu city, Gifu 501-1196, Japan; kurita@gifu-pu.ac.jp (H.K.); 155054@gifu-pu.ac.jp (S.Y.);
      126014@gifu-pu.ac.jp (T.U.); inden@gifu-pu.ac.jp (M.I.)
 2    Department of Pathology, Brain Research Institute, Niigata University, 1 Asahimachi, Chuo-ku,
      Niigata 951-8585, Japan; kakita@bri.niigata-u.ac.jp
 *    Correspondence: hozumi@gifu-pu.ac.jp; Tel.: +81-58-230-8100 (ext. 3557)

 Received: 28 May 2020; Accepted: 22 June 2020; Published: 24 June 2020

 Abstract: Amyotrophic lateral sclerosis (ALS) is a progressive degenerative disease caused by the
 loss of motor neurons. Although the pathogenesis of sporadic ALS (sALS) remains unclear, it has
 recently been suggested that disorders of microRNA (miRNA) may be involved in neurodegenerative
 conditions. The purpose of this study was to investigate miRNA levels in sALS and the target
 genes of miRNA. Microarray and real-time RT-PCR analyses revealed significantly-decreased levels
 of miR-139-5p and significantly increased levels of miR-5572 in the spinal cords of sALS patients
 compared with those in controls. We then focused on miR-5572, which has not been reported in ALS,
 and determined its target gene. By using TargetScan, we predicted SLC30A3 as the candidate target
 gene of miR-5572. In a previous study, we found decreased SLC30A3 levels in the spinal cords of
 sALS patients. We revealed that SLC30A3 was regulated by miR-5572. Taken together, these results
 demonstrate that the level of novel miRNA miR-5572 is increased in sALS and that SLC30A3 is one of
 the target genes regulated by miR-5572.

 Keywords: amyotrophic lateral sclerosis; microRNA; spinal cord; microarray

1. Introduction
     Amyotrophic lateral sclerosis (ALS) is a progressive degenerative disease caused by the loss
of motor neurons, which leads to muscular atrophy and weakness. The symptoms of ALS develop
rapidly to typically cause death within 3–5 years owing to respiratory muscular paralysis. In Japan,
the majority (approximately 95%) of ALS cases are sporadic of unknown cause (sALS), whereas the
remaining 5% are familial (fALS). The causative genes in fALS have been reported to be SOD1, TDP43,
FUS, and C9orf72 [1]. Although the etiology of sALS remains unknown, environmental factors such
as homeostasis of essential metals may play a pivotal role in the pathogenesis. Our previous studies
showed increased levels of zinc (Zn) and copper (Cu) in the cerebral spinal fluid (CSF) of sALS
patients [2], and decreased levels of the zinc transporters SLC30A3 and SLC30A6 in the spinal cords of
sALS patients compared with those of controls [3].

Int. J. Mol. Sci. 2020, 21, 4482; doi:10.3390/ijms21124482                                www.mdpi.com/journal/ijms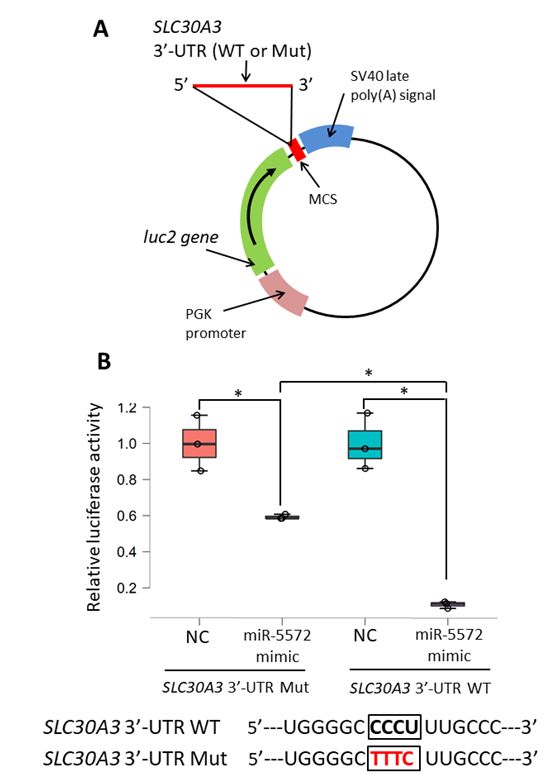
Int. J. Mol. Sci. 2020, 21, 4482 2 of 12
In drug treatments for ALS, few have successfully cured human ALS patients, although they
have been effective in animal models such as SOD1 mutant mice with fALS causative genes [4,5].
A better understanding of the molecular mechanism of sALS using autopsy samples is essential
for novel drug development. In recent years, the relationship between epigenetics and the onset of
neurodegenerative diseases has attracted considerable interest of both clinical and basic researchers.
The epigenetic mechanisms underlying an etiology of ALS are important for clarifying the onset of
sALS [6]. Epigenetics refers to mechanisms that change gene transcription without changing the DNA
sequence, such as DNA methylation, histone modification, and microRNA (miRNA). MicroRNAs are
short noncoding RNAs (about 20 bases) that bind to the 30 untranslated region (30 -UTR) of target genes
to suppress transcription and translation [7]. Studies of miRNAs in neurodegenerative diseases are
expected to shed new light on molecular mechanisms and could identify biomarkers for diagnosis [8,9].
The purpose of this study was to determine novel miRNAs to help elucidate the mechanisms underlying
the etiology of sALS.
2. Results
2.1. MiRNA Expression in Spinal Cords from Sporadic ALS Patients
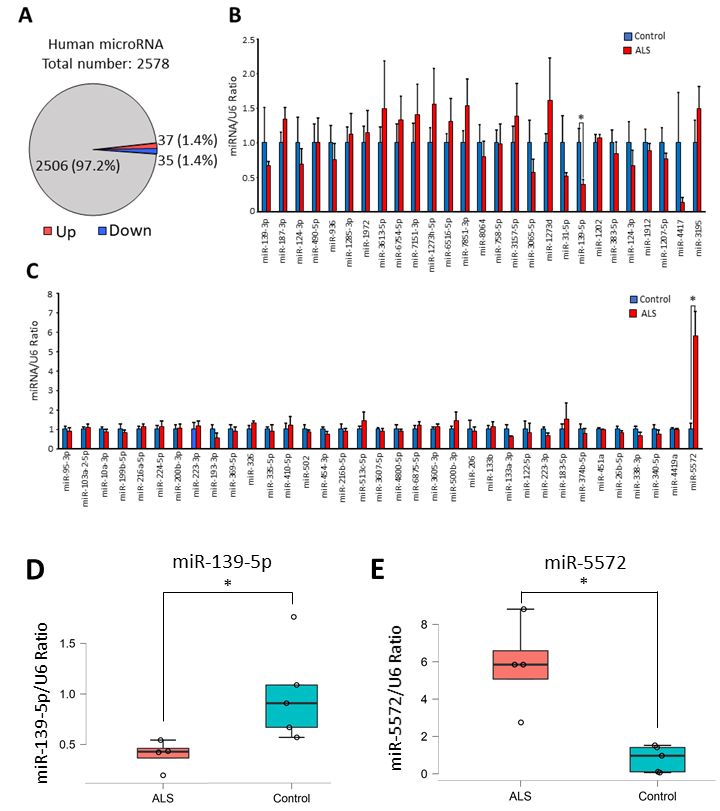
Global analysis of miRNA expression in spinal cords from sALS patients was performed using a
microarray. Raw data were validated by removing noise, which was data on low-signal spots. miRNAs
showing twofold changes in their levels in sALS samples were identified: 37 miRNAs were upregulated
and 35 miRNAs were downregulated (Figure 1A). All altered miRNAs in the ALS spinal cord samples
are presented in the supplementary data (Supplementary Table S1). These results of the microarray
analysis were further confirmed by real-time RT-PCR analysis. Among the miRNAs identified to
show changes in their levels by the microarray analysis, miR-6076, miR-6721-5p, miR-448, miR-431-3p,
miR-2276-3p, miR-3127-5p, miR-4638-5p, miR-5585-3p, miR-6800-5p, miR-6780b-5p, and miR-8063
could not be measured by real-time RT-PCR analysis, because suitable experimental conditions could
not be determined. Real-time RT-PCR analysis confirmed that the level of miR-139-5p in sALS patients
was significantly decreased compared with that in controls (Figure 1B,D), while the level of miR-5572
was significantly increased in sALS patients compared to controls (Figure 1C,E).
2.2. SLC30A3 Expression in the Spinal Cords of Sporadic ALS Patients, and Determination of the Relationship
between miR-5572 and SLC30A3
Increased levels of miR-5572 and decreased levels of miR-139-5p were observed in the spinal cords
of sALS patients. A change in miR-139-5p levels in the sera of ALS patients has been reported [10].
Alteration of miR-5572 has not been reported in ALS, and the functions or target genes of miR-5572
are unknown. We thus focused on this novel miRNA, miR-5572, and investigated its target genes.
The candidate target genes of miR-5572 were predicted by using the web algorithm TargetScan.
Increased levels of Zn and Cu in the CSF have been observed in ALS patients [2], and a disorder of Zn
homeostasis could be an etiological factor for sALS. Thus, we focused on zinc transporters as the target
genes. The zinc transporter genes SLC30A3, SLC30A7, SLC30A9, SLC39A7, SLC39A9, SLC39A11,
and SLC39A14 were predicted as the targets of miR-5572 by using TargetScan. In addition, our previous
study showed decreased SLC30A3 levels in the spinal cords of sALS patients [3], and SLC30A3 was
chosen as a candidate target gene of miR-5572 in this study. The ALS spinal cord samples used in these
two studies were collected from different patients. Thus, the SLC30A3 levels were determined to assess
whether these samples were comparable to the samples in the previous study. Decreased SLC30A3
levels were confirmed in these samples (Figure 2), which corresponded to our previous study [3].
From this result, it is possible that the increase in the miR-5572 levels is related to the decrease in the
SLC30A3 levels in sALS patients.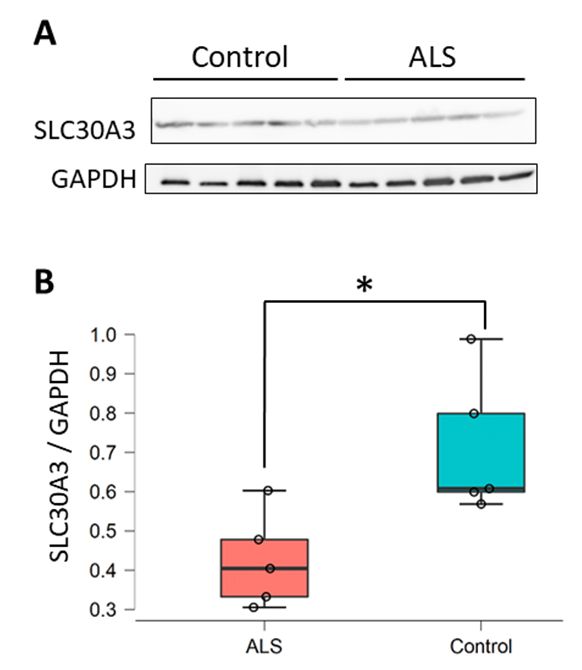
448, miR-431-3p, miR-2276-3p, miR-3127-5p, miR-4638-5p, miR-5585-3p, miR-6800-5p, miR-6780b-5p,
and miR-8063 could not be measured by real-time RT-PCR analysis, because suitable experimental
conditions could not be determined. Real-time RT-PCR analysis confirmed that the level of miR-139-
5p in sALS patients was significantly decreased compared with that in controls (Figure 1B,D), while
          Int. J. Mol. Sci. 2020, 21, 4482                                                3 of 12
the level of miR-5572 was significantly increased in sALS patients compared to controls (Figure 1C,E).

             Figure 1. Global analysis of microRNA (miRNA) expression in sporadic amyotrophic lateral sclerosis
             (sALS) was performed using spinal cord samples from patients with sALS. (A) The number or ratio of
             altered miRNAs in sALS is presented. More than twofold changes in miRNA levels were calculated
             from the result of microarray analysis. (B) Decreases in miRNA levels in the microarray were confirmed
             by real-time RT-PCR analysis. All data are presented as mean ± standard error. Statistical significance
             between control (n = 5) and sALS (n = 4) group in each miRNA was determined by Student’s t-test
             (* p < 0.05). (C) Increases in miRNA levels in the microarray were confirmed by real-time RT-PCR
             analysis. All data are presented as mean ± standard error. Statistical significance between control (n = 5)
             and sALS (n = 4) group in each miRNA was determined by Student’s t-test (* p < 0.05). (D) Re-plotted
             individual data (control; n = 5 and sALS; n = 4) of miR-139-5p/U6 ratio in Figure 1B are presented as box
             and scatter plot. Statistical significance was determined by Student’s t-test (* p < 0.05). (E) Re-plotted
             individual data (control; n = 5 and sALS; n = 4) of miR-5572/U6 ratio in Figure 1B are presented as box
             and scatter plot. Statistical significance was determined by Student’s t-test (* p < 0.05).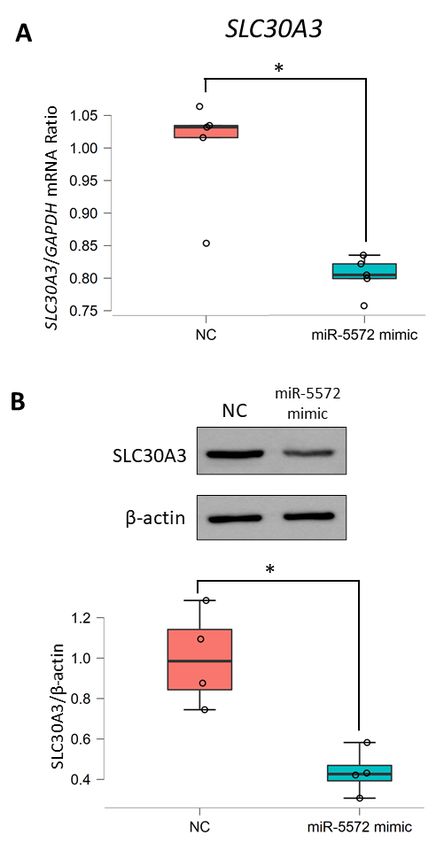
TargetScan. Increased levels of Zn and Cu in the CSF have been observed in ALS patients [2], and a
disorder of Zn homeostasis could be an etiological factor for sALS. Thus, we focused on zinc
transporters as the target genes. The zinc transporter genes SLC30A3, SLC30A7, SLC30A9, SLC39A7,
SLC39A9, SLC39A11, and SLC39A14 were predicted as the targets of miR-5572 by using TargetScan.
         Int. J. Mol. Sci. 2020, 21, 4482                                                                            4 of 12
In addition, our previous study showed decreased SLC30A3 levels in the spinal cords of sALS
patients [3], and SLC30A3 was chosen as a candidate target gene of miR-5572 in this study. The ALS
                 To investigate this possibility, we examined the transcriptional mechanism of SLC30A3 regulated
spinal cord samples used in these two studies were collected from different patients. Thus, the
         by miR-5572 using in vitro analysis. Transient overexpression of miR-5572 using a miRNA mimic was
SLC30A3performed
           levels were         determined
                          to determine          to assess whether
                                           the relationship             these samples
                                                             between miR-5572   and SLC30A3.were comparable       to the samples
                                                                                                   The levels of SLC30A3
in the previous
         mRNA and    study.      Decreased
                           protein             SLC30A3
                                      expression            levelsmimic
                                                 in the miR-5572    weregroup
                                                                          confirmed       in these samples
                                                                                were significantly   decreased(Figure
                                                                                                                compared  2), which
         with    those  in  the  negative  control (NC) group  (Figure 3A–C). Thus, it is possible that
corresponded to our previous study [3]. From this result, it is possible that the increase in the miR-  miR-5572 regulates
         theis
5572 levels    level  of SLC30A3.
                  related     to the decrease in the SLC30A3 levels in sALS patients.

                Figure 2. Determination of SLC30A3 was performed using spinal cord samples from patients with
                sALS. (A) The levels of SLC30A3 in the spinal cord were determined by Western blotting analysis.
                Samples from five patients in each experimental group (control; n = 5 and ALS; n = 5) were examined.
                (B) SLC30A3 in the spinal cords of sALS patients was quantified (control; n = 5 and ALS; n = 5). Data are
                presented as box and scatter plot calculated from the band intensity of the Western blot. Statistical
                significance was determined by Student’s t-test (* p < 0.05).

           2.3. Determination of Effects of miR-5572 on 30 -UTR of SLC30A3
                MiRNA binds to the 30 -UTR of the target gene to repress the level of the target gene. Here,
           a reporter system was used to examine the function of the 30 -UTR regulated by miRNA. Briefly,
           the 30 -UTR of the target gene was cloned in the reporter vector downstream of the luciferase gene.
           In this system, luciferase activity should be diminished if miRNA directly affects the cloned 30 -UTR in
           the reporter vector. Reporter vectors were constructed by cloning the 30 -UTR of SLC30A3 (wild type,
           WT) or its mutant (Mut) downstream of the luciferase reporter gene (Figure 4A). Relative luciferase
           activity in WT was significantly decreased by the miR-5572 mimic in comparison with that in NC
           (Figure 4B). Relative luciferase activity was significantly increased by the miR-5572 mimic in the Mut
           group compared with that in the WT group, although the decrease in luciferase activity remained
           significant between NC and miR-5572 mimic in the Mut group (Figure 4B). MiR-5572 is thus considered
           to bind to the 30 -UTR of SLC30A3 to suppress the transcriptional activity of SLC30A3.
regulated by miR-5572 using in vitro analysis. Transient overexpression of miR-5572 using a miRN
mimic was performed to determine the relationship between miR-5572 and SLC30A3. The levels
SLC30A3 mRNA and protein expression in the miR-5572 mimic group were significantly decrea
compared with
Int. J. Mol. those
Sci. 2020, in the negative control (NC) group (Figure 3A–C). Thus, it5isof 12
21, 4482 possible that m
5572 regulates the level of SLC30A3.
Figure 3. Determination of regulation of miR-5572 on SLC30A3 expression. (A) The level of SLC30A3
FiguremRNA
3. Determination
was determined in ofHEK293
regulation of miR-5572
cells transfected on SLC30A3
with negative expression.
control (NC) (n = 5) and(A) The level of SLC30A3
miR-5572
mRNA mimic = 5) by real-time
was(ndetermined inRT-PCR
HEK293 analysis.
cellsAll data are presented
transfected with as box and scatter
negative controlplot.(NC)
Statistical
(n = 5) and miR-5572
significance was determined by Student’s t-test (* p < 0.05). (B) The level of SLC30A3 protein was
mimic (n = 5) by real-time RT-PCR analysis. All data are presented as box and scatter plot. Statistical
determined in HEK293 cells transfected with NC (n = 4) or miR-5572 mimic (n = 4) by Western blotting
significance
analysis.was determined
All data are presentedbyas Student’s t-test
box and scatter plot.(*Statistical
p < 0.05). (B) Thewas
significance level of SLC30A3
determined by protein was
determined
Student’sint-test (* p < 0.05).
HEK293 cells transfected with NC (n = 4) or miR-5572 mimic (n = 4) by Western blotting
analysis. All data are presented as box and scatter plot. Statistical significance was determined by
Student’s t-test (* p < 0.05).reporter vector. Reporter vectors were constructed by cloning the 3′-UTR of SLC30A3 (wild type, WT)
or its mutant (Mut) downstream of the luciferase reporter gene (Figure 4A). Relative luciferase
activity in WT was significantly decreased by the miR-5572 mimic in comparison with that in NC
(Figure 4B). Relative luciferase activity was significantly increased by the miR-5572 mimic in the Mut
group compared with that in the WT group, although the decrease in luciferase activity remained
Int. J. Mol. Sci. 2020, 21, 4482 6 of 12
significant between NC and miR-5572 mimic in the Mut group (Figure 4B). MiR-5572 is thus
considered to bind to the 3′-UTR of SLC30A3 to suppress the transcriptional activity of SLC30A3.
Figure 4. 4.
Figure Reporter gene
Reporter assay
gene forfor
assay thethe
functional
functional analysis
analysisof of
3′-UTR
30 -UTR regulated
regulated bybymiRNA.
miRNA. (A)(A)
The
The
reporter construct
reporter contained
construct containedthe
theinserted
insertedDNADNAfragment
fragmentof ofhuman
human SLC30A3
SLC30A3 3′-UTR
30 -UTR wild type (WT)
wild type (WT) or
or mutant
mutant(Mut)
(Mut)downstream
downstreamofof luc2
luc2 in in
thethe pmirGLO
pmirGLO Dual-Luciferase
Dual-Luciferase miRNAmiRNA Target
Target Expression
Expression Vector.
Vector. (B) Reporter gene assay was performed using CHO cells co-transfected
(B) Reporter gene assay was performed using CHO cells co-transfected with NC or miR-5572 with NC or miR-5572
mimic,
mimic, andreporter
and the the reporter vector
vector clonedcloned
with with
WT 3WT0 -UTR3′-UTR of SLC30A3
of SLC30A3 30 -UTR
or mutant
or mutant 3′-UTR (n =(n
of SLC30A3
of SLC30A3 3 in
= 3each
in each experimental
experimental group).
group). AllAll
datadata
areare presented
presented as box
as box andand scatter
scatter plot.
plot. Statistical
Statistical significance
significance was
was determined
determined byby two-way
two-way ANOVA
ANOVA followed
followed by by
postpost
hochoc Bonferroni’s
Bonferroni’s (* p(*Int. J. Mol. Sci. 2020, 21, 4482 7 of 12
biomarkers for sALS. Although miR-206 is related to skeletal muscle differentiation [16], miRNAs
examined in previous studies using samples obtained from patients with ALS have not been explicitly
linked to the etiology of sALS. MiR-139-5p has been reported to suppress tumor progression [17,18],
and decreased levels of miR-139-5p in the serum of patients with ALS have recently been reported [10].
In this study, the levels of miR-139-5p were decreased in the spinal cords of sALS patients, which is
consistent with the previous study. Although a change in serum level is not necessarily reflected in
the central nervous system, serum miR-139-5p might be a useful biomarker that reflects the status
quo in sALS. Although there are limitations to using human post-mortem tissues to infer molecular
mechanisms about the onset of sALS, further evidence of miRNAs in the brain, spinal tissue, or blood
samples would be required to elucidate the relationship between miRNA dynamics and the etiology of
ALS. At the same time, appropriate in vivo and in vitro experimental models of ALS should be used to
determine the molecular mechanisms reflected by the evidence from human tissue samples.
We also found that the levels of miR-5572 increased in the spinal cords of sALS patients. To the
best of our knowledge, this is the first report showing the relationship between miR-5572 and ALS.
This miRNA is present only in humans and its functions have not been clarified yet. SLC30A3 was
identified as a target gene of miR-5572, and the regulatory mechanism of miR-5572 for SLC30A3
expression has been verified in this study. Increased levels of miR-5572 are considered to contribute to
the decreased levels of SLC30A3 in sALS. Interestingly, SLC30A3 plays a protective role against cellular
stress, including ER stress [19] and oxidative stress [20]. Thus, the regulation of SLC30A3 expression
driven by miR-5572 suggests the molecular mechanisms of ER stress response.
sALS is considered to be caused by a combination of genetic and environmental factors [21].
Dyshomeostasis of essential metals, including Zn and Cu, and other cellular stresses are assumed to be
pathogenic environmental factors. Indeed, Zn participates in various important biological activities
in proteins, including enzymes and transcription factors. Although several other target genes aside
from the zinc transporters are considered to be related to the development of sALS, SLC30A3 regulated
by miR-5572 is a susceptibility gene for sALS. In the future, we should determine what causes the
decrease in the miR-5572 levels in sALS patients in a given environment.
In conclusion, this study has shown that the levels of novel miRNAs were altered in the spinal
cords of sALS patients, and that SLC30A3 is one of the target genes regulated by miR-5572. Decreased
levels of SLC30A3 in sALS are considered to be related to increased levels of miR-5572. These findings
are very valuable for determining a part of the epigenetic mechanisms of sALS.
4. Materials and Methods
4.1. Subjects and Ethics
Spinal cord samples were obtained from five sALS patients and five controls with diseases other
than neurodegenerative disorders and no spinal lesions. Clinical procedures were performed in
accordance with the Declaration of Helsinki, and this study was approved by the Ethics Committee of
Gifu Pharmaceutical University (Approval number 28-2, 7 July 2016) and Graduate School of Medicine
of Niigata University (2321, 7 October 2015). This study was registered with the UMIN Clinical
Trials Registry approved by the International Committee of Medical Journal Editors (UMIN000030101,
24 November 2017).
4.2. Microarray Analysis for miRNA from ALS Samples
Total RNA, including miRNA, was isolated from the spinal cord samples obtained from sALS
patients and controls using a miRNeasy Mini Kit (Qiagen, Hilden, Germany). The quality of total
RNA (RNA integrity number > 7.0) was assessed using a 2100 Bioanalyzer (Agilent Technology,
Santa Clara, CA, USA). For each experimental group, 1 µg of pooled total RNA was labeled with
biotin using a FlashTagTM Biotin HSR RNA Labeling Kit (Thermo Fisher Scientific, Waltham, MA,
USA). The labeled RNA was then hybridized to a GeneChip® miRNA 4.0 Array (Affymetrix, SantaInt. J. Mol. Sci. 2020, 21, 4482 8 of 12
Clara, CA, USA) in a GeneChip® Hybridization Oven 645 (Affymetrix). The microarray was washed
using GeneChip® Fluidics Station 450 (Affymetrix) and scanned with a GeneChip® Scanner 3000
7G (Affymetrix). The resulting data were analyzed using an Affymetrix® GeneChip® Command
Console 4.0 (Affymetrix). Low signal-to-noise data were eliminated from the raw data. MiRNAs
with changes in their levels greater than twofold were selected, and the changes were confirmed by
real-time RT-PCR analysis.
4.3. Quantitative RT-PCR Analysis of miRNA
Total RNA (150 ng), including miRNA, was subjected to a reverse transcription reaction using a
Mir-X™ miRNA First-Strand Synthesis Kit (TAKARA, Kusatsu, Japan) to form complementary DNA
(cDNA), following the manufacturer’s protocol. An aliquot of cDNA was then amplified by real-time
RT-PCR using a miRNA-specific forward primer and the universal reverse primer. Real-time RT-PCR
was performed using THUNDERBIRD® SYBR® qPCR Mix (TOYOBO, Osaka, Japan) and a StepOne
Real-Time PCR System (Applied Biosystems, Foster City, CA, USA) under the following conditions:
95 ◦ C/60 s × 1 cycle; 95 ◦ C/15 s, and 60–64 ◦ C/45 s, × 40 cycles. MiRNA-specific primers were set
following the manufacturer’s instructions, and the miRQ 30 primer supplied by the manufacturer
was used for the PCR. The miRNA-specific primers used for real-time RT-PCR are listed in Table 1.
For each sample, the amplified U6 cDNA was used as an internal control. Primers supplied by the
manufacturer were used to determine the U6 level.
Table 1. Primer list for miRNA expression in real time RT-PCR experiments.
miRNA-Specific Primers (50 > 30 ) Target miRNA miRNA-Specific Primers (50 > 30 ) Target miRNA
TTCAACGGGTATTTATTGAGCA miR-95-3p AGGCAAGATGCTGGCATAGCT miR-31-5p
AGCTTCTTTACAGTGCTGCCTTG miR-103a-2-5p TCTACAGTGCACGTGTCTCCAGT miR-139-5p
CAAATTCGTATCTAGGGGAATA miR-10a-3p GTGCCAGCTGCAGTGGGGGAG miR-1202
CCCAGTGTTTAGACTATCTGTTC miR-199b-5p AGATCAGAAGGTGATTGTGGCT miR-383-5p
TAATCTCAGCTGGCAACTGTGA miR-216a-5p TAAGGCACGCGGTGAATGCC miR-124-3p
CAAGTCACTAGTGGTTCCGTT miR-224-5p TACCCAGAGCATGCAGTGTGAA miR-1912
TAATACTGCCTGGTAATGATGA miR-200b-3p TGGCAGGGAGGCTGGGAGGGG miR-1207-5p
TGTCAGTTTGTCAAATACCCCA miR-223-3p GGTGGGCTTCCCGGAGGG miR-4417
AACTGGCCTACAAAGTCCCAGT miR-193-3p CGCGCCGGGCCCGGGTT miR-3195
TTATAAAGCAATGAGACTGATT miR-369-5p TTATAAAGCAATGAGACTGATT miR-340-3p
CCTCTGGGCCCTTCCTCCAG miR-326 TGAGGGAGGAGACTGCA miR-4419a
CAAGAGCAATAACGAAAAATGT miR-335-5p GTTGGGGTGCAGGGGTCTGCT miR-5572
AATATAACACAGATGGCCTGT miR-410-3p TGGAGACGCGGCCCTGTTGGAGT miR-139-3p
ATCCTTGCTATCTGGGTGCTA miR-502-5p TCGTGTCTTGTGTTGCAGCCGG miR-187-3p
TAGTGCAATATTGCTTATAGGGT miR-454-3p TAAGGCACGCGGTGAATGCC miR-124-3p
AAATCTCTGCAGGCAAATGTGA miR-216b-5p CCATGGATCTCCAGGTGGGT miR-490-5p
TTCTCAAGGAGGTGTCGTTTAT miR-513c-5p GATGGTTGACCAGAGAGCACAC miR-758-5p
GCACCCAGGCAAGGATTCTG miR-500b-3p ACAGTAGAGGGAGGAATCGCAG miR-936
CCTCCGTGTTACCTGTCCTCTAG miR-3605-3p TCTGGGCAACAAAGTGAGACCT miR-1285-3p
GCATGTGATGAAGCAAATCAGT miR-3607-5p TCAGGCCAGGCACAGTGGCTCA miR-1972
AGTGGACCGAGGAAGGAAGGA miR-4800-5p TTCAGCCAGGCTAGTGCAGTCT miR-3157-5p
TGGAATGTAAGGAAGTGTGTGG miR-206 TCAACAAAATCACTGATGCTGGA miR-3065-5p
TTTGGTCCCCTTCAACCAGCTA miR-133b GAACCCATGAGGTTGAGGCTGCAGT miR-1273d
TTTGGTCCCCTTCAACCAGCTG miR-133a-3p TGTTGTACTTTTTTTTTTGTTC miR-3613-5p
TGGAGTGTGACAATGGTGTTTG miR-122-5p CCAGGGAGGCTGGTTTGGAGGA miR-6754-5p
TGTCAGTTTGTCAAATACCCCA miR-223-3p CTACAGGCTGGAATGGGCTCA miR-7151-3p
TATGGCACTGGTAGAATTCACT miR-183-5p CTGGGAGGTCAAGGCTGCAGT miR-1273h-5p
AAACCGTTACCATTACTGAGTT miR-451a TTTGCAGTAACAGGTGTGAGCA miR-6516-5p
ATATAATACAACCTGCTAAGTG miR-374b-5p TACCTGGGAGACTGAGGTTGGA miR-7851-3p
TTCAAGTAATTCAGGATAGGT miR-26b-5p AGCACACTGAGCGAGCGGAC miR-8064
TCCAGCATCAGTGATTTTGTTG miR-338-3p
4.4. Cell Culture
Human embryonic kidney (HEK293) cells or Chinese hamster ovary (CHO) cells were used in
this study. HEK293 cells were cultured in Dulbecco’s Modified Eagle’s medium (Sigma, St. Louis,
MO USA) supplemented with 10% fetal bovine serum (FBS) under 5% CO2 at 37 ◦ C. CHO cells were
cultured in Ham’s medium (Sigma) supplemented with 10% FBS under 5% CO2 at 37 ◦ C.Int. J. Mol. Sci. 2020, 21, 4482 9 of 12
4.5. MicroRNA Mimic Experiments
The miRNA overexpression by the miRNA mimic was performed using the AccuTargetTM
“human” miRNA mimic “hsa-miR-5572” [Accession: MIMAT0022260] (BIONEER, Daejeon, Korea) or
AccuTargetTM miRNA-mimic-negative control #1 (BIONEER). HEK293 cells were seeded at a density
of 7.0 × 10⁵ cells/well in a 6-well multiplate and cultured for 24 h. The miR5572 mimic or NC miRNA
mimic was transfected into HEK293 cells or CHO cells using Lipofectamine RNAiMax (Invitrogen,
Carlsbad, CA, USA) in Opti-MEM (Invitrogen). Transfected cells were subjected to real-time RT-PCR
and Western blotting 24 h post-transfection.
4.6. Quantitative RT-PCR for mRNA
Total RNA was isolated using Tripure Isolation Reagent (Sigma) following the manufacturer’s
protocols. cDNA was prepared from 1 µg of total RNA with ReverTra Ace® qPCR RT Master Mix
(TOYOBO), following the manufacturer’s protocols. Real-time RT-PCR analysis was performed
using THUNDERBIRD® SYBR qPCR Mix (TOYOBO) and amplified using a StepOne Real-Time PCR
System under the following conditions: 95 ◦ C/60 s × 1 cycle; 95 ◦ C/15 s, 60 ◦ C/45 s, × 40 cycles.
The primers used were as follows: SLC30A3 forward, 50 -ACCATGTTGCCTCTGCACAC-30 ; reverse,
50 -CATCTCCGGCTGATACTGCTC-30 ; GAPDH forward, 50 -TGGTGAAGACGCCAGTGGA-30 ; reverse,
50 -GCACCGTCAAGGCTGAGAAC-30 . All primer sets were designed using the Primer3 program.
The amplification of GAPDH cDNA in the sample was used as an internal control for all reactions of
PCR amplification.
4.7. Western Blotting
Treated cells were lysed in lysis buffer (150 mM NaCl, 10 mM Tris-HCl, 10% glycerol, 1% triton
X-100, 1% NP-40, 1 mM EDTA, 10 µg/mL aprotinin, 10 µg/mL leupeptin, 0.1 mM PMSF). The protein
concentration was determined using a Pierce BCA protein assay kit (Thermo Fisher Scientific).
Next, 15 µg of protein underwent SDS-PAGE to separate the proteins at a certain molecular weight.
The separated proteins in polyacrylamide gel were transferred to a polyvinylidene fluoride membrane
in transfer buffer (0.3% Tris, 1.44% glycine, 20% methanol). The membrane was incubated in 5% skim
milk (Nacalai Tesque, Kyoto, Japan) at room temperature for 60 min. After blocking the reaction,
the membrane was incubated with a primary antibody (1:1000) dissolved in 3% skim milk solution
(rabbit anti-SLC30A3 antibody, Proteintech Group, Rosemont, IL, USA) and a mouse anti-β-actin
antibody (Santa Cruz Biotechnology, Dallas, TX, USA) at 4 ◦ C overnight. After the primary antibody
reaction, the membrane was incubated with a secondary antibody (goat anti-rabbit antibody conjugated
with horseradish peroxidase (HRP), Santa Cruz Biotechnology, 1:2500) and a goat anti-mouse HRP
antibody conjugated with HRP (Santa Cruz Biotechnology, 1:2500). Next, the membrane was
incubated in ECL prime (GE Healthcare, Chicago, IL, USA) to generate chemiluminescence from the
HRP-conjugated antibodies. Chemiluminescence was detected using a LAS3000 mini (Fujifilm, Tokyo,
Japan) and the band density was measured using ImageJ software (NIH, Bethesda, MD, USA).
4.8. Reporter Construct of SLC30A3 30 -UTR
The pUC57 plasmid cloned with human SLC30A3 30 -UTR (pUC57; hSLC30A3; 30 -UTR) was
purchased from GenScript. The human SLC30A3 30 -UTR was amplified from pUC57; hSLC30A3;
30 -UTR plasmid using PrimeSTAR® Max DNA polymerase (TAKARA) and a Veriti Thermal Cycler
(Applied Biosystems). A restriction enzymatic site of XhoI or XbaI was added to each primer to amplify
SLC30A3 30 -UTR as follows: XhoI-30 UTR-hSLC30A3-forward, 50 -GACCTCGAGGCCATGGCCCT-30 ;
30 UTR-hSLC30A3-XbaI-reverse, 50 -GCATCTAGATGCAGTGAGAC-30 . The amplified DNA fragment
and pmirGLO Dual-Luciferase miRNA Target Expression Vector (Promega, Madison, WI,
USA) were digested with the XhoI and XbaI restriction enzymes (Thermo Fisher Sciences).
The digested DNA fragment was then subcloned into the digested pmirGLO Dual-LuciferaseInt. J. Mol. Sci. 2020, 21, 4482 10 of 12
miRNA Target Expression Vector. This plasmid was termed pmirGLO; hSLC30A3; 30 UTR.
The mutant of human SLC30A3 30 UTR was added to pmirGLO; hSLC30A3; 30 UTR by inverse
PCR with PrimeSTAR® Max DNA polymerase. The primers for generating the mutant plasmid
were as follows: (hSLC30A3-30 UTR-mut-forward: 50 -ACAAGCCCGCACTTTGTCCGTGTGT-30 ;
hSLC30A3-30 UTR-mut-reverse: 50 -TTGCCCCTGCATAGACAGAGCGAGG-30 . This mutant plasmid
was termed pmiRGLO; hSLC30A3; 30 UTR-mut.
4.9. Luciferase Reporter Gene Assay
CHO cells in Opti-MEM (Invitrogen) at a concentration of 3.5 × 10⁵ cells/mL were co-transfected
with pmirGLO; hSLC30A3; 30 UTR or pmiRGLO; hSLC30A3; 30 UTR-mut, and pSV-β-galactosidase
control (Promega) vectors, and an NC mimic or a miR5572 mimic using Lipofectamine2000 (Invitrogen).
At 24 h after transfection, transfected cells were lysed by adding 1× Passive Lysis Buffer (Promega) and
incubated for 15 min at 4 ◦ C. The supernatant was then collected. Next, 20 µL of the supernatant was
used in the luciferase assay and 50 µL of the supernatant was used to measure β-galactosidase activity.
For the luciferase assay, 100 µL of luciferin reagent (0.5 mM luciferin, 20 mM tricine, 1.1 mM MgCO2 ,
2.7 mM MgSO4 , 33.3 mM DTT, 0.2 mg/mL coenzyme A, 0.53 mM ATP, 0.1 mM EDTA) was added to the
supernatant and incubated for 10 min at 37 ◦ C. For the β-galactosidase activity assay, 50 µL of ONPG
reagent (1.33 mg/mL 2-nitrophenyl-β-d-galactopyranoside, 120 mM Na2 HPO4 , 80 mM NaH2 PO4 ,
2 mM MgCl2 , 100 mM 2-mercaptoethanol) was added to the supernatant and incubated for 15 min at
37 ◦ C. The levels of luminescence and β-galactosidase activity were measured using a GloMax-Multi
Detection System (Promega), and luciferase activity was normalized using β-galactosidase activity.
4.10. Statistical Analysis
All results are expressed as mean ± standard error or box and scatter plot. Statistical analysis
was performed using IBM SPSS Statistics ver. 19.0 (IBM, Westchester, NY, USA) or StatView (Abacus,
Baltimore, MD, USA). The level of statistical significance was set at p < 0.05. Figures of box and scatter
plot were described using JASP ver. 0.12.2 (University of Amsterdam, Amsterdam, The Netherlands).
5. Conclusions
The levels of novel miRNAs were altered in sALS. As SLC30A3 is one of the target genes regulated
by miR-5572, the decreased levels of SLC30A3 in sALS are considered to be due to the increased levels
of miR-5572.
Supplementary Materials: Supplementary Materials can be found at http://www.mdpi.com/1422-0067/21/12/
4482/s1. Table S1: Up-regulated miRNA in ALS. Table S2: Down-regulated miRNA in ALS.
Author Contributions: Conceptualization, H.K. and I.H.; methodology, H.K.; software, H.K.; validation, H.K.,
M.I., and I.H.; formal analysis, H.K., S.Y., and T.U.; investigation, H.K., S.Y., and T.U.; resources, A.K. and I.H.;
data curation, H.K., S.Y., and T.U.; writing—original draft preparation, H.K., S.Y., and T.U.; writing—review
and editing, M.I., A.K., and I.H.; visualization, H.K., S.Y., and T.U.; supervision, I.H.; project administration,
H.K. and I.H.; funding acquisition, H.K. and I.H. All authors have read and agreed to the published version of
the manuscript.
Funding: This study was partly supported by JSPS KAKENHI Grant-in-Aid for Young Scientists (B) (15K21278
and 17K18001) and Grant-in-Aid of The Nakabayashi Trust For ALS Research, Tokyo, Japan to H.K., Grant-in-Aid
for Scientific Research on Innovative Areas JSPS KAKENHI (Grant No. JP19H05767A02), and the Collaborative
Research Project (2019-23) of Brain Research Institute, Niigata University to I.H. The APC was funded by
Grant-in-Aid for Scientific Research on Innovative Areas JSPS KAKENHI (Grant No. JP19H05767A02).
Conflicts of Interest: The authors declare that there is no conflict of interests.Int. J. Mol. Sci. 2020, 21, 4482 11 of 12
Abbreviations
ALS amyotrophic lateral sclerosis
miRNA microRNA
CSF cerebral spinal fluid
UTR untranslated region
References
1. Taylor, J.P.; Brown, R.H., Jr.; Cleveland, D.W. Decoding ALS: From genes to mechanism. Nature 2016, 539,
197–206. [CrossRef] [PubMed]
2. Hozumi, I.; Hasegawa, T.; Honda, A.; Ozawa, K.; Hayashi, Y.; Hashimoto, K.; Yamada, M.; Koumura, A.;
Sakurai, T.; Kimura, A.; et al. Patterns of levels of biological metals in CSF differ among neurodegenerative
diseases. J. Neurol. Sci. 2011, 303, 95–99. [CrossRef] [PubMed]
3. Kaneko, M.; Noguchi, T.; Ikegami, S.; Sakurai, T.; Kakita, A.; Toyoshima, Y.; Kambe, T.; Yamada, M.; Inden, M.;
Hara, H.; et al. Zinc transporters ZnT3 and ZnT6 are downregulated in the spinal cords of patients with
sporadic amyotrophic lateral sclerosis. J. Neurosci. Res. 2015, 93, 370–379. [CrossRef] [PubMed]
4. Garbuzova-Davis, S.; Thomson, A.; Kurien, C.; Shytle, R.D.; Sanberg, P.R. Potential new complication in
drug therapy development for amyotrophic lateral sclerosis. Expert. Rev. Neurother. 2016, 16, 1397–1405.
[CrossRef]
5. Maragakis, N.J. What can we learn from the edaravone development program for ALS? Amyotroph. Lateral
Scler. Frontotemporal Degener. 2017, 18, 98–103. [CrossRef]
6. Belzil, V.V.; Katzman, R.B.; Petrucelli, L. ALS and FTD: An epigenetic perspective. Acta Neuropathol. 2016,
132, 487–502. [CrossRef]
7. Huntzinger, E.; Izaurralde, E. Gene silencing by microRNAs: Contributions of translational repression and
mRNA decay. Nat. Rev. Genet. 2011, 12, 99–110. [CrossRef] [PubMed]
8. Basak, I.; Patil, K.S.; Alves, G.; Larsen, J.P.; Moller, S.G. microRNAs as neuroregulators, biomarkers and
therapeutic agents in neurodegenerative diseases. Cell. Mol. Life Sci. 2016, 73, 811–827. [CrossRef] [PubMed]
9. Tan, L.; Yu, J.T. Causes and Consequences of MicroRNA Dysregulation in Neurodegenerative Diseases.
Mol. Neurobiol. 2015, 51, 1249–1262. [CrossRef]
10. Raheja, R.; Regev, K.; Healy, B.C.; Mazzola, M.A.; Beynon, V.; von Glehn, F.; Paul, A.; Diaz-Cruz, C.;
Gholipour, T.; Glanz, B.I.; et al. Correlating serum microRNAs and clinical parameters in Amyotrophic
lateral sclerosis. Muscle Nerve 2018, 58, 261–269. [CrossRef] [PubMed]
11. De Andrade, H.M.; de Albuquerque, M.; Avansini, S.H.; de, S.R.C.; Dogini, D.B.; Nucci, A.; Carvalho, B.;
Lopes-Cendes, I.; Franca, M.C., Jr. MicroRNAs-424 and 206 are potential prognostic markers in spinal onset
amyotrophic lateral sclerosis. J. Neurol. Sci. 2016, 368, 19–24. [CrossRef] [PubMed]
12. Russell, A.P.; Wada, S.; Vergani, L.; Hock, M.B.; Lamon, S.; Leger, B.; Ushida, T.; Cartoni, R.; Wadley, G.D.;
Hespel, P.; et al. Disruption of skeletal muscle mitochondrial network genes and miRNAs in amyotrophic
lateral sclerosis. Neurobiol. Dis. 2013, 49, 107–117. [CrossRef]
13. Toivonen, J.M.; Manzano, R.; Olivan, S.; Zaragoza, P.; Garcia-Redondo, A.; Osta, R. MicroRNA-206:
A potential circulating biomarker candidate for amyotrophic lateral sclerosis. PLoS ONE 2014, 9, e89065.
[CrossRef] [PubMed]
14. De Felice, B.; Annunziata, A.; Fiorentino, G.; Borra, M.; Biffali, E.; Coppola, C.; Cotrufo, R.; Brettschneider, J.;
Giordana, M.L.; Dalmay, T.; et al. miR-338-3p is over-expressed in blood, CFS, serum and spinal cord from
sporadic amyotrophic lateral sclerosis patients. Neurogenetics 2014, 15, 243–253. [CrossRef] [PubMed]
15. Wakabayashi, K.; Mori, F.; Kakita, A.; Takahashi, H.; Utsumi, J.; Sasaki, H. Analysis of microRNA from
archived formalin-fixed paraffin-embedded specimens of amyotrophic lateral sclerosis. Acta Neuropathol.
Commun. 2014, 2, 173. [CrossRef]
16. Ma, G.; Wang, Y.; Li, Y.; Cui, L.; Zhao, Y.; Zhao, B.; Li, K. MiR-206, a key modulator of skeletal muscle
development and disease. Int. J. Biol. Sci. 2015, 11, 345–352. [CrossRef] [PubMed]
17. Yonemori, M.; Seki, N.; Yoshino, H.; Matsushita, R.; Miyamoto, K.; Nakagawa, M.; Enokida, H.
Dual tumor-suppressors miR-139-5p and miR-139-3p targeting matrix metalloprotease 11 in bladder
cancer. Cancer Sci. 2016, 107, 1233–1242. [CrossRef]Int. J. Mol. Sci. 2020, 21, 4482 12 of 12
18. Yue, S.; Wang, L.; Zhang, H.; Min, Y.; Lou, Y.; Sun, H.; Jiang, Y.; Zhang, W.; Liang, A.; Guo, Y.; et al. miR-139-5p
suppresses cancer cell migration and invasion through targeting ZEB1 and ZEB2 in GBM. Tumour Biol. 2015,
36, 6741–6749. [CrossRef]
19. Kurita, H.; Okuda, R.; Yokoo, K.; Inden, M.; Hozumi, I. Protective roles of SLC30A3 against endoplasmic
reticulum stress via ERK1/2 activation. Biochem. Biophys. Res. Commun. 2016, 479, 853–859. [CrossRef]
20. Patrushev, N.; Seidel-Rogol, B.; Salazar, G. Angiotensin II requires zinc and downregulation of the zinc
transporters ZnT3 and ZnT10 to induce senescence of vascular smooth muscle cells. PLoS ONE 2012, 7,
e33211. [CrossRef]
21. Simpson, C.L.; Al-Chalabi, A. Amyotrophic lateral sclerosis as a complex genetic disease. Biochim. Biophys.
Acta 2006, 1762, 973–985. [CrossRef] [PubMed]
© 2020 by the authors. Licensee MDPI, Basel, Switzerland. This article is an open access
article distributed under the terms and conditions of the Creative Commons Attribution
(CC BY) license (http://creativecommons.org/licenses/by/4.0/).You can also read