Intermittent Versus Continuous Energy Restriction for Weight Loss and Metabolic Improvement: A Meta-Analysis and Systematic Review
←
→
Page content transcription
If your browser does not render page correctly, please read the page content below
Original Article Obesity
OBESITY BIOLOGY AND INTEGRATED PHYSIOLOGY
Intermittent Versus Continuous Energy Restriction
for Weight Loss and Metabolic Improvement:
A Meta-Analysis and Systematic Review
Shasha He , Jiao Wang, Jie Zhang, and Jixiong Xu
Objective: This study aimed to evaluate the effects of intermittent energy
restriction (IER; only for 2-3 d/wk) versus continuous energy restriction Study Importance
(CER) on weight loss and metabolic outcomes in adults with overweight What is already known ?
or obesity.
► Related meta-analyses and narrative re-
Methods: Methods included searching databases from the last dec- views have shown that intermittent en-
ade to December 18, 2019, for randomized controlled trials (RCTs) that ergy restriction (IER) results in greater
assessed weight loss and metabolic outcomes in IER and CER. RevMan weight loss and metabolic improvement
version 5.3 software was used for statistical analysis of the data. The than continuous energy restriction (CER).
effect sizes were expressed as weight mean differences and 95% CI. What does this study add?
Results: This review included 11 RCTs (n = 850). Meta-analysis showed
► We only included studies with 2-3 d/wk
that IER had greater effects on absolute weight loss, the percentage of of IER, with similar overall energy restric-
weight loss, and improving insulin sensitivity than CER. In the subgroup tion compared with the CER group.
analysis, short-term (2-3 months) intervention (P < 0.0001) was associ- ► Our study found that absolute weight
ated with weight loss. loss and the percentage of weight loss
Conclusions: This systematic review shows that IER (2-3 d/wk) had were greater for IER than for CER in the
short term, and there is no evidence to
greater effects on short-term weight loss than CER and that IER results
suggest that IER is easier to maintain
in comparative metabolic improvements. Furthermore, longer RCTs are over the long term.
needed to validate these findings.
Obesity (2021) 29, 108-115.
Introduction suitable for patients who do not respond to lifestyle intervention (10).
Continuous energy restriction (CER) involving a daily energy deficit of
In 2015, the overall prevalence of obesity (BMI ≥ 30 kg/m2) worldwide 500 to 750 kcal is recommended as a traditional weight management
was 5.0% (107.7 million) among children and 12.0% (603.7 million) strategy (11). However, many individuals find it difficult to adhere to
among adults, as reported by the Global Burden of Disease study (1). CER (12) because energy must be limited every day. Intermittent en-
Weight gain is associated with an increased risk of chronic diseases, ergy restriction (IER), also called intermittent fasting, has gradually
such as diabetes mellitus (2), cardiovascular disease (2), chronic kid- attracted attention and popularity in the past few decades (13). IER
ney disease (3), metabolic syndrome (4), cancer (5), and musculoskel- typically involves periods of energy restriction (a very low-energy diet,
etal disorders (6), which not only have negative physical effects but approximately 500-600 kcal/d) alternating with periods of unrestricted
also increase the financial burden on society. In 2014, it was estimated food intake (14). The main forms of IER include the 5:2 diet and al-
that the impact of obesity on the global economy was about $2 trillion ternate-day fasting (ADF). The 5:2 diet consists of two consecutive or
(US dollars), accounting for 2.8% of the global gross domestic prod- nonconsecutive fasting days and five ad libitum eating days. ADF is
uct (7). Weight loss has been shown to improve lipids, blood pressure, characterized by a fasting day alternating with an ad libitum eating day.
and glucose and to decrease the risk of cardiovascular disease and all- Time-restricted feeding (13), which allows individuals to eat within a
cause mortality (8). It has been suggested that patients with overweight specific range of time, has also been included in previous systematic
or obesity should achieve and maintain >5% weight loss to improve reviews and meta-analyses on IER.
obesity-related conditions (9). Lifestyle interventions, including diet,
physical activity, and behavioral therapy, are the foundation for weight To the best of our knowledge, previous reviews of randomized con-
loss (10). Pharmacotherapy, medical devices, or bariatric surgery is trolled trials (RCTs) (13-17) that included weekly IER, that is, from
Department of Endocrine and Metabolism, First Affiliated Hospital of Nanchang University, Nanchang, People’s Republic of China. Correspondence: Jixiong Xu
(xujixiong@163.com)
© 2020 The Obesity Society. Received: 22 December 2019; Accepted: 13 August 2020; Published online 21 December 2019. doi:10.1002/oby.23023
108 Obesity | VOLUME 29 | NUMBER 1 | JANUARY 2021 www.obesityjournal.org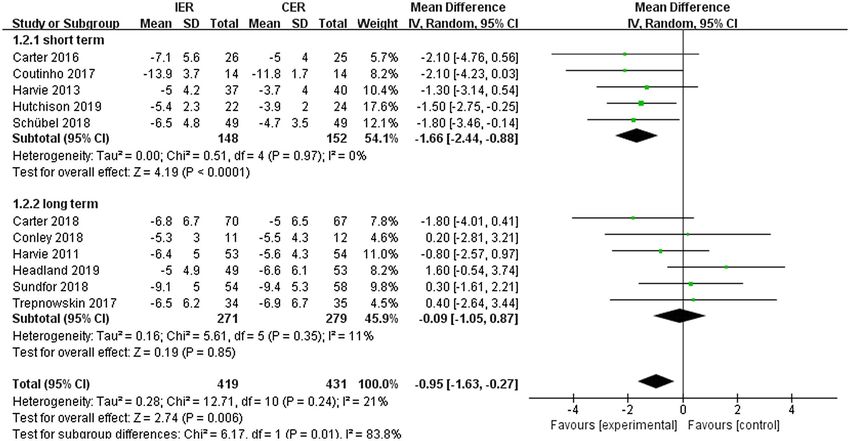
Original Article                                                                                                                            Obesity
OBESITY BIOLOGY AND INTEGRATED PHYSIOLOGY

one up to six fasting days per week or time-restricted feeding, have con-   as confounding factors. All RCTs were assessed as having low, high, or
cluded that IER and CER achieved alternative and comparative effects        unclear risk of bias. Any disagreements were resolved by consulting the
in promoting weight loss and metabolic improvement. Additionally,           senior investigator.
narrative reviews have assessed both weight loss (18) and metabolic
markers (19). However, previous meta-analyses did not consider
whether the total energy restriction was similar between the IER and        Data synthesis and statistical analysis
CER diets. Moreover, an overall evaluation of the impact of IER (the        The effects of the RCTs were expressed as weight mean differ-
5:2 diet and ADF) versus CER regimens on weight loss, multiple met-         ences (WMDs), and the CI was 95%. The random-effects model
abolic variables, percentage of weight loss consisting of fat mass (FM),    with inverse-variance methods was performed for meta-analyses.
and percentage of weight loss consisting of fat-free mass (FFM), as         Heterogeneity was identified by using the I2 test (23), and when P was
well as inflammation factors, is at present lacking.                        greater than 0.1 and I2 was less than 50%, low heterogeneity was con-
                                                                            sidered to exist between RCTs. Sensitivity analysis was conducted by
The aim of this systematic review and meta-analysis is to compare IER       removing each study one by one, and then the effect size was merged
with CER in terms of their impact on weight loss and metabolic out-         again to evaluate the stability and reliability of the meta-analysis re-
comes in patients with overweight or obesity.                               sults. The intervention duration (short-term,
Obesity Intermittent vs. Continuous Energy Restriction He et al.
Figure 1 Flow diagram of study selection.
follow a 400- to 600-kcal daily reduction or a 20% (30) to 33% (32) en- (Supporting Information Figure S1). The result was the same in the
ergy restriction. The principle of energy composition was in accordance sensitivity analysis.
with the Mediterranean-type diet.
Other anthropometric measures. Eight RCTs (24,25,27-29,32-
34) reported changes in FM and FFM, and four RCTs (26-28,31)
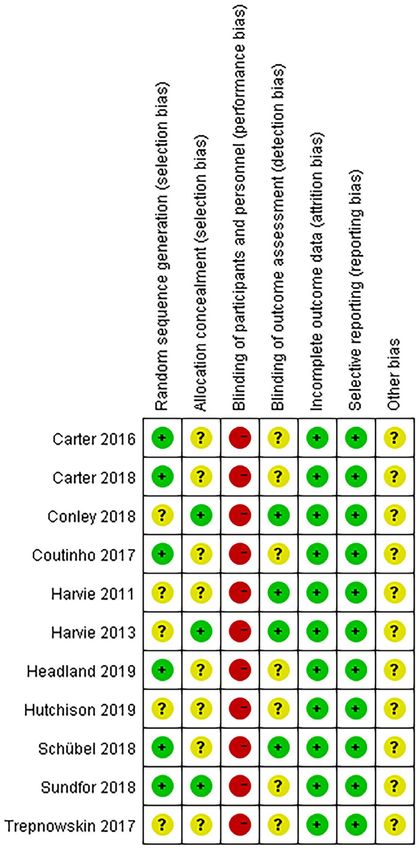
Risk-of-bias assessment for included RCTs reported changes in WC. The percentage lost as FFM ranged from
All RCTs had a high risk of bias because of performance bias. The drop-
between 14% (29) and 37% (25) to between 17% (33) and 31%
out rates were similar in both groups. Intention-to-treat analyses were
(25) in the IER and CER groups in our review, respectively. FM and
performed in 9 of 11 studies (24-28,30-32,34). For selection, report-
FFM were assessed in different ways, such as body independence
ing, attrition, and other biases, all RCTs had either low or unclear risk
analysis (27,28), dual x-ray absorptiometry (24,25,29,33,34), and air-
(Figure 2). The grades of recommendations assessment, development
displacement plethysmography (32). This meta-analysis showed no
and evaluation assessment is presented in Supporting Information Table
significant reduction in FM, FFM, and WC (Supporting Information
S2. Overall, the evidence comparing IER with CER was of low quality.
Figures S2A-S2B and Supporting Information Figure S3). Subgroup
analysis showed that short-term interventions with IER were associated
Meta-analysis with a reduction in FM and FFM (Supporting Information Figure S2B).
Weight loss. Eleven RCTs (24-34) reported weight loss, and mean However, this reduction did not differ between groups when expressed
weight loss in almost studies was >5%. Absolute weight loss (WMD: as the percentage of weight lost rather than as the absolute reduction.
−0.95 kg; 95% CI: −1.63 to −0.27; P=0.01) (Figure 3) and percentage
of weight loss (WMD: −1%; 95% CI: −2 to 0; P= 0.02) were greater Changes in insulin sensitivity and associated markers. For
for IER than for CER. Subgroup analyses showed that short-term the population without diabetes, five RCTs (27,28,30,33,34) reported
interventions with IER were associated with increased weight loss changes in the homeostatic model assessment of insulin resistance
(Figure 3). Subgroup analyses of the percentage of weight loss showed (HOMA-IR) and fasting insulin, and six RCTs (26-28,30,33,34)
results similar to those of the absolute values. Pooled data from four reported changes in fasting glucose. Four RCTs (24,25,27,30) analyzed
RCTs (28,30,33,35) showed no significant effect of IER on weight the changes of glycated hemoglobin, two of which (24,25) were studies
loss from baseline to the weight maintenance or follow-up phase of people with diabetes. Fasting glucose and glycated hemoglobin did
110 Obesity | VOLUME 29 | NUMBER 1 | JANUARY 2021 www.obesityjournal.orgTABLE 1 Characteristics of the included studies
Fasting Fasting insu-
glucose lin (μU/mL); Total
Author, year Samples BMI FM; FFM (mmol/L); HOMA-IR cholesterol HDL-C LDL-C TG
(reference) Duration Study group (F/M) (kg/m2) Age (y) Weight (kg) (kg) HbA1c (%) (mmol/L × μU/mL) (mg/dL) (mg/dL) (mg/dL) (mg/dL)
Original Article
Carter, 2016 3 mo 5:2 (2 d/wk): 400-600 17/14 35 ± 5 61 ± 8 99 ± 16 38 ± 9; 55 ± 11 ND; 7.2 ± 1.3 ND ND ND ND ND
(24) kcal on fasting days
www.obesityjournal.org
CER: 1200-1500 kcal/d 16/16 36 ± 5 62 ± 9 99 ± 15 40 ± 11; 54 ± 9 ND; 7.5 ± 1.4 ND ND ND ND ND
Carter, 2018 12 mo 5:2 (2 d/wk): 500-600 39/31 35 ± 6 61 ± 9 100 ± 19 40 ± 9; 54 ± 10 ND; 7.2 ± 1.2 ND 179 ± 48 47 ± 14 107 ± 43 129 ± 62
(25) kcal on fasting days
CER: 1200-1500 kcal/d 38/29 37 ± 6 61 ± 9 102 ± 17 42 ± 9; 54 ± 10 ND; 7.5 ± 1.4 ND 195 ± 64 46 ± 17 116 ± 50 168 ± 127
Conley, 2018 6 mo 5:2 (2 d/wk): 600 kcal on 0/11 33 ± 2 68 ± 3 99 ± 8 ND 6.0 ± 1.5; ND ND 151 ± 35 45 ± 12 77 ± 31 168 ± 53
(26) fasting days
CER: 600 kcal/d less than 0/12 36 ± 4 67 ± 4 107 ± 17 ND 6.1 ± 1.7; ND ND 166 ± 39 46 ± 12 98 ± 35 212 ± 150
needs
Harvie, 2011 6 mo 5:2 (2 d/wk): 25% energy 53/0 31 ± 5 40 ± 4 82 (78-85) 34 (31-36); 48 4.8 (4.7-4.9); 7 (6-8); 1.5 (1.3-1.8) 197 (189-197) 58 (54-58) 119 (112-127) 106 (88-124)
OBESITY BIOLOGY AND INTEGRATED PHYSIOLOGY
(27) intake on fasting days (46-49) ND
CER: 25% energy restric- 54/0 31 ± 5 40 ± 4 84 (80-89) 35 (32-39) 4.8 (4.6-4.9) 7 (6-9) 200 (193-208) 62 (54-66) 119 (108-127) 115 (97-124)
tion every day
Harvie, 2013 3 mo 5:2 (2 d/wk): 30% energy 37/0 30 ± 4 46 ± 8 79 (75-84) 31 (28-34); 49 4.9 (4.7-5.0); 6 (5-8); 1.6 (1.3-1.9) 204 (191-229) 50 (49-59) 128 (116-139) 88 (75-102)
(28) intake on fasting days (46-51) 5.3 (5.2-5.4)
CER: 25% energy restric- 40/0 32 ± 6 48 ± 8 86 (81-91) 36 (32-39); 50 5.0 (4.8-5.1) 7 (6-9) 205 (193-218) 51 (48-55) 129 (118-139) 97 (83-111)
tion every day (48-52)
Headland, 12 mo 5:2 (2 d/wk): 500/600 kcal 97/21 33 ± 5 48 ± 15 90 ± 17 42 ± 11; 48 ± 9 5.6 ± 0.6; ND ND 224 ± 43 58 ± 19 155 ± 39 115 ± 80
2019 (29) (F/M) on fasting days
CER: 1000-1200 kcal/d 85/19 33 ± 5 52 ± 13 92 ± 17 43 ± 11; 5.5 ± 0.6; ND ND 213 ± 43 54 ± 15 151 ± 43 115 ± 71
(F/M) 50 ± 10
Schübel, 2019 3 mo 5:2 (2 d/wk) : 25% energy 24/25 32 ± 4 49 ± 9 96 ± 16 ND 5.2 ± 0.4; ND 12 ± 5 2.7 ± 1.3 205 ± 31 54 ± 14 125 ± 22 130 ± 84
(30) intake on fasting days
CER: 20% energy restric- 24/25 31 ± 4 51 ± 8 93 ± 16 ND 5.2 ± 0.4; ND 13 ± 7; 3.0 ± 1.7 203 ± 39 56 ± 16 123 ± 32 121 ± 66
tion every day
Sundfør, 2018 6 mo 5:2 (2 d/wk): 400/600 kcal 26/28 35 ± 4 50 ± 10 109 ± 16 ND 5.8 ± 1.2; ND 192 ± 35 47 ± 13 126 ± 32 162 ± 73
(31) (F/M) energy intake on 5.6 ± 0.7
fasting days
CER: 400/600 kcal/d (F/M) 30/28 35 ± 4 48 ± 12 108 ± 16 ND 5.7 ± 0.7; ND 197 ± 34 45 ± 10 133 ± 32 137 ± 60
less than needs 5.5 ± 0.5
Coutinho, 2017 3 mo ADF (3 d/wk): 550-660 10/4 36 ± 3 39 ± 11 107 ± 14 47 ± 8; 60 ± 12 ND ND ND ND ND ND
(32) kcal on fasting days
CER: 33% energy restric- 12/2 35 ± 4 39 ± 9 98 ± 13 43 ± 8 55 ± 9 ND ND ND ND ND ND
tion every day
Hutchison, 2 mo ADF (3 d/wk): 30% of 25/0 32 ± 1 49 ± 2 89 ± 3 ND 4.9 ± 0.1; ND 19.5 ± 1.5; ND 186 ± 4 54 ± 4 112 ± 4 106 ± 9
2019 (33) baseline energy restric-
tion per week
CER: 30% energy restric- 26/0 33 ± 1 51 ± 2 88 ± 3 ND 4.9 ± 0.1; ND 15.5 ± 1.3; ND 189 ± 4 54 ± 4 116 ± 4 115 ± 9
tion every day
Obesity | VOLUME 29 | NUMBER 1 | JANUARY 2021
Obesity
111TABLE 1 (continued).
Fasting Fasting insu-
Obesity
glucose lin (μU/mL); Total
Author, year Samples BMI FM; FFM (mmol/L); HOMA-IR cholesterol HDL-C LDL-C TG
(reference) Duration Study group (F/M) (kg/m2) Age (y) Weight (kg) (kg) HbA1c (%) (mmol/L × μU/mL) (mg/dL) (mg/dL) (mg/dL) (mg/dL)
Trepanowski, 6 mo ADF (3 d/wk): 25% energy 30/4 34 ± 4 40 ± 10 95 ± 13 38 ± 7 55 ± 9 5.1 ± 0.7; ND 16 ± 14; 3.7 ± 3.6 188 ± 35 57 ± 14 111 ± 13 101 ± 59
2017 (34) intake on fasting days
CER: 25% energy restric- 29/6 35 ± 4 43 ± 12 101 ± 16 40 ± 7; 58 ± 12 5.1 ± 1; ND 20 ± 18; 5.1 ± 5.9 184 ± 35 53 ± 11 112 ± 31 97 ± 27
tion every day
Participants in the IER groups attended final appointments after at least one habitual eating day in an attempt to avoid any potential acute effects.
ADF, alternate-day fasting; CER, continuous energy restriction; F, female; FM, fat mass; FFM, fat-free mass; HbA1c, glycated hemoglobin; HDL-C, high density lipoprotein cholesterol; HOMA-IR, homeostatic model assessment
of insulin resistance; LDL-C, low-density lipoprotein cholesterol; M, male; NA, no data; TG, triglycerides.
112 Obesity | VOLUME 29 | NUMBER 1 | JANUARY 2021
(Supporting Information Figures S4A and S4D)
Figure 2 Risk-of-bias graph. [Color figure can be viewed at wileyonlinelibrary.com]
not change significantly over the course of the studies in either group
subgroup analysis by sex, it was not found that there was a significant
−0.22 mmol/L × µU/mL; 95% CI: −0.40 to −0.04; P = 0.02) with IER
decreased significantly after excluding one RCT (30). The sensitivity
The heterogeneity of HOMA-IR and fasting insulin was high, and it
those in CER groups. However, when Schübel et al. (30) conducted
included only women with overweight or obesity, suggested that fasting
(Supporting Information Figures S4B-S4C). Two RCTs (27,28), which
μU/mL; 95% CI: −1.81 to −0.47; P = 0.0008) and HOMA-IR (WMD:
insulin and HOMA-IR in the IER groups were significantly lower than
analysis showed a significant reduction in fasting insulin (WMD: −1.14
Intermittent vs. Continuous Energy Restriction He et al.
www.obesityjournal.orgOriginal Article Obesity
OBESITY BIOLOGY AND INTEGRATED PHYSIOLOGY
Figure 3 Meta-analysis of the effect of intermittent energy restriction (IER) versus continuous energy restriction (CER) on weight loss (subgroups by intervention). [Color
figure can be viewed at wileyonlinelibrary.com]
decrease in fasting insulin and HOMA-IR in female participants in the participants from the IER group withdrew from the study because of
IER group. headache brought on by hunger (22). Hypoglycemia (8 mmol/L) occurred in 12% to 17% and 6%
Cardiovascular risk markers. Most studies did not show to 22%, respectively, because of diet and medication adjustment in
significant effects of IER on lipids (25-31,33,34), systolic blood patients with diabetes, with no differences between groups (24,25).
pressure (26-28,31,33,34), diastolic blood pressure (26,27,31,33,34), When participants, especially those with T2DM, begin their clinical
or C-reactive protein (CRP) (27,30,31,33,34). Trepanowski et al. (33) trials, specific attention should be paid to medication adjustment,
found that the level of high-density lipoprotein cholesterol increased frequency of glucose monitoring, and fluid intake to prevent
significantly in the ADF group after 6 months of intervention, and hypoglycemic events and hypotension (36). Hoddy et al. (37) found
there was no statistical difference between the two groups after that depression and binge eating decreased after 8 weeks of ADF,
12 months of intervention. Hutchison et al. (34) revealed that lipids with no exacerbating disordered eating.
in the ADF group were significantly lower than those in the CER
group after 8 weeks of intervention. Moreover, Conley et al. (26)
showed that the two interventions can significantly reduce systolic
blood pressure, whereas the reduction in diastolic blood pressure was Discussion
not significant. Summary of main findings
There is a marginally greater loss of weight but a higher loss of FFM
Safety. No major adverse events were reported in either group and no difference in the percentage lost as FFM with short-term IER
(Supporting Information Table S3). We found that the probability (2-3 d/wk). Weight loss has been shown to reduce all-cause, cardio-
of side effects was small, but they were more likely to occur in vascular, and cancer mortality in clinical studies. Sensitivity analysis
the IER groups. In the CER groups (24,25,27,28,30,31), 2% to showed a significant reduction in fasting insulin with IER.
7% reported mild nausea, dizziness, feeling cold, constipation,
lack of concentration, being preoccupied with food, mood swings
or bad temper, mild headache, and decreased energy levels. Of Effects of IER on weight loss
participants in the 5:2 diet, 27.3% reported constipation (26), 11% Our included studies attempted to match for calorie restriction with
reported dizziness (28), 54.5% reported hunger (27), 20% reported IER and CER, not including time-restricted feeding. The long-term
mild headache (28), 2% reported temporary sleep disturbance (28), effects on weight loss with IER versus CER were consistent with
and 5% reported bad breath on energy-restricted days (25). The findings of previous reviews (11-16). The short-term effects of IER
hunger could be improved over time for most participants, but two were superior to those of CER. A median of 59 days was required
www.obesityjournal.org Obesity | VOLUME 29 | NUMBER 1 | JANUARY 2021
113Obesity Intermittent vs. Continuous Energy Restriction He et al.
in IER, compared with 73 days in CER, to achieve 5% weight loss reviews, and our meta-analysis showed no significant difference be-
in the Antoni et al. trial (38). However, the mechanistic reason for tween groups.
this remains unclear. A greater adherence and spontaneous energy
restriction on feeding days with IER during the short term may play
a role. Patients with overweight or obesity lose more than 5% of Strengths and limitations
weight, which can significantly reduce blood lipids, blood sugar, and This study is unique in that it focused on 5:2 and ADF diets, and not
blood pressure. on time-restricted feeding, and compared these with matched CER. In
addition, the various sensitivity analyses we have carried out included
short- and long-term studies. Moreover, we assessed the reduction of
Other anthropometric measures weight, FM, and FFM not only in terms of absolute values but also in
Our results showed a significant reduction in FFM in the short term, terms of relative values. The limited follow-up, small sample sizes, high
but this reduction did not differ significantly between groups when dropout rates, high risk of performance bias, enrollment of metaboli-
expressed as the percentage of weight lost. Harris et al. (14) reported cally healthy individuals or well-controlled patients with T2DM and
a significant reduction in FM for IER in comparison with CER, but overweight or obesity, different methods of measuring FM and FFM,
Cioffi et al. (13) and Roman et al. (16) found no significant difference and other methodological problems limit the generalizability of these
between groups. Roman et al. (16) found that FFM was significantly results. Furthermore, that many of the serum markers were measured
lower with IER, yet there was no significant difference in the studies immediately after restricted days may be linked to the potential acute
by Cioffi et al. (13) and Harris et al. (14). Although body independence effects.
analysis is relatively simple, quick, relatively inexpensive, and nonin-
vasive, this method is prone to error when there are fluctuations in body
water content (39). Furthermore, it is likely to overestimate reductions
in FFM in comparison with dual x-ray absorptiometry because of dehy- Conclusion
dration caused by ketone production during fasting (40), so participants
This systematic review shows that IER is a viable alternative to CER
were asked to drink water and empty their bladder before the weight
for many patients. Further RCTs with longer follow-up are required to
and impedance measurements (28). Bhutani et al. (41) stated that FFM
draw solid conclusions.O
can be retained in the combination of ADF plus moderate-intensity ex-
ercise. Further research is needed to verify whether resistance training Funding agencies: This study was supported by grants from the National Natural
can effectively slow or stop the loss of FFM typically seen in individu- Science Funds of China (81760168) and the Jiangxi Provincial Graduate Innovation
als following energy restriction (42). Foundation of China (YC2018-S101).
Disclosure: The authors declared no conflict of interest.
Effects of IER on fasting insulin and related values Author contributions: JX participated in the conception and design of the study,
Sensitivity analysis showed a significant reduction in fasting insulin manuscript writing, and revision. SH participated in the data collection, data analysis,
interpretation of the findings of the study, manuscript writing, and revision. JW and JZ
and HOMA-IR with IER in the population without diabetes, and the
designed the study and contributed to the introduction and the discussion. All authors
statistical heterogeneity of effects across RCTs in fasting insulin and read and approved the final manuscript.
HOMA-IR were high. One possible explanation may be that the two en-
ergy-restricted days were consecutive in the Harvie et al. trials (27,28) Supporting information: Additional Supporting Information may be found in the
online version of this article.
but were nonconsecutive in the Schübel et al. trial (30). The result was in
line with those of the previous meta-analyses (13,14). Although there was
a significant increase in insulin sensitivity, blood glucose, blood pressure, References
1. Afshin A, Forouzanfar MH, Reitsma MB, et al. Health effects of overweight and obesity
and blood lipids between the two groups did not improve significantly. in 195 countries over 25 years. N Engl J Med 2017;377:13-27.
Therefore, it was considered that the metabolic improvement between 2. Singh GM, Danaei G, Farzadfar F, et al. The age-specific quantitative effects of meta-
the two diets was similar, and it is necessary to further expand the sample bolic risk factors on cardiovascular diseases and diabetes: a pooled analysis. PLoS One
2013;8:e65174. doi:10.1371/journal.pone.0065174
size and intervention duration in order to obtain more abundant results. 3. Michishita R, Matsuda T, Kawakami S, et al. Long-term body weight gain after maturity
Studies have shown that reducing fasting insulin in the circulatory sys- is associated with the incidence of chronic kidney disease (CKD), independent of cur-
tem by 25% to 34% can significantly increase insulin sensitivity, reduce rent body weight, in middle-aged and older men. J Epidemiol 2019;29:213-219.
4. Hashimoto Y, Hamaguchi M, Fukuda T, Obora A, Kojima T, Fukui M. Weight gain since
fasting blood glucose, and prolong the life of mice (43). The increase in age of 20 as risk of metabolic syndrome even in non-overweight individuals. Endocrine
insulin sensitivity is thought to be related to the increase of adenosine 2017;58:253-261.
monophosphate kinase during fasting (44). Moreover, it was found that 5. Lauby-Secretan B, Scoccianti C, Loomis D, Grosse Y, Bianchini F, Straif K. Body fatness
and cancer-viewpoint of the IARC working group. N Engl J Med 2016;375:794-798.
beta islet cells can regenerate during fasting (45). On the basis of these 6. Messier SP. Weight gain and incident knee osteoarthritis in asymptomatic at risk patients:
data, we guess that it may be able to prevent or slow diabetic disease (46). a step closer to primary prevention trials. Osteoarthritis Cartilage 2015;23:501-502.
7. Tremmel M, Gerdtham UG, Nilsson PM, Saha S. Economic burden of obesity: a sys-
tematic literature review. Int J Environ Res Public Health 2017;14:435. doi:10.3390/
ijerph14040435
Cardiovascular risk markers 8. Ma C, Avenell A, Bolland M, et al. Effects of weight loss interventions for adults who
Our study found that IER and CER had similar effects on improving are obese on mortality, cardiovascular disease, and cancer: systematic review and me-
blood lipids, blood pressure, and WC, as was found in previous stud- ta-analysis. BMJ 2017;359:j4849. doi:10.1136/bmj.j4849
9. Ramage S, Farmer A, Eccles KA, McCargar L. Healthy strategies for successful
ies (13-16). Because many participants had normal blood lipids and weight loss and weight maintenance: a systematic review. Appl Physiol Nutr Metab
blood pressure at baseline, it was not surprising that most metabolic 2014;39:1-20.
risk indicators were unchanged. The CRP level was considered as a 10. Kahan S. Overweight and obesity management strategies. Am J Manag Care 2016;22
(7 suppl):s186-s196.
marker of inflammation and a predictor of cardiovascular risk (47). 11. Ryan D, Heaner M. Guidelines (2013) for managing overweight and obesity in adults.
There were no data on CRP changes in previous meta-analyses or Preface to the full report. Obesity (Silver Spring) 2014;22(suppl 2):S1-S3.
114 Obesity | VOLUME 29 | NUMBER 1 | JANUARY 2021 www.obesityjournal.orgOriginal Article Obesity
OBESITY BIOLOGY AND INTEGRATED PHYSIOLOGY
12. Middleton KR, Anton SD, Perri MG. Long-term adherence to health behavior change. 29. Headland ML, Clifton PM, Keogh JB. Effect of intermittent compared to continuous
Am J Lifestyle Med 2013;7:395-404. energy restriction on weight loss and weight maintenance after 12 months in healthy
13. Cioffi I, Evangelista A, Ponzo V, et al. Intermittent versus continuous energy restriction overweight or obese adults. Int J Obes (Lond) 2019;43:2028-2036.
on weight loss and cardiometabolic outcomes: a systematic review and meta-analy- 30. Schübel R, Nattenmuller J, Sookthai D, et al. Effects of intermittent and continuous
sis of randomized controlled RCTs. J Transl Med 2018;16:371. doi:10.1186/s12967- calorie restriction on body weight and metabolism over 50 wk: a randomized controlled
018-1748-4 trial. Am J Clin Nutr 2018;108:933-945.
14. Harris L, Hamilton S, Azevedo LB, et al. Intermittent fasting interventions for treat- 31. Sundfør TM, Svendsen M, Tonstad S. Effect of intermittent versus continuous energy
ment of overweight and obesity in adults: a systematic review and meta-analysis. JBI restriction on weight loss, maintenance and cardiometabolic risk: a randomized 1-year
Database System Rev Implement Rep 2018;16:507-547. trial. Nutr Metab Cardiovasc Dis 2018;28:698-706.
15. Headland M, Clifton PM, Carter S, Keogh JB. Weight-loss outcomes: a systematic re- 32. Coutinho SR, Halset EH, Gasbakk S, et al. Compensatory mechanisms activated with
view and meta-analysis of intermittent energy restriction RCTs lasting a minimum of 6 intermittent energy restriction: a randomized control trial. Clin Nutr 2018;37:815-823.
months. Nutrients 2016;8:354. doi:10.3390/nu8060354 33. Trepanowski JF, Kroeger CM, Barnosky A, et al. Effect of alternate-day fasting on
16. Roman YM, Dominguez MC, Easow TM, Pasupuleti V, White CM, Hernandez AV. weight loss, weight maintenance, and cardioprotection among metabolically healthy
Effects of intermittent versus continuous dieting on weight and body composition in obese adults: a randomized clinical trial. JAMA Intern Med 2017;177:930-938.
obese and overweight people: a systematic review and meta-analysis of randomized 34. Hutchison AT, Liu B, Wood RE, et al. Effects of intermittent versus continuous energy
controlled RCTs. Int J Obes (Lond) 2019;43:2017-2027. intakes on insulin sensitivity and metabolic risk in women with overweight. Obesity
17. Harris L, McGarty A, Hutchison L, Ells L, Hankey C. Short-term intermittent energy (Silver Spring) 2019;27:50-58.
restriction interventions for weight management: a systematic review and meta-analysis. 35. Carter S, Clifton PM, Keogh JB. The effect of intermittent compared with continuous
Obes Rev 2018;19:1-13. energy restriction on glycaemic control in patients with type 2 diabetes: 24-month fol-
18. Antoni R, Johnston KL, Collins AL, Robertson MD. Effects of intermittent fasting on low-up of a randomised noninferiority trial. Diabetes Res Clin Pract 2019;151:11-19.
glucose and lipid metabolism. Proc Nutr Soc 2017;76:361-368. 36. Grajower MM, Horne BD. Clinical management of intermittent fasting in patients with
19. Harvie MN, Howell T. Could intermittent energy restriction and intermittent fasting diabetes mellitus. Nutrients 2019;11:873. doi:10.3390/nu11040873
reduce rates of cancer in obese, overweight, and normal-weight subjects? A summary of 37. Hoddy KK, Kroeger CM, Trepanowski JF, Barnosky AR, Bhutani S, Varady KA.
evidence. Adv Nutr 2016;7:690-705. Safety of alternate day fasting and effect on disordered eating behaviors. Nutr J
20. Liberati A, Altman DG, Tetzlaff J, et al. The PRISMA statement for reporting 2015;14:44. doi:10.1186/s12937-015-0029-9
systematic reviews and meta-analyses of RCTs that evaluate health care interven- 38. Antoni R, Johnston KL, Collins AL, Robertson MD. Intermittent v. continuous energy
tions: explanation and elaboration. PLoS Med 2009;6:e1000100. doi:10.1371/journ restriction: differential effects on postprandial glucose and lipid metabolism following
al.pmed.1000100 matched weight loss in overweight/obese participants. Br J Nutr 2018;119:507-516.
21. Catenacci VA, Pan Z, Ostendorf D, et al. A randomized pilot study comparing zero-calo- 39. Schoenfeld BJ, Nickerson BS, Wilborn CD, et al. Comparison of multifrequency bio-
rie alternate-day fasting to daily caloric restriction in adults with obesity. Obesity (Silver electrical impedance vs. dual-energy x-ray absorptiometry for assessing body compo-
Spring) 2016;24:1874-1883. sition changes after participation in a 10-week resistance training program. J Strength
22. Higgins JP, Altman DG, Gotzsche PC, et al. The Cochrane Collaboration’s tool for as- Cond Res 2020;34:678-688.
sessing risk of bias in randomised RCTs. BMJ 2011;343:d5928. doi:10.1136/bmj.d5928 40. Sadikot S, Jothydev K, Zargar AH, Ahmad J, Arvind SR, Saboo B. Clinical practice
23. Higgins JP, Thompson SG, Deeks JJ, Altman DG. Measuring inconsistency in me- points for diabetes management during RAMADAN fast. Diabetes Metab Syndr
ta-analyses. BMJ 2003;327:557-560. 2017;11(suppl 2):S811-S819.
24. Carter S, Clifton PM, Keogh JB. The effects of intermittent compared to continuous en- 41. Bhutani S, Klempel MC, Kroeger CM, Trepanowski JF, Varady KA. Alternate day fast-
ergy restriction on glycaemic control in type 2 diabetes; a pragmatic pilot trial. Diabetes ing and endurance exercise combine to reduce body weight and favorably alter plasma
Res Clin Pract 2016;122:106-112. lipids in obese humans. Obesity (Silver Spring) 2013;21:1370-1379.
25. Carter S, Clifton PM, Keogh JB. Effect of intermittent compared with continuous en- 42. Tinsley GM, Willoughby DS. Fat-free mass changes during ketogenic diets and the po-
ergy restricted diet on glycemic control in patients with type 2 diabetes: a random- tential role of resistance training. Int J Sport Nutr Exerc Metab 2016;26:78-92.
ized noninferiority trial. JAMA Netw Open 2018;1:e180756. doi:10.1001/jamanetwor 43. Templeman NM, Flibotte S, Chik J, et al. Reduced circulating insulin enhances insulin
kopen.2018.0756 sensitivity in old mice and extends lifespan. Cell Rep 2017;20:451-463.
26. Conley M, Le Fevre L, Haywood C, Proietto J. Is two days of intermittent energy restric- 44. Anton SD, Moehl K, Donahoo WT, et al. Flipping the metabolic switch: understanding
tion per week a feasible weight loss approach in obese males? A randomised pilot study. and applying the health benefits of fasting. Obesity (Silver Spring) 2018;26:254-268.
Nutr Diet 2018;75:65-72. 45. Cheng CW, Villani V, Buono R, et al. Fasting-mimicking diet promotes Ngn3-driven
27. Harvie MN, Pegington M, Mattson MP, et al. The effects of intermittent or continuous beta-cell regeneration to reverse diabetes. Cell 2017;168:775-788.
energy restriction on weight loss and metabolic disease risk markers: a randomized RCT 46. Barnosky AR, Hoddy KK, Unterman TG, et al. Intermittent fasting vs daily calorie
in young overweight women. Int J Obes (Lond) 2011;35:714-727. restriction for type 2 diabetes prevention: a review of human findings. Transl Res
28. Harvie M, Wright C, Pegington M, et al. The effect of intermittent energy and carbo- 2014;164:302-311.
hydrate restriction v. daily energy restriction on weight loss and metabolic disease risk 47. Choi J, Joseph L, Pilote L. Obesity and C-reactive protein in various populations: a
markers in overweight women. Br J Nutr 2013;110:1534-1547. systematic review and meta-analysis. Obes Rev 2013;14:232-244.
www.obesityjournal.org Obesity | VOLUME 29 | NUMBER 1 | JANUARY 2021
115You can also read