Tesmec Group STAR Conference 2021 - Teleborsa
←
→
Page content transcription
If your browser does not render page correctly, please read the page content below

Tesmec Group STAR Conference 2021
Index

        0. Tesmec Group at a glance
        1. Key market trends & strategy
        2. 2020 Business highlights & Results
        3. Outlook
        4. ANNEX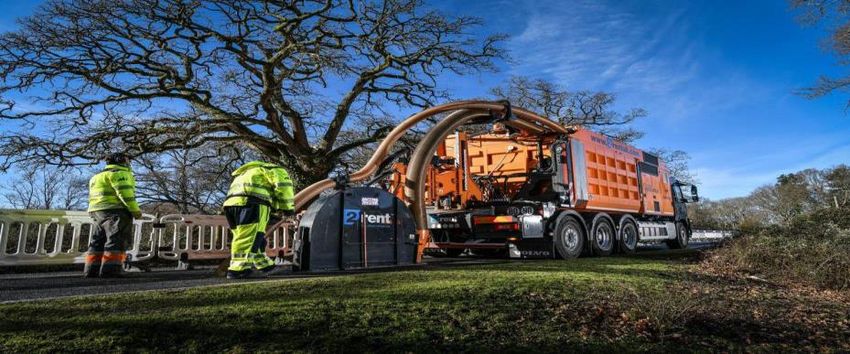
0. Tesmec Group at a glance

Integrated Solutions Provider for Energy and Data transport

                                                   PURPOSE

Consolidate the position as a solution provider in the reference markets driven by the
           trends of energy transition, digitalization, and sustainability.

Vision                          Mission                  Value proposition       Strategy

To be a technological           To operate in the        To supply added-value   ▪ Innovation
partner in a changing           market of                integrated solutions
world                           infrastructure for the   for our customers       ▪ Integration
                                transport of energy,                             ▪ Internationalization
                                data and material (oil
                                and derivatives, gas,
                                water).

                                                                            ENERGY AND DATA
                                                                                 TRANSPORT

2021 | Corporate Presentation                                                                             4
History of Innovation

                                                                                                                                       Strengthening
                                                                                                                                       the Service and
                                              From               Expansion                                                             Rental Business
                                                                                                 Investments &
                                              FAMILY             strategy in
                                                                                                 acquisitions to
                                              Company            the
                                 TRENCHER to PUBLIC                                              complete the
                                                                 RAILWAY BUSINESS
                                 product line Company                                            portfolio for
                                                                 business MODEL
                                 development                                                     SMART GRIDS
                                                                             INTEGRATION
                                                                             solutions &                          Investments in
           PIONEER in                                                                                             R&D and
                                                                             service
           STRINGING                                                                                              DIAGNOSTICS
                                                                             provider
           solutions

                                                                                                                                                        2021
                                                                                                                                        2020
                                                                                                                   2018                 4Service, a
                                                                                                                                        Company         ENERGY TRANSITION
                                                                                                  2017             Opening of the
                                                                                                                   new Tesmec Rail
                                                                                                                                        dedicated to
                                                                                                                                        the rental
                                                                                                                                                        DIGITALIZATION
                                                                                                                                                        SUSTAINABILITY
                                                                                2015              Tesmec
                                                                                                  Automation as
                                                                                                                   s.r.l. production
                                                                                                                   site (Monopoli –
                                                                                                                                        business

                                                                  2012          Acquisition of    a single         Italy)               Change in
                                                  2010            Leasing of
                                                                                the French
                                                                                Group Marais
                                                                                                  Company                               share Capital

                                 1984                             AMC2 S.r.l
             1960                Establishment
                                                  Entry in the
                                                  Italian
                                                                  (Monopoli -
                                                                  Italy)
             Edison patent for   of Tesmec USA    Stock
                                                  Exchange
1951         the new tension
             stringing system
                                 Inc. in Texas,
                                 USA              (STAR
                                                  segment)
Establishment of
“CRF -Officina
Meccanica di
Precisione”
                                                                                                                                                                     5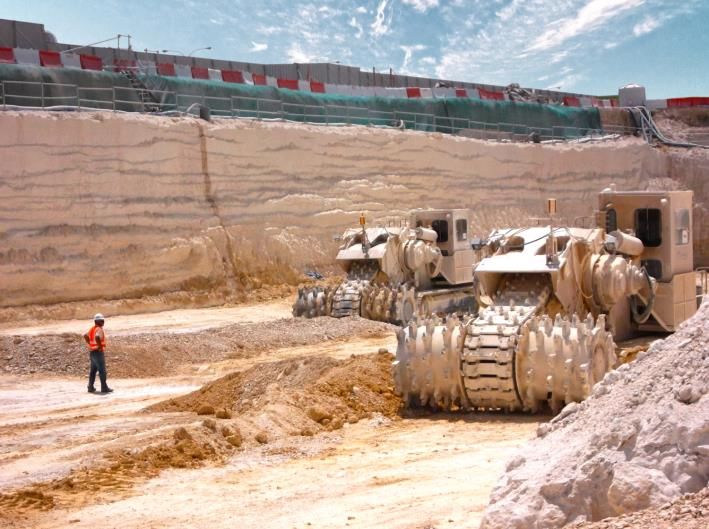
Tesmec Group at a glance

ENERGY - STRINGING                                                                    RAILWAY

                                      70              +900                 9
                                      YEARS              PEOPLE       MANUFACTURING
                                   of experience                         PLANTS

▪ Solutions for power lines                                                           ▪ Catenary lines construction &
  construction & maintenance                                                            maintenance
▪ Advanced methodologies for                                                          ▪ Diagnostic vehicles and systems
  automating jobsite
                                                                                      ▪ Integrated platform for safe
▪ Zero emissions machines                                                               infrastructure

ENERGY AUTOMATION                                                                     TRENCHER

▪ Telecommunications solutions
                                                                                      ▪ Telecom networks, FTTH &
  for HV Grids
▪ Grid Management: protection
  and metering solutions
                                              +135                75%                   long distance, power cable
                                                                                        installation
                                             COUNTRIES            EXPORT              ▪ Oil & Gas, Water pipelines
▪ Advanced sensors for fault                 choose Tesmec                            ▪ Bulk excavation, Quarries &
  passage indication, protection
                                                                                        Surfaces mining
  and monitoring
2021 | Corporate Presentation                                                                                             6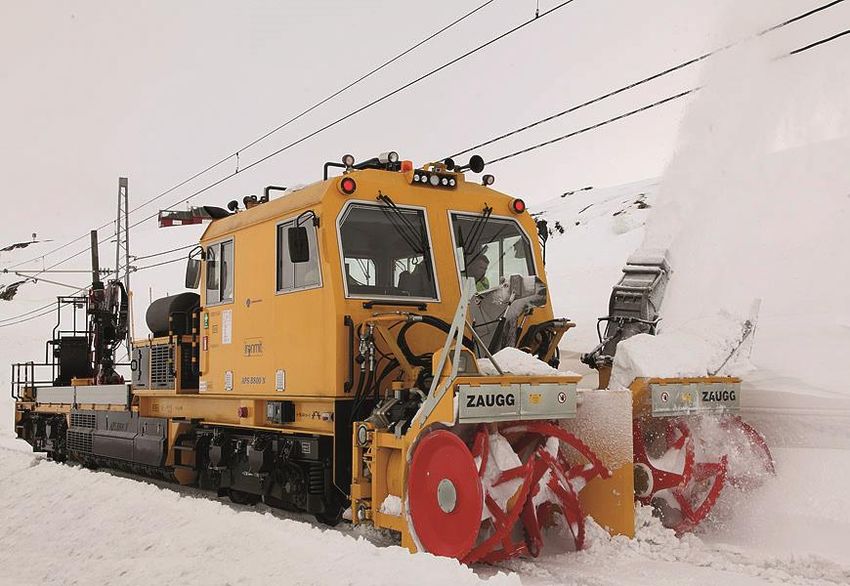
2020 Financial Highlights

REVENUES                       EBIT                EBITDA                     NFP                   BACKLOG

172.8                       -0.6                  22.9                       104.4                282.4
          M€                     M€                     M€                    M€                          M€
     proforma                proforma                 proforma

         2020PF Revenues                   2020PF Revenues                           2020PF EBITDA

 Italy             BRICs and Oceania       Trencher                                 Trencher
 Europe            Africa                  Energy Automation and Stringing          Energy Automation and Stringing
 Middle East       North-Central America   Rail                                     Rail

                                                                                                                      7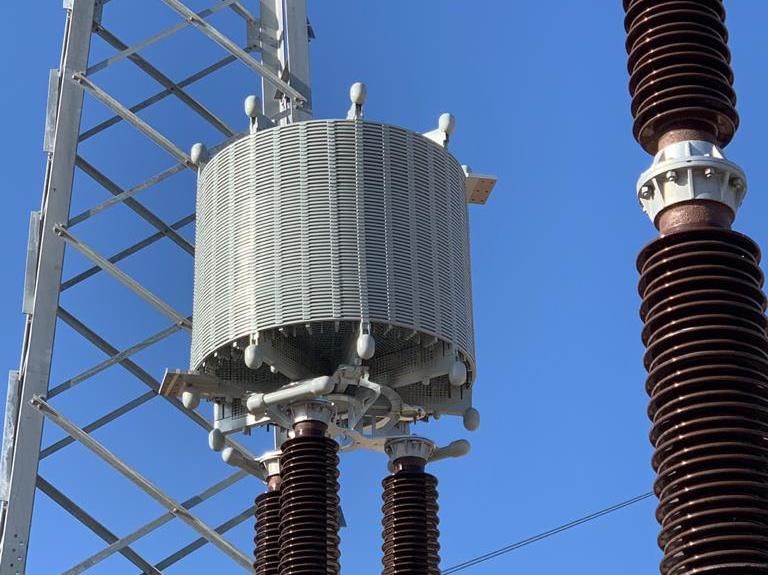
1. Key market trends & strategy
Corporate strategy

      INVESTMENT &                   2020-2023
     DIVERSIFICATION        THE NEXT DEVELOPMENTS

                       New Business Model
                       ▪ INTEGRATED SYSTEMS
                       ▪ DIGITAL SOLUTIONS
                       ▪ FULL SERVICES

                         to increase recurring revenue streams

                                  Strategic drivers
                                  ▪ DIGITALISATION
                                  ▪ SUSTAINABILITY
                                  ▪ ENERGY TRANSITION

                                                                 9
Green and Digital Technology trends drive market opportunities
Sector BU Main markets Market growth Key growth drivers
Power grid ▪ Environmental issues and greater focus on energy saving and
ENERGY ENERGY 23%* efficiency
2019-2040
& ▪ Faster growth of renewables in the electricity sector
Smart Grid CAGR
▪ Trends related to electrification (e.g. electric cars) and
RENEWABLES TRENCHER 11.8%
2019-2025 cybersecurity
TELECOM ENERGY CAGR ▪ Increase in internet users and demand for high-speed internet
& 5% ▪ Growth in demand for improved IT infrastructure, especially in
TRENCHER 2020-2025 emerging economies
FIBRE
ENERGY CAGR ▪ Pushing improvement and safety of existing railways in order to
reduce accidents (Italy and Europe)
RAIL 2.2% ▪ Technical market trends include technologies for alternative
RAIL 2019-2025 traction systems (hybrid, zero emission …)
CAGR ▪ Growing attention to security standards resulting in increase in
SURFACE regulations on the use of explosives
TRENCHER 1.5% ▪ Need for technological changes to increase sustainability while
MINING 2020-2023 reducing operational costs (smart mining)
▪ Demographic boom, new cities or enlargement of existing ones
CONSTRUCTION (Africa and Asia)
TRENCHER n.a.
AND UTILITIES* ▪ Increasing investment in water pipes, irrigation/drainage and
wastewater management
▪ Oil and natural gas price issues
▪ More restrictive regulations on ageing pipelines in developed
PIPELINE TRENCHER n.a. markets
▪ Growing gas demand (Asia- Pacific, Russia, Africa) and need for
additional pipeline capacity
Note: * increase in average annual investment to reach Paris Accord targets compared to current trends
Source: IEA, WEO, 2019
Main Tesmec target sectors Secondary Tesmec target sectors
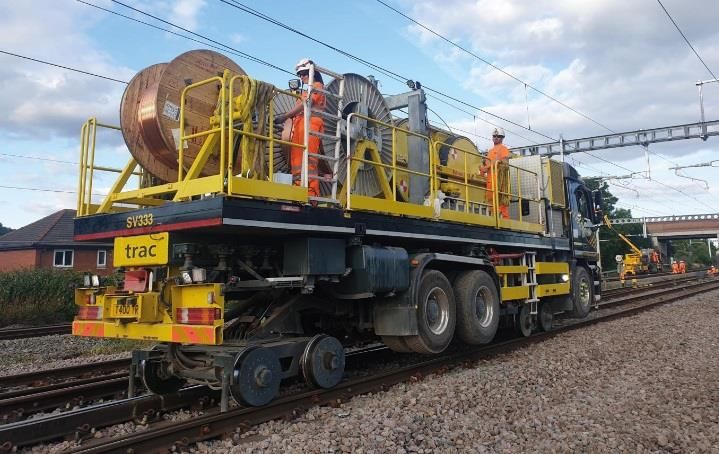
10Energy Stringing
• SOLUTIONS FOR POWER LINES CONSTRUCTION & MAINTENANCE
T&D POWER LINES • ADVANCED METHODOLOGIES FOR AUTOMATING JOBSITE
• ZERO EMISSIONS MACHINES
11Energy - Stringing business
Market attractiveness Technological drivers
• Increasing electricity demand and Renewable Energy • Digitalization of the products’ portfolio, 4.0 Industry
Sources (RES) generation approach
• Important infrastructure investments in “long distance" • Innovative and extremely safe working methodologies for
and "large capacity“ transmission projects with a dramatic power lines refurbishment
increase of underground HV links
• Trends related to sustainability & green approach
• Increasing of maintenance and refurbishment of aging
lines projects in US and Europe
Business model Positioning
Integrated solution provider TESMEC is the first supplier of specialized equipment
for energy infrastructure construction & maintenance
• Supply of complete packages tailor made thanks to:
• Longest warranty period in the industry ▪ A complete digital product range of machines equipped
• Technological support from experienced engineers. with the latest 4.0 technology
• Full training package with professional experts and onsite ▪ An important R&D program based on new methodologies
academy & sustainability
▪ A worldwide sales & after sales network
Client type: Utilities, Main contractors, Sub-contractors,
Maintenance service companies
12Energy Automation - Fields of application
▪ PROTECTION & MONITORING
SMART GRIDS ▪ REMOTE CONTROL
▪ SERVICE TELECOMMUNICATIONS
▪ SMART METERING
13Energy Automation business
Market attractiveness Technological drivers
• Double digit growth rates of Smart Grid investments in • IoT technologies to provide full monitoring and
network infrastructure worldwide diagnostics of electrical systems
• New business models in the energy sector driven by • Integrated Substation Automation Systems based on
digitalization and data analytics unified international standard protocols
• Stronger focus on environmental sustainability and
• Growing pressure on Cyber-security
energy efficiency solutions
• Increasing investments in renewables infrastructure and
new challenges to guarantee continuity of power supply
Business model Positioning
Integrated solution provider TESMEC is an innovative player focused on the design
and development of tailor-made energy solutions thanks to:
• Pre-sales technical analysis ▪ Significant in-house technical know-how
• Direct sales and participation to tenders ▪ Integrated product portfolio, fully complaint with Smart
• Marketing of state-of-the-art products Grids and Cyber-security standard requirements
• Custom design and production ▪ Strong focus on R&D investments
• Engineering solutions
• After-sales on-site assistance Client type: Electrical utilities (DSO and TSO), EPC
contractors, System integrators
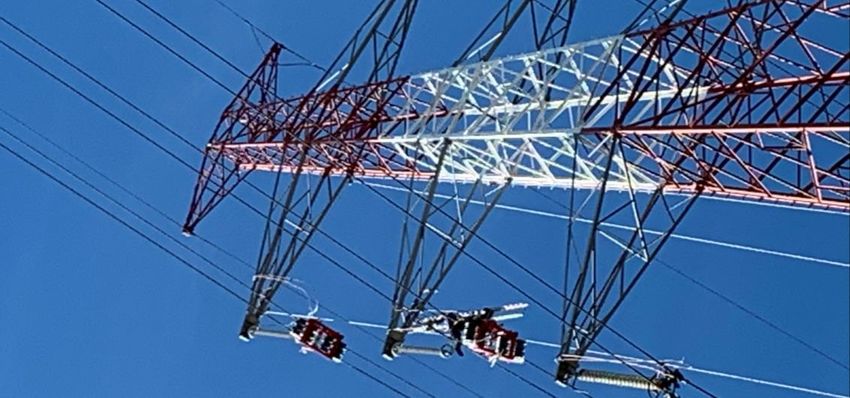
14Trenchers - Fields of application
▪ TELECOM NETWORKS, FTTH & LONG DISTANCE
UNDERGROUND
INFRASTRUCTURES ▪ POWER CABLE INSTALLATION & RENEWABLES ENERGIES
▪ BULK EXCAVATION, QUARRIES & SURFACES MINING
▪ OIL & GAS, WATER PIPELINES
15Trencher business
Market attractiveness Technological drivers
• Favorable legislation (e.g. Ultra-broadband strategic plan; 5G action
plan), increase in internet users and demand for high-speed internet • Clean and Fast excavations with simultaneous laying and
(e.g. E-commerce, mobile payment, smart working) lead to a high
attractiveness of the sector dust suppression
• Relevant investments are expected because of the 5G technology • Substitution of drill & blast technology by trencher
development and the spread of FTTH networks technology due to safety reasons
• Investments in renewables infrastructure are expected to represent
40% of total power investments thanks to policy support and • Need for technological changes to increase
declining technology costs sustainability while reducing operational costs
• Projects in construction phase are growing, signaling expansion of • Cross industries electrification trends
mining activity
Business model Positioning
Full-service provider TESMEC is a leading player with an advanced solution
range:
• Pre-sales consultancy, feasibility studies and geological ▪ Integrated business model sales + rent + services
analyses ▪ Complete machine range for several applications
• Custom design and manufacturing ▪ R&D and product development (reliability, resistance,
• Sale, rental without operator (Dry rental) or with operator versatility, user-friendly, digitalization)
(Wet rental)
• On-site training (worker theoretical and practical training) Client type: contractors/sub-contractors, dealers
• After-sale assistance, spare parts sale, on-site
technicians, long term service agreement
16Railway - Fields of application
▪ CATENARY INSTALLATION
RAILWAY LINES ▪ MAINTENANCE OF RAILWAY LINES
▪ DIAGNOSTIC OF RAILWAY INFRASTRUCTURES
▪ SMART PLATFORMS FOR BIG DATA MANAGEMENT
17Railway business
Market attractiveness Technological drivers
• Sustainable energy supply is among the investment drivers across • Digitalization and automation are a major development
EU. The percentage of electrified lines varies between EU
stream that will shape the future of rail infrastructures and
countries and Italy is among the countries with the most electrified
rail infrastructure of maintenance activities
• Investments in maintaining and renewing the existing railway • Pushing improvement and safety of existing railways in
networks have increased in EU in the past years. order to reduce accidents
• Improving safety and operational performance and ensuring a
reliable service are important challenges for the infrastructure
• Technical market trends include technologies for
managers alternative traction systems (hybrid, zero emission …)
• Particular attention to rail investment under the EU financial • AI, digital information sharing and embedded sensors and
framework
telematics
Business model Positioning
Integrated solution provider TESMEC is pioneer in catenary installation, leader in the
maintenance of rail infrastructure and competitive player in
• Participation to tenders (mainly) measuring and diagnostic field:
• European homologation and certification of vehicles
• Custom design and production (adaptations to different • In-house integrated technological know-how
regulations and technical specifications of the customer) • Scalable platform of vehicles with vertical integration
• Technical post-sale assistance • R&D focused on digitalization and electrification
• Ability to perform long term full maintenance services
• Full maintenance services
Client type: National railways, Main contractors, Sub-
contractors
18Business strategy
ENERGY
TRENCHERS RAILWAY
STRINGING ENERGY AUTOMATION
Working vehicles
CLEAN & FAST CERTIFIED as passenger
INNOVATIVE WORKING DIGITAL solutions and SOLUTIONS for trains in EU
METHODOLOGIES for grid Substation Automation underground energy cable
maintenance SYSTEMS and fiber optic networks Advanced technologies for
railway ELECTRIFICATION
Green technologies for CYBERSECURITY DIGITAL & CONNECTED
SUSTAINABLE JOBSITES requirements for Grid systems AUTOMATED & CLOUD
safety CONNECTED vehicles
AUTOMATING process Autonomous Mining
IOT integration for energy machine (SMART Mining) Artificial Intelligence for
for new line construction
data analytics UNMANNED
Complete package of DIAGNOSTIC & BIG DATA
INTEGRATED and VIRTUALIZATION of INTEGRATED SERVICES MANAGEMENT
OPTIMIZED approach to technological application on (sales, wet/dry rental,
underground HV links multi purpose platform training, mapping, survey, Green approach with
fleet management…) HYBRID & BIMODAL
SOLUTIONS
19Sustainability as key strategic driver
The 2020-2023 Business Plan envisages a focus on:
▪ Higher sustainability for the Group’s activities, thanks to more responsible production and consumption behaviour
▪ Contribution to decarbonisation and the smart economy, thanks to offering customers more digital and sustainable products
and solutions
▪ ESG: environment, social and governance
Tesmec’s sustainable development goals chosen from the United Nations’ “2030 Agenda for Sustainable Development”:
GOOD HEALTH AND WELL-BEING INDUSTRY INNOVATION AND RESPONSIBLE CONSUMPTION AND
Ensure healthy lives and promote well-being INFRASTRUCTURE PRODUCTION
for all at all ages Build resilient infrastructure, promote inclusive and Ensure sustainable consumption and production
sustainable industrialisation and foster innovation patterns
AFFORDABLE AND CLEAN ENERGY SUSTAINABLE CITIES AND COMMUNITIES LIFE ON LAND
Ensure access to affordable, reliable, Make cities and human settlements inclusive, safe, Sustainable use of terrestrial ecosystems, sustainably
sustainable and modern energy for all resilient and sustainable manage forests, combat desertification, halt and
reverse land degradation and halt biodiversity loss
▪ New range of electric machines and technologies to increase
TRENCHER
sustainability in the extraction process (“smart mining”) Tesmec’s actions to reduce its
environmental impact:
E ▪ New range of digital machines for a safe and faster jobsite and a full
N STRINGING
E
range of electric machines ▪ Energy efficiency and reduced use of
R polluting materials in the production process
G ENERGY ▪ Solutions to integrate and manage renewable energy sources, and ▪ Waste management and disposal
Y AUTOMATION ▪ Design of new technological solutions driven
to improve the efficiency of electricity networks
by the environmental impact of the use and
▪ R&D for the design of hybrid and full electric vehicles, equipped disposal of products
RAIL
with diagnostic systems to increase infrastructure security
202. 2020 Business highlights & Results
2020 highlights

                                  ▪ Success of share capital increase
CORPORATE                         ▪ New ERP project implementation and go live for Tesmec SpA
                                  ▪ Cost saving actions
                            ENERGY
                                                                            TRENCHERS                         RAILWAY
STRINGING                         ENERGY AUTOMATION

Important growth in               Growth strategy on                  Business model focused on       Consolidation of the
strategic markets:                Transmission market in Italy:       increasing recurring            expertise in the diagnostic
                                                                      revenues:                       field:
▪ US & Australia positive trend   ▪ New systems engineering
                                    approach to offer high added      ▪ Wide offer of services and
  confirmed                                                             cable laying solutions        ▪ award of the RFI tender
                                    value and turnkey solutions for     especially in EU (TLC,          for a total value of 49.8 M€
Machines Improvements:              HV substations                      energy)                         for the supply of diagnostic
▪ Digital 4.0 range becomes       ▪ Increased opportunities for       ▪ Increasing demand of rental     railway vehicles
  the standard                      integrated remote control           equipment instead of CAPEX
                                    systems based on IEC 61850                                        Growing importance of
▪ Growing business on tailor
                                                                      Relevant contracts awarded      recurring business (Full
                                  Push on innovative                  in the renewable energy         Maintenance Service)
  made solutions                                                      field (Australia..)
                                  technologies:
Green innovation & new                                                Great opportunities in West     Solutions for catenary
                                  ▪ Growing business on cyber-
maintenance                         security protection and           Africa in the surface mining    refurbishment (working
methodologies:                      control solutions                 industry (bauxite..)            methodology)
                                                                                                                                  22
2020.FY Closing
Delta vs. Delta Achieved the target communicated during the
2020 2019 process of the share capital increase
GROUP (€ mln) 2020 2019 Proforma vs.
proforma proforma
19-20 19-20
(1) Revenues: (mainly TRS Sales) affected by the
REVENUES (1) 172,8 170,6 199,6 200,7 -13,4% -15,0% actions taken by public authorities to contain
EBITDA (2) (3) 22,9 21,0 30,0 27,4 -23,8% -23,6% the spread of the COVID-19. After the
% on Revenues 13,2% 12,3% 15,0% 13,7% slowdown and lockdown phases, the Group
restarted its activities in May, reaching full
EBIT (4) (0,6) (0,9) 6,4 8,4
operations during June and generate around
% on Revenues -0,3% -0,5% 3,2% 4,2% 100 M€ of revenues in the 2H
Differences in Exchange (5) (3,3) (3,6) (3,6) 0,8
% on Revenues -1,9% -2,1% -1,8% 0,4% (2) EBITDA: negative impact by the drop of TRS
sales and the performance of the railways
PROFIT (LOSS) BEFORE TAX (8,7) (9,0) 2,0 4,2 business due to the production of low
% on Revenues -5,0% -5,3% 1,0% 2,1% margin vehicles. Positive impact thanks to
NET INCOME/(LOSS) (6,5) (6,8) 1,6 3,0 Rental activities with high margin and cosst
% on Revenues -3,8% -4,0% 0,8% 1,5% reduction
Delta vs. Delta (3) Efficiency: Starting from March, the Group
2020 2019
GROUP (€ mln) 2020 2019 Proforma vs. undertook all the necessary actions to
proforma proforma
19-20 19-20 contain its fixed costs. This actions will
NFP ante IFRS 16 82,3 82,3 106,9 98,5 23,0% 16,4% impact the 2H, too. The Group collected all
NFP post IFRS 16 104,4 104,4 130,9 118,0 20,2% 11,5% the possible operating grants in the different
NFP without Share capital Increase 129,1 129,1 130,9 118,0 countries around the world
(4) Impacted by 4service’s fleet depreciation
* The pro-forma results include the result of the 4Service Group on the annual basis, instead of the
(5) Negative impact of Forex losses (USD &
results achieved within the perimeter of the Tesmec Group from the date of first consolidation (April 23,
2020)
related currencies), 3,3 M€ are “not
realized” forex losses.
232020.FY Proforma Closing – Business Breakdown
ENERGY 2020 2019 Delta % > The decrease is related to the lockdown and slowdown in the 1H
Revenues 43,8 44,2 -1,0% > Improved 3Q-4Q resiliency of the Energy sector and the better
performance of the Energy Automation, Euro 10,0 million of
EBITDA 5,3 5,6 -6,2%
revenues in the 2H and a better margin mix
% on Revenues 12,0% 12,6%
> The confirmed order backlog was Euro 76,2 million of which Euro
54,0 million from the Energy Automation
TRENCHERS 2020 2019 Delta % > Drop of the sales in the first half and slowdown of the USA market
of the 2020.Q4, due to political instability linked to the election
Revenues proforma 102,6 125,3 -18,1%
> More impact on TRS sales than rental
EBITDA proforma 14,4 16,6 -13,5%
% on Revenues 14,0% 13,3% > Better % EBITDA thanks to the integration of the rental activities
> The confirmed order backlog was Euro 84,6 million
RAILWAY 2020 2019 Delta % > The decrease is mainly due to the slowdown / lockdown,
mitigated by the relaunch of activities in May and the delay of the
Revenues 26,4 31,1 -15,2%
new tenders acquisition or tenders confirmation with high margin.
EBITDA 3,2 5,2 -38,2% > EBITDA is affected by low margins vehicles
% on Revenues 12,2% 16,8%
> The confirmed order backlog was Euro 121,6 million, thanks the
confirmation of the Euro 50 million of the award of the RFI Tender,
already communicated in the 2021.Q2
24BACKLOG
Euro/mln BACKLOG
(1) Including the confirmed
30/09/2020 Sales 2020.Q4 Intake 2020.Q4 31/12/2020
award of the RFI tender for
the production of diagnostic
vehicles for around Euro 50
77,0 (2) 76,2
million and an RFI order of
Energy 14,6 13,8 revamping activities for Euro
7,5 million
(2) Of which Euro 54 million by
Energy Automation
92,0 84,6
Trencher 34,2
26,8
121,6
69,0 5,0 57,6
Railway
(1)
Total
238,0 53,8 98,2 282,4
252020.FY Revenues: sales spread over different geographical area
INTERNATIONAL SCALE, FOCUS ON EU-USA
IMPORTANCE OF THE ITALIAN MARKET
2020 2019
19% 20%
19% 24%
7%
9%
20%
15% 34%
20%
6% 7%
ITALY: railway business & energy automation impact Italy
Europe
Middle East
BRICs and Oceania
USA&EU: trencher and railway impact
Africa
North-Central America
BRICS: trencher and stringing impact
262020.FY Proforma EBITDA
€ mln
30,0 (0,3) (4,8)
30,0
27,0
(2,0)
22,9
24,0
21,0
18,0
15,0
12,0
9,0
6,0
3,0
0,0
2019 proforma Energy Trencher Railway 2020 proforma
Impacted from the drop of TRS sales in the 1H (partially mitigated by
2019 the rental activities) and from the negative performance of railways 2020
business for the execution of low margin orders.
272020.FY Financial Results
Financial Information (€ mln) 2020 2019
Net Working Capital 64,3 73,0
Non Current assets 76,7 66,8
Right of use - IFRS 16/IAS 17 22,8 20,1
Other Long Term assets/liabilities 10,0 4,2
Net Invested Capital 173,8 164,2
Net Financial Indebtness 82,3 98,5
Lease liability - IFRS 16/IAS 17 22,1 19,5
Equity 69,4 46,2
Total Sources of Financing 173,8 164,2
Decrease of NWC (mainly for the work in progress and receivables
reduction), increase of the asset by the change of Group perimeter
2019 (4Service Group) and decrease of NFP due the decrease of the NWC
2020
and share capital increase
282020.FY Working Capital evolution
90 4,5 (5,1) (7,5)
80
(3,9) 3,3
70
60
50
40 73,0
30 64,3
20
10
0
2019 Inventories WIP Trade Trade Other current 2020
Net Working Receivables Payables ass. / liab. Net Working
capital capital
€ Mln 2020 2020.1H 2019
2020 2019
Trade Receivables 60,4 59,8 67,9 127 122
Inventories 74,4 77,5 69,9 157 125
Work in progress contracts 11,2 17,8 16,3 24 29
Trade Payables (61,4) (50,9) (57,5) -130 -103
Other Current Assets/(Liabilities) (20,4) (21,0) (23,6) -43 -42
Net Working Capital 64,3 83,3 73,0
After the increase of the NWC due to the impact of the Covid 19 in the
2019 2020
1H, the Group recorded a reduction of the inventories and working in
€€ 60,8
73,0mln
mln € 64,3 mln
progress and a better balance of DPO - DSO 292020.FY Net Financial Position Evolution
€ mln NET FINANCIAL POSITION
14,2 143,0 (4,8)
140 3,4 (19,0)
118,0 (2,9) 10,3 9,9 (24,7)
120 104,4
100
80
60
40
20
0
NFP OFCF NWC Capex Change NFP OFCF NWC Capex Share NFP
2019 of Cons. 2020.1H Capital 2020
Area Increase
Impacted by the change of Cons Area and NWC in the 1H, starting from
2019 Q3 NFP has been reducing by the impact of the share capital increase, 2020
the operating cash generation and the reduction of NWC
302020.FY Net Financial Position Evolution
NET FINANCIAL POSITION
€ mln
143,0 137,8
140
123,8 10,2
120 112,5 112,5 115,6 118,0 11,0
119,2 104,4*
100 114,7
105,0 5,9
97,8 99,8
80 92,6 94,1 82,3
60
40
20
0
1Q 2019 1H 2019 9M 2019 2019 1Q 2020 1H 2020 9M 2020 2020
NFP ante IFRS 16 IFRS 16 4service NFP impact
* From 1st January 2019, the new IFRS 16 has been introduced, the impact in term of NFP is around 23,1 M€, otherwise the NFP
would have been around 82,3. Since April the NFP included the financial debt from the acquisition of 4service around 5,9 M€.
313. Outlook
Outlook

            ▪ Booming of specific geographic areas (e.g. Asia Pacific)

            ▪ Positive impact of recovery plans on reference markets of the Group
  MACRO
            ▪ Growth of demand, increasing suppling process, higher logistic costs and
 ECONOMIC
              commodities, shortage of materials
 SCENARIO
            ▪ Stronger foreign currencies (USD..)

            ▪ Stable interest rates thanks to the incentives package

            ▪ 2021 year of the recovery: vaccination plan worldwide

            ▪ Uncertainty in the short term but long-term trends confirmed
 COVID-19
            ▪ Push on specific industry such as Telecommunication and Energy due to the
              increasing need of connectivity and smart infrastructures

                                                                                          33
Outlook 2021
ENERGY
TRENCHERS RAILWAY
STRINGING ENERGY AUTOMATION
Increasing revenues thanks
Expected positive outlook Strong growth perspective Further focus on recurring to:
driven by "Green Deal” on based on high visibility revenues through the offer ▪ Strong backlog (121.6 M€)
key markets such as US, significant market of rental business model
opportunities ▪ Opportunities in EU, tenders
Western Europe and pipeline
Australia Strategic positioning in
Profitability improvement key and growing sectors Higher margins thanks to:
Innovation and coming from such as: ▪ new products in the portfolio
optimization of newly ▪ Product mix ▪ Telecommunication: higher ▪ diagnostic solutions
developed solutions ▪ Economies of scale connectivity request ▪ services growth
▪ Mining: increasing demand
Portfolio rationalization and COVID impact on lead of raw materials R&D and product
industrial planning for stock times and not on new ▪ Renewable: push on green development in line with the
reduction projects energies latest technological trend
(green and diagnostic)
342020-2023 Business Plan guidelines - Confirmed
2019pf 2020pf 2021 2023
199.6 172.8 >> Significant performance of the Energy
TURNOVER M€ M€ ~ 220 M€ Automation segment; Stringing segment back to 275 ~ 290 M€
historical performances
cagr19-23: 8.5%~10.0%
>> Focus on recurring revenues (rental & services)
>> Growth in each business line
>> Better mix of products & systems,
30,0 22,9 premium price policy, impact of new high margin 53 ~ 58 M€
EBITDA M€ M€ >16% activities such as rental and hi-tech solutions
cagr19-23: 17.0%~18.0%
>> Rationalization and standardization of the
products portfolio
>> Broadly stable fixed costs
>> Net working capital improvement and
NFP / 104,4 efficiency actions on inventory
4.4x improvement improvement
EBITDA M€ >> Optimization of credit management policies
>> 2020-2023: Cumulated Capex in 4 years 60
M€, progressive reduction to 5% of the
CAPEX/Revenues
35USE OF PROCEEDS
▪ Financial ratio improvements and rating upgrade, adding further commercial
STRENGTHENING competitiveness
FINANCIAL
STRUCTURE
▪ Net financial position improvement
AUTOMATION
STRINGING
Internationalisation of
ENERGY
Financial contribution
ENERGY
Strengthening of the business activities in the
Group's presence in geographic areas in
North America which the main
customers operate
SPECIAL Revenue increase
BUSINESS from 2021
INITIATIVES TRENCHE
Further push on the rental business Additional 2023
R
UNDER Revenues
EVALUATION ≈21M€
2023 EBITDA margin
Strengthening of diagnostic systems and development of
RAIL technological platforms for the maintenance of railway networks >21%
INVESTMENT PLAN ACCELERATION: RIDING THE WAVE OF GREEN AND DIGITAL TECHNOLOGY
364. ANNEX
Summary 2020.FY Profit & Loss statement - Appendix A

          Profit & Loss Account (Euro mln)        2020      2019     Delta vs 2019   Delta %

          Net Revenues                           170,7     200,7         (30,0)      -15,0%
          Raw materials costs (-)                (77,4)    (88,0)        10,6        -12,1%
          Cost for services (-)                  (30,2)    (35,4)         5,2        -14,8%
          Personnel Costs (-)                    (48,5)    (52,6)         4,1         -7,8%
          Other operating revenues/costs (+/-)    0,2       (4,7)         4,9        -104,4%
          Non recurring revenues/costs (+/-)      0,0       0,0           0,0          na
          Portion of gain/(losses)
          from equity investments evaluated       0,5       0,2           0,3        107,1%
          using the equity method
          Capitalized R&D expenses                5,8       7,2          (1,4)       -20,0%
          Total operating costs                  (149,6)   (173,2)       23,6        -13,6%
          % on Net Revenues                       (88%)     (86%)
          EBITDA                                  21,1      27,4         (6,4)       -23,3%
          % on Net Revenues                       12%       14%
          Depreciation, amortization (-)         (21,8)    (19,1)        (2,8)       14,5%
          EBIT                                    (0,8)     8,4          (9,2)       -109,3%
          % on Net Revenues                       0%        4%
          Net Financial Income/Expenses (+/-)     (8,2)     (4,2)        (4,0)       95,6%
          Taxes (-)                               2,2       (1,2)         3,4        -282,1%
          Minorities                               (0)       (0)         (0,0)
          Group Net Income (Loss)                 (6,8)     3,0          (9,7)         n/a
          % on Net Revenues                      -4,0%     1,5%                                38
Summary 2020.FY Balance Sheet - Appendix B
Balance Sheet (€ mln) 2020 2019
Inventory 74,2 69,9
Work in progress contracts 11,2 16,3
Accounts receivable 60,7 67,9
Accounts payable (-) (61,4) (57,5)
Op. working capital 84,7 96,7
Other current assets (liabilities) (20,4) (23,6)
Net working capital 64,3 73,0
Tangible assets 49,8 42,5
Right of use - IFRS 16/IAS 17 22,8 20,1
Intangible assets 22,5 20,4
Financial assets 4,4 3,9
Fixed assets 99,5 87,0
Net long term liabilities 9,3 4,2
Net invested capital 173,1 164,2
Cash & near cash items (-) (70,4) (17,9)
Short term financial assets (-) (14,5) (12,1)
Lease liability - IFRS 16/IAS 17 22,1 19,5
Short term borrowing 85,8 79,8
Medium-long term borrowing 77,3 48,7
Net financial position 100,3 118,0
Equity 69,5 46,2
Funds 169,8 164,2 39Notes
The pro-forma results were prepared for illustrative purposes only, and were obtained by making appropriate pro-forma adjustments to the historical data to retroactively
highlight the effects of the 4Service Group's transaction, as if this transaction had occurred on 1st January 2020, instead of on 23 April 2020. The pro-forma results therefore
include the result of the 4Service Group on the half-year basis, instead of just the results achieved within the perimeter of the Tesmec Group from the date of first consolidation
(April 23, 2020).
Considering the uncertainty linked to the spread of the COVID-19 virus and the impacts on the global economy, the targets set by the Management may be susceptible to
changes. These targets are set in the assumption that the pandemic situation remains stable and / or better in Europe and that it does not get worse in other areas of the world,
such as the United States and Latin America
The plan doesn’t include any cash in from share capital increase. 50 M€ of credit lines already collected from financial institutions
Disclaimer
The manager responsible for the preparation of the corporate accounting documents, Marco Paredi, declares, pursuant to article 154-bis, paragraph 2, of Legislative Decree No.
58/1998 ("Consolidated Law on Finance") that the information contained in this press release corresponds to the document results, books and accounting records. Note that in
this press release, in addition to financial indicators required by IFRS, there are also some alternative performance indicators (e.g. EBITDA) in order to allow a better
understanding of the economic and financial management. These indicators are calculated according to the usual market practice.
This press release contains some forward looking statements that reflect the current opinion of the Tesmec Group management on future events and financial and operational
results of the Company and of its subsidiaries, as well as other aspects of the Group's activities and strategies. These forward looking statements are based on current
expectations and assessments of the Tesmec Group regarding future events, as well as on the Group's intentions and beliefs. Considering that these forward looking statements
are subject to risk and uncertainty, the actual future results may considerably differ from what is indicated in the above forward looking statements as these differences may
arise from several factors, many of which lie beyond the Tesmec Group’s ability to accurately check and estimate them. Amongst these - including but not limited to - there are
potential changes in the regulatory framework, future developments in the market, price fluctuations and other risks. Therefore, the reader is asked to not fully rely on the
content of the forecasts provided as the final results could significantly differ from those contained in these forecasts for the reasons indicated above. They have been included
only with reference up to the date of the above-mentioned press release. The prospective data are, in fact, forecasts or strategic targets established within the corporate
planning.
The Tesmec Group does not assume any obligation to publicly disclose updates or amendments of the forecasts included regarding events or future circumstances that occur
after the date of the above-mentioned press release. The information contained in this press release is not meant to provide a thorough analysis and has not been independently
verified by any third party. This press release does not constitute a recommendation for investment on the Company’s financial instruments. Furthermore, this press release does
not constitute an offer of sale or an invitation to purchase financial instruments issued by the Company or by its subsidiaries.www.tesmec.com
You can also read