TABCORP HOLDINGS LIMITED - 2019/20 First Half Results Presentation

 
CONTINUE READING
TABCORP HOLDINGS LIMITED - 2019/20 First Half Results Presentation
TABCORP
HOLDINGS LIMITED
2019/20
First Half Results Presentation
for the 6 months ended 31 December 2019

19 FEBRUARY 2020   ABN 66 063 780 709
TABCORP HOLDINGS LIMITED - 2019/20 First Half Results Presentation
TABLE OF CONTENTS

03 – 06      Group Overview

08 – 15      Business Results

17           Capital

19           Conclusion

21 – 28      Appendices
TABCORP HOLDINGS LIMITED - 2019/20 First Half Results Presentation
GROUP RESULT DRIVEN BY EXCELLENT                                                                      REVENUE CONTRIBUTION2
             LOTTERIES PERFORMANCE
                                                                                                                                        5%

         o Group revenue up 4.4% and EBITDA1 up 2.1% vs pcp
                                                                                                                     41%
         o Interim dividend maintained at 11.0 cps, fully franked                                                                                   54%

         o Integration in the final phase

                • EBITDA benefits expected to be $100m in FY20 (previously $90m)

                • On track to deliver FY21 target of $130m-$145m in recurring EBITDA benefits                         Lotteries
                                                                                                                    L&K             W&M
                                                                                                                                        Wagering    Gaming
                                                                                                                                                   GS
                                                                                                                      & Keno            & Media     Services

                • Total one-off integration costs expected to be $135m pre tax (previously $95m)
                                                                                                                   EBITDA CONTRIBUTION2
         o Step change in Lotteries & Keno performance sustained with another excellent result; strong growth in
           both digital and retail; more than 300,000 new registered customers in the past six months
                                                                                                                                  11%
         o Wagering & Media – core TAB business competing well while also transforming in a soft market; uplift
           in UBET performance anticipated once customers benefit from access to the full TAB offering post
           integration
                                                                                                                                                    50%
         o Gaming Services business under review to improve performance, including capital efficiency, and
           realise full potential                                                                                    39%

                                                                                                                      Lotteries      Wagering       Gaming
                                                                                                                     L&K            W&M            GS
                                                                                                                      & Keno            & Media     Services

    Notes:
3   1.       EBITDA from continuing operations before significant items
    2.       Based on 1H20. Contribution excludes Other division
TABCORP HOLDINGS LIMITED - 2019/20 First Half Results Presentation
FIRST HALF RESULTS

    REPORTED FIGURES THROUGHOUT THE PRESENTATION ARE RESTATED FOR
    AASB 16 CHANGES1
                                                                                                                                                          VS PCP

    REVENUE                                                                                                      $2,913.9M                                            UP   4.4%
                                                                                                                                                                                                  1H20
    EBITDA                                                                                                                                                                                         DIVIDEND
    (CONTINUING OPERATIONS BEFORE SIGNIFICANT ITEMS)                                                                $596.5M                                           UP   2.1%                   PER SHARE
                                                                                                                                                                                                  (FULLY FRANKED)
    NPAT
    (CONTINUING OPERATIONS BEFORE SIGNIFICANT ITEMS)                                                                $213.5M                                           UP   2.9%

    (STATUTORY)                                                                                                     $198.8M                                        UP    10.8%
                                                                                                                                                                                                   11.0
                                                                                                                                                                                                     CENTS
                                                                                                                                                                                                   (NO CHANGE)
    EPS2
    (CONTINUING OPERATIONS BEFORE SIGNIFICANT ITEMS)                                                                10.6 cps                                          UP   2.9%

    (STATUTORY)                                                                                                        9.8 cps                                     UP    10.1%

    Notes:
4   1.       Refer Appendix 5 for further details
    2.       Significant items (after tax) of $14.7m comprise Tatts Group combination expenses regarding implementation costs $11.0m and Racing Queensland arrangements $8.2m, partly offset by
             the benefit from ACTTAB POCT compensation tax refund $4.5m. Refer Appendix 1
TABCORP HOLDINGS LIMITED - 2019/20 First Half Results Presentation
GROUP RESULTS

                              $m                                                                                                                  1H20                        1H19                     Change

                                Revenues                                                                                                        2,913.9                     2,790.2                       4.4%

                                Variable contribution                                                                                           1,029.7                     1,017.0                       1.2%

                                Operating expenses                                                                                               (433.2)                    (432.9)                       0.1%

                                EBITDA before significant items                                                                                   596.5                       584.1                       2.1%

                                D&A                                                                                                              (192.3)                    (174.8)                      10.0%

                                EBIT before significant items                                                                                     404.2                       409.3                      (1.2%)

                                Interest                                                                                                          (94.8)                    (105.0)                      (9.7%)

                                Tax expense                                                                                                       (95.9)                     (96.8)                      (0.9%)

                                NPAT before significant items                                                                                     213.5                       207.5                       2.9%

                                Significant items (after tax)1                                                                                    (14.7)                     (18.3)                    (19.7%)

                                NPAT from discontinued operations                                                                                     -                       (9.8)                     100.0%

                                Statutory NPAT                                                                                                    198.8                       179.4                      10.8%

    Notes:
5
    1.       Significant items (after tax) of $14.7m comprise Tatts Group combination expenses regarding implementation costs $11.0m and Racing Queensland arrangements $8.2m, partly offset by the benefit from ACTTAB
             POCT compensation tax refund $4.5m. Refer Appendix 1
TABCORP HOLDINGS LIMITED - 2019/20 First Half Results Presentation
INTEGRATION: SYNERGIES & BUSINESS IMPROVEMENTS

    INTEGRATION IN FINAL PHASE; REMAIN ON TRACK TO DELIVER FY21 TARGET OF $130M-$145M EBITDA
    o Significant progress on delivery of integration program
                                                                                                                                        EBITDA ($M)
              • Full insourcing of data centre and retail network management and associated
                recontracting now complete
                                                                                                                                                                                               130 - 145
              • Consolidation of wagering call centres in 2H20

    o Completion of coding and testing of 100+ wagering systems by end February 2020 to                                                                                          100            35 - 50
      support migration of UBET customers to TAB platform by June 2020, subject to                                                                                             (was 90)
      regulatory approvals                                                                                                                                                        15

              • Supports delivery of incremental cost savings in FY21 as legacy systems and                                                                 64
                infrastructure decommissioned                                                                                                               7
                                                                                                                                                                                                     95
              • Creates platform to realise remaining wagering revenue synergies as full                                                                                          85
                benefits of enhanced product and feature set deployed in ex UBET states                                                                     57                 (was 75)
                                                                                                                                            8
    o Integration one-off cost guidance now $135m pre tax (up from $95m)                                                                    2
                                                                                                                                            6
             •    Reflects the deployment of additional resources to manage the increased                                                  2H18            FY19                 FY20             FY21
                  complexity and associated risk to ensure the successful migration of UBET                                                                                                     48
                  customers to the TAB platform                                                                                                                                                  7
                                                                                                                                                                        40
              • Incurred $93m costs (pre tax) to 31 December 2019                                                                                                       6
                                                                                                                                                  24
              • Remaining forecast spend includes:                                                                                                 1
                                                                                                                                                                                                     1
                                                                                                                                                                                                41
                        -    Wagering customer migration and retail venue roll out                                                                     1
                                                                                                                                                                        34
                                                                                                                                                  23
                        -    Implementation of last phase of workforce consolidation

                        -    Completion of technology transformation program, site exits, and systems                                           1H19                   2H19                    1H20
                             and infrastructure decommissioning                                                                              EBITDA - Cost Synergies        EBITDA - Revenue Synergies

                        -    Completion of AML program uplift in UBET states to Tabcorp group
                             standard
6
    Notes:
    1.       1H20 incremental cost synergies vs pcp of $17.3m (Lotteries & Keno $5.5m, Wagering & Media $9.3m, Gaming Services $2.5m)
TABCORP HOLDINGS LIMITED - 2019/20 First Half Results Presentation
TABLE OF CONTENTS

03 – 06      Group Overview

08 – 15      Business Results

17           Capital

19           Conclusion

21 – 28      Appendices
TABCORP HOLDINGS LIMITED - 2019/20 First Half Results Presentation
GROUP & BUSINESS RESULTS 1

                                                              Lotteries & Keno                                  Wagering & Media                                    Gaming Services                                         Group
    1H20
                                                            $m                    Change                       $m                    Change                       $m                    Change                      $m              Change

     Revenues                                            1,584.3                   12.4%                    1,179.5                   (3.7%)                    149.0                    (4.4%)                  2,913.9             4.4%

     Variable contribution                                413.0                    13.0%                     472.7                    (5.9%)                    142.0                    (4.0%)                  1,029.7            1.2%

     Operating expenses                                  (118.1)                    6.2%                    (238.9)                   (3.9%)                    (76.1)                    6.9%                    (433.2)           0.1%

     EBITDA                                               294.9                    16.0%                     233.8                    (7.8%)                     65.9                   (14.1%)                    596.5             2.1%

     D&A                                                  (49.1)                   12.1%                     (95.3)                    7.0%                     (44.6)                   14.1%                    (192.3)           10.0%

     EBIT                                                 245.8                    16.8%                     138.5                   (15.8%)                     21.3                   (43.4%)                    404.2            (1.2%)

     VC / Revenue %                                       26.1%                     0.2%                     40.1%                    (0.9%)                   95.3%                      0.4%                    35.3%             (1.1%)

     Opex / Revenue %                                     7.5%                     (0.4%)                    20.3%                        -                    51.1%                      5.4%                    14.9%             (0.6%)

     EBITDA / Revenue %                                   18.6%                     0.6%                     19.8%                    (0.9%)                   44.2%                     (5.0%)                   20.5%             (0.4%)

     EBIT / Revenue %                                     15.5%                     0.6%                     11.7%                    (1.7%)                   14.3%                     (9.8%)                   13.9%             (0.8%)

     Capex                                                 30.6                   >100.0%                     81.0                    60.4%                      40.4                   (12.4%)                    152.0            39.4%

    Notes:
8
    1.     Business results do not aggregate to Group total due to intercompany eliminations and unallocated items. 1H20 unallocated items $1.4m EBIT loss includes Jumbo Interactive income $1.9m, offset by property
           impairments on assets acquired as part of the combination with Tatts Group which are now held for sale ($3.3m) (1H19 unallocated items $3.2m EBIT loss)
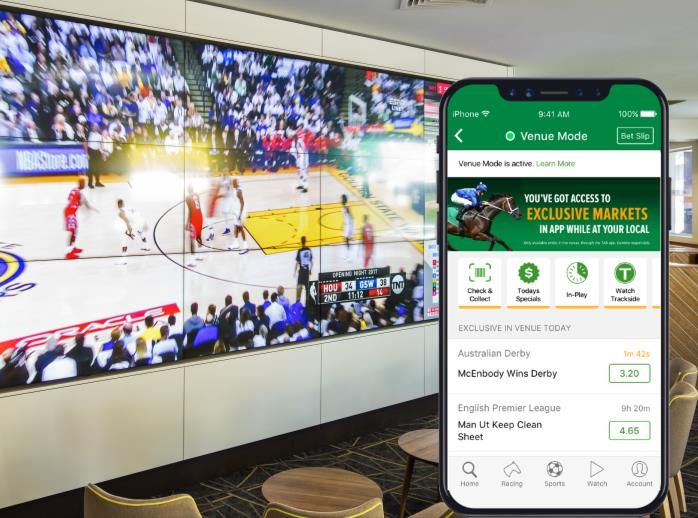
TABCORP HOLDINGS LIMITED - 2019/20 First Half Results Presentation
LOTTERIES & KENO

    STEP-CHANGE IN PERFORMANCE CONTINUES

    o Performance being driven by strategic Powerball game change, acceleration of digital and
      marketing investments, and deeper alignment with retail partners
                                                                                                                 $m                                1H20       1H19         Change
    o Active management of game portfolio to engage and excite players                                           $m                               1H20       1H19          Change
                                                                                                                 Revenues                         1,584.3    1,409.2        12.4%
             • Ongoing management of jackpot games to help deliver larger jackpots and optimise
                                                                                                                  Revenues
                                                                                                                 Variable contribution
                                                                                                                                                 1,573.6
                                                                                                                                                   413.0
                                                                                                                                                             1,409.2
                                                                                                                                                               365.5
                                                                                                                                                                            11.7%
                                                                                                                                                                            13.0%
               portfolio performance over the short and long term
                                                                                                                  Variable contribution          411.5       365.5          12.6%
             • Integrated marketing, promotional activity and personalisation driving strong portfolio           Operating expenses              (118.1)     (111.2)         6.2%
               performance                                                                                        Operating expenses             (122.9)     (111.2)        10.6%
                                                                                                                 EBITDA                            294.9       254.3        16.0%
    o Lotteries growth supported by omni-channel strategy
                                                                                                                  EBITDA
                                                                                                                 D&A                             288.6
                                                                                                                                                  (49.1)     254.3
                                                                                                                                                              (43.8)        13.5%
                                                                                                                                                                            12.1%
             • Digital growth of 39.8% through personalised offers and effective customer acquisition;
                                                                                                                  D&A
                                                                                                                 EBIT                            (49.0)
                                                                                                                                                   245.8     (43.8)
                                                                                                                                                              210.5         12.0%
                                                                                                                                                                            16.8%
               driving uplift in VC margin

             • Retail growth of 5.2% as retailers embrace use of digital in outlets under new omni-channel        EBIT
                                                                                                                 VC / Revenue %                  239.6
                                                                                                                                                  26.1%      210.5
                                                                                                                                                             25.9%          13.8%
                                                                                                                                                                             0.2%
               remuneration model
                                                                                                                  VC / /Revenue
                                                                                                                 Opex    Revenue%
                                                                                                                                %                26.2%
                                                                                                                                                   7.5%      25.9%
                                                                                                                                                              7.9%           0.2%
                                                                                                                                                                             (0.4%)
             • Elevation and accelerated roll-out of the Lott brand – “Official Home of Australia’s Lotteries”
                                                                                                                 EBITDA
                                                                                                                  Opex / /Revenue
                                                                                                                           Revenue%
                                                                                                                                  %               18.6%
                                                                                                                                                  7.8%        18.0%
                                                                                                                                                              7.9%           0.6%
                                                                                                                                                                            (0.1%)
             • Opex growth reflects increased advertising to promote larger jackpots, investment to drive
               digital growth (e.g. digital marketing costs, CRM, expanded call centre) and charitable           EBIT / Revenue
                                                                                                                  EBITDA        % %
                                                                                                                          / Revenue               15.5%
                                                                                                                                                 18.3%        14.9%
                                                                                                                                                             18.0%           0.6%
                                                                                                                                                                             0.3%
               games
                                                                                                                  EBIT / Revenue %               15.2%       14.9%           0.3%
    o D&A increase reflects investment in Brisbane office and amortisation of CRM software                       1H20 REVENUE BY PRODUCT1 (%)
                                                                                                                                                              Powerball
                                                                                                                                            8%
                                                                                                                                       3%
                                                                                                                                     5%                       Oz Lotto
                                                                                                                                                       36%    Mon / Wed Lotto &
                                                                                                                                   6%
                                                                                                                                                              Saturday Lotto
                                                                                                                                                              Keno

                                                                                                                                                              ISI
                                                                                                                                     28%
9                                                                                                                                                             SFL
                                                                                                                                                 14%
     Notes:
     1.     Gross subscriptions (including commissions and master agent fees) less prizes payable                                                             Other
TABCORP HOLDINGS LIMITED - 2019/20 First Half Results Presentation
JACKPOT PERFORMANCE
                                                                                                      (POWERBALL & OZ LOTTO)
                                                                                                                                                             26

          LOTTERIES & KENO KPIs                                                                                                         23
                                                                                                                                                             8
                                                                                                                                                                              23

                                                                                                          18                              6                                   8
                                                                                                              2
                                                                                                                       14
                                                                                                                        2
     300,000 ADDITIONAL ACTIVE REGISTERED PLAYERS AND GROWTH                                                  16                          17                 18
                                                                                                                                                                              15
                                                                                                                           12
     ACROSS ALL CHANNELS
     Lotteries                                                                                           1H18         2H18              1H19              2H19           1H20
                                                                                                                       Number of jackpots         Number of jackpots
     o Strong jackpot sequences (including record $150m Powerball jackpot), personalised marketing                     $15M - $49M                $50M or more
       and the launch of the omni-channel program delivered excellent results:
                                                                                                      CUMULATIVE JACKPOT VALUE OFFERED ($M)
                 • 22.1% growth on pcp in active registered players, now 3.6m 1
                                                                                                      (POWERBALL & OZ LOTTO) 3
                 • Digital up 39.8% on pcp, now 26.7% of turnover; retail up 5.2% on pcp
                                                                                                                                                                          1,256
                                                                                                                                                           1,191
     o Major jackpot games (Oz Lotto and Powerball) together delivered eight events of $50m or more
                                                                                                                                        1,043
       (vs six in pcp) driving a further increase in cumulative jackpot prize pool offers                                                                                     339

                                                                                                                                          364                608
     Keno                                                                                                     664          632

     o Revenue growth (up 0.9% on pcp) despite cycling high jackpot activity in pcp                                        226
                                                                                                              405                                                         917
     o    27.3k1,2     active digital account holders, up 13.8% on pcp                                                                    679
                                                                                                                                                             583
                                                                                                                           406
                                                                                                              259
     2H20 key focus areas
                                                                                                          1H18         2H18            1H19              2H19             1H20
     o Set for Life game changes to enhance customer experience via additional instalment prize                                  Powerball            Oz Lotto
       division and improved chances of winning

     o Continued retail roll-out of the Lott brand refresh (over 300 outlets already updated)         DIGITAL SHARE OF TURNOVER2
                                                                                                                                                                          26.7%
     o Enabling alternative payment platforms for our customers                                                                                            25.3%
                                                                                                          Update to reflect 5 halves as above
                                                                                                                                  21.5%
                                                                                                                       18.0%
                                                                                                          15.6%

                                                                                                                                                                       6.9%
                                                                                                                                   5.4%               5.7%
                                                                                                                    4.5%
                                                                                                       2.8%
     Notes:
10   1.     Active registered players measured on a rolling 12 month basis
     2.     ACT Keno only. NSW in-venue mobile now decommissioned                                        1H18         2H18           1H19                 2H19           1H20
     3.     The cumulative value of division one offers for all draws for Powerball and OzLotto
                                                                                                                                 Keno         Lotteries
WAGERING & MEDIA

     RESULT REFLECTS A SOFT MARKET AND A BUSINESS IN
     TRANSITION
     o Industry turnover1 down reflecting

                •    Soft consumer discretionary spending
                                                                                                                                      $m                                  1H20             1H19             Change
                •    Increased yields/pricing
                                                                                                                                      Revenues                           1,179.5          1,224.6           (3.7%)
                •    Impact of Soccer World Cup in pcp
                                                                                                                                      Variable contribution               472.7           502.1             (5.9%)
     o TAB competing well while also transforming its offer to give customers more unique,
       personalised customer experiences                                                                                              Operating expenses                  (238.9)         (248.6)           (3.9%)
     o Uplift in UBET performance expected post integration once customers have access to full TAB
                                                                                                                                      EBITDA                              233.8           253.5             (7.8%)
       offering and experience
                                                                                                                                      D&A                                 (95.3)          (89.1)               7.0%
     o VC margin impacted by tactical use of generosities to attract and retain customers (especially
       during Spring Racing Carnival)                                                                                                 EBIT                                138.5           164.4             (15.8%)

     o Opex down, despite increasing investment in customer care and compliance                                                       VC / Revenue %                      40.1%           41.0%             (0.9%)

     Positioning for improved performance in FY21 – 2H20 key focus areas                                                              Opex / Revenue %                    20.3%           20.3%                  -

     o Complete integration and UBET customer migration to full TAB experience
                                                                                                                                      EBITDA / Revenue %                  19.8%           20.7%             (0.9%)
     o Accelerate realisation of benefits from data, personalisation and digital-in-venue capability
                                                                                                                                      EBIT / Revenue %                    11.7%           13.4%             (1.7%)
     o Media – leverage enhanced US sports offer and secure key racing media rights

     o Ongoing expense discipline and further optimisation of operating model                                                         1H20 WAGERING REVENUE BY PRODUCT
                                                                                                                                                                         3%
                                                                                                                                                                    9%

                                                                                                                                                                                                   Totalisator

                                                                                                                                                                                                   FO Racing
                                                                                                                                                                                    49%
                                                                                                                                                                                                   Sports
                                                                                                                                                              39%
                                                                                                                                                                                                   Trackside
11
     Notes:
     1.     Based on aggregated data supplied by industry partners which account for approximately one-third of the wagering market
ACCOUNT MARKET SHARE2

                                                                                                                                                                                                                                     38.0%
                                                                                                                                                                                                                                              36.9%

            WAGERING & MEDIA                                                           KPIs 1                                                                                                                               34.6%

                                                                                                                                                                                                                            8.0%
                                                                                                                                                                                                                                     8.8%      8.0%
                                                                                                                                                                                                                                                      34.3%

                                                                                                                                                                                                                                                      7.7%
                                                                                                                                                                                                                                                               32.2%

                                                                                                                                                                                                                                                               6.7%
                                                                                                                                                                               23.7%     23.7%   23.7%              23.7%
                                                                                                                                                                                                            23.1%

                                                                                                                                                                               5.7%      5.4%    5.0%       4.6%    4.4%

     TAB TRANSFORMING AND COMPETITIVENESS IMPROVING;                                                                                                                                                                        26.6%
                                                                                                                                                                                                                                     29.2%    28.9%   26.6%    25.5%
     UBET UPLIFT TO COME POST INTEGRATION                                                                                                                                      18.0%     18.3%   18.7%   18.5%      19.3%

     Market share
                                                                                                                                                                               1H18      2H18    1H19       2H19    1H20    1H18     2H18     1H19    2H19     1H20
     o TAB account turnover down in absolute terms in a soft market (including digital turnover down                                                                                   Turnover Market Share                         Revenue Market Share
       2%); however account turnover share increased aided by enhanced product and customer                                                                                                                         TAB       UBET
       experience and generosities strategy
                                                                                                                                                                             FIXED ODDS YIELDS
     o TAB account revenue share movement primarily reflects TAB product mix in a period of rising
       yields
                                                                                                                                                                             16%
               •     Tote – TAB does not get any yield uplift on tote given take-outs are fixed

               •     Fixed Odds – TAB’s market leading yield means its proportionate yield uplift is lower than
                                                                                                                                                                             14%
                     competitors

     o UBET performance reflects uncompetitive legacy offering
                                                                                                                                                                             12%
                                                                                                                                                                                1H18                 2H18              1H19                  2H19             1H20
     o Increased focus on tote reinvigoration post integration, including national pooling
                                                                                                                                                                                         TAB Gross             TAB Net              UBET Gross              UBET Net
     o Retail performance being addressed as part of the TAB transformation (refer following page)

     Yields                                                                                                                                                                  QUARTERLY ACTIVE USERS3 (‘000)

     o Gross yields up on pcp, reflecting favourable racing results and increased over-rounds
                                                                                                                                                                                          158                                146
                                                                                                                                                                                                                                                              113
     o Net yields up on pcp, however generosities up reflecting strategic reinvestment in a high yielding                                                                                                    113     114
                                                                                                                                                                                                                                                       90
                                                                                                                                                                                   118                                       411      101       97
       and competitive environment                                                                                                                                                        402     112                                                         441
                                                                                                                                                                                                             317     328                       319    329
                                                                                                                                                                                   294                                                312
     Customers                                                                                                                                                                                    286

     o TAB active account customers up 7% in Q2, flat in Q1 reflecting Soccer World Cup in the pcp

     o UBET active account customers down c.20% on pcp, with focus on reactivation post integration
     Notes:                                                                                                                                                                     1Q18      2Q18   3Q18       4Q18    1Q19    2Q19     3Q19     4Q19    1Q20     2Q20
12   1.     Refer to Appendix 7 for additional KPI disclosures
     2.     Comprises digital and call centre, being channels in which a customer transacts using their account. Based on data supplied by industry partners which account                                            TAB     UBET
            for approximately one-third of the wagering market
     3.     Number of users active within the relevant quarter
WAGERING & MEDIA: SIGNIFICANT PROGRESS MADE ON TAB
     TRANSFORMATION (AND UBET CUSTOMERS WILL SOON ALSO BENEFIT)

          BRAND AND MARKETING                              CUSTOMER EXPERIENCE                                               MEDIA

    A reinvigorated brand is now in market with           Product and customer experience                   The media modernisation has progressed
          strong early customer response               enhancements are bridging the gap with              with a revised retail model supporting major
                                                                    competitors                                              initiatives
•    New brand position launched in August 2019
                                                   •   Combining digital innovation, personalisation
     – Long May We Play                                                                                •    Evolution of content presentation through Sky
                                                       and exclusive sports content to complement
                                                                                                            Racing Active enhancements
                                                       the social environment in hotels, clubs,
•    Improvements in data and personalisation
                                                       agencies and at racetracks
     capabilities enhanced customer engagement                                                         •    Rights to NBA and NFL secured, providing a
                                                   •   Venue Mode on the TAB App now provides               key entertainment opportunity for customers
•    Implementation of proximity-based marketing       customers with retail exclusive offers and           outside of busy racing periods
     technology enabling personalised, real time       products
     communication with customers in and near                                                          •    Premium sport and racing content creates
                                                   •   Strengthening the product suite to provide
     venues                                                                                                 more reason for customers to come to venues
                                                       exciting new content to customers (e.g.
                                                                                                            and for partners to choose to show SKY
                                                       expanded Same Game Multi, Racing Multi
                                                       Builder)

13
WAGERING & MEDIA: FY21 WILL BE THE FIRST TIME WE HAVE A SINGLE
      AND TRANSFORMED TAB OFFER ACROSS THE MARKET

                        FY19                          FY20                                       FY21+
     Maintain active customer            Modernise,                             Unique, personalised
     base & drive value                  digitalise & optimise                  customer experiences
                                                                                                                   BIGGER THAN
                                                                                o A seamless omni-channel
     o Step up in promotions and
       improved relative pricing
                                         o Establishing unique brand              experience appealing to a          THE BET
                                           purpose & position for TAB             broader more diverse
                                                                                  customer base
     o Established ‘Venue Mode’ -
                                         o Enhancing digitalisation of retail
       proximity based CRM & venue
                                                                                o Fully automated data &
       exclusive offers
                                         o Progressively deploying data           personalisation platform         An iconic Australian
                                           and personalisation capability
     o Investment in data and
       personalisation capability
                                                                                o Leader in product innovation      racing and sports
                                         o Reinvigorating tote
     o Commenced tote reinvigoration
                                                                                o Contemporary, diversified        entertainment brand
                                         o Revolutionising media offering         distribution network
     o Ongoing investment in customer                                                                             and the first choice for
                                                                                o Optimised business
       care initiatives
                                                                                  operations                      customers – the place
     Integration milestones              Integration milestones                 Integration milestone                where Australia
     o Rebranded UBET to TAB             o UBET systems fully migrated to       o Fully integrated TAB business       comes to play
                                           TAB platform in 2H20 and full
     o Consolidated operations –           offering aligned with TAB            o Benefits from integration
       trading, call centres, race day     (subject to regulatory approvals)      realised
       control

     o Enhanced risk & compliance
       framework
14
GAMING SERVICES

     BUSINESS UNDER REVIEW TO IMPROVE PERFORMANCE AND
     REALISE FULL POTENTIAL
     o Business performance impacted by:

           •   Revenue decline due to contract expiries, contract extensions at lower daily rates and
               reduced project work                                                                       $m                           1H20       1H19     Change

                                                                                                           MAX Venue Services          102.0      107.2     (4.9%)
           •   Non-renewal of Telstra service contract and pending expiry of NSW Statewide Linked
               Jackpots (1H20 EBITDA contribution of $3m; 2H20 expected EBITDA loss of $7m)                MAX Regulatory Services     47.0       48.6      (3.3%)

           •   Opex growth primarily driven by business development and systems costs; $2m benefit         Revenues                    149.0      155.8     (4.4%)
               from release of excess jackpot provision in pcp
                                                                                                           Variable contribution       142.0      147.9     (4.0%)
           •   D&A increase includes write down of assets associated with NSW Statewide Linked
                                                                                                           Operating expenses          (76.1)    (71.2)     6.9%
               Jackpots and accelerated amortisation of Telstra service contract (1H20: $3m; 2H20: $3m)
                                                                                                           EBITDA                      65.9       76.7     (14.1%)
     o MAX Venue Services well positioned to secure contract extensions and grow
                                                                                                           D&A                         (44.6)    (39.1)     14.1%
           •   Queensland approval obtained November 2019, complementing NSW and Victorian
               approvals, will provide meaningful growth opportunities                                     EBIT                        21.3       37.6     (43.4%)

                                                                                                           VC / Revenue %             95.3%      94.9%      0.4%
           •   50% of Victorian EGM contracts extended beyond 2022 (FY19: 40%)
                                                                                                           Opex / Revenue %           51.1%      45.7%      5.4%
     o MAX Regulatory Services focused on continued innovation of its NSW monitoring system, and
       expansion of the system into Queensland (existing market) and other potential jurisdictions         EBITDA / Revenue %         44.2%      49.2%      (5.0%)

     o Operational and strategic review has commenced                                                      EBIT / Revenue %           14.3%      24.1%      (9.8%)

                                                                                                           Contracted                                      Change
                                                                                                                           Dec 18    Jun 19     Dec 19
                                                                                                             EGMs                                         vs Jun 19
                                                                                                          Victoria          8,350    8,240      8,280        40
                                                                                                          NSW               1,900    1,850      1,940        90
15
                                                                                                          Total             10,250   10,090     10,220      130
TABLE OF CONTENTS

03 – 06      Group Overview

08 – 15      Business Results

17           Capital

19           Conclusion

21 – 28      Appendices
CAPITAL MANAGEMENT

     Effective capital expenditure                                                                                                           CAPITAL EXPENDITURE ($M)
                                                                                                                                                                                                                 152
     o Business as usual (BAU) capex
                                                                                                                                                                                                                  30
              •    1H20: $122m, up 32.6% vs pcp
                                                                                                                                                                            109
              •    2H20: c.$160m (e.g. retail roll-out of the Lott brand, Wagering                                                                                          17                                    38
                   data/personalisation program)
                                                                                                                                                                            44
              •    Subsequent return to more usual level of c.$250m p.a.                                                                                                                                                           122
                                                                                                                                                                                                                  65
                                                                                                                                                                                            92
     o Non-BAU capex: integration, data centre consolidation, new Brisbane office
                                                                                                                                                                            39
       (2H20: c.$27m)
                                                                                                                                                                                                                  19
                                                                                                                                                                             9
     Committed to maintaining an investment grade credit rating
                                                                                                                                                                           1H19                                  1H20
                                                                                                                                                                      BAU L&K       BAU W&M             BAU GS    Non-BAU
     o Gross       Debt1     /   EBITDA2       ratio of    3.4x3    at 31 December 2019

     o Target range of 3.0 – 3.5x reflects strength of underlying cash flows                                                                 DEBT STRUCTURE ($M)
     Balance sheet provides financial flexibility                                                                                            1,200

     o Headroom available under bank facilities of $0.6bn                                                                                    1,000

                                                                                                                                               800
     o Diverse range of funding sources and average debt maturity of 6.5 years
                                                                                                                                               600
     Attractive dividend
                                                                                                                                               400
     o Interim dividend of 11.0 cps fully franked, in line with pcp
                                                                                                                                               200
     o DRP will operate for the interim dividend, without any discount
                                                                                                                                                   -
     o Confirming FY20 dividend payout ratio target of 100% of adjusted NPAT4                                                                          FY20         FY22     FY24    FY26        FY28     FY30     FY32     FY34         FY36

                                                                                                                                                       Tatts USPP          Tabcorp USPP     Syndicated bank facilities    USPP (2018)

      Notes:
17    1.     Gross debt includes USPP debt at the A$ principal repayment under cross currency swaps
      2.     EBITDA calculated on a rolling 12 month basis
      3.     Impact of AASB 16 Leases is 0.17x, excluding leases Gross Debt / EBITDA would have been 3.25x
      4.     NPAT before significant items, amortisation of the Victorian wagering and betting licence (1H20: $17.5m) and Purchase Price Accounting (1H20: $9.7m)
TABLE OF CONTENTS

03 – 06      Group Overview

08 – 15      Business Results

17           Capital

19           Conclusion

21 – 28      Appendices
CONCLUSION: THE TRUSTED GAMBLING
        ENTERTAINMENT COMPANY
     POSITIONING FOR IMPROVED PERFORMANCE IN FY21

      Group                                            Business Units
                                                                                                             LOTTERIES & KENO
      o Diversified business mix delivered growth in   o Lotteries & Keno
        group revenue and EBITDA in a soft
        environment for consumer discretionary            • Excellent results through game portfolio
        spending and a period of significant change         innovation, growth in digital and more
                                                            active customers
      o Integration in the final phase; on track to
        deliver the targeted synergies and business       • Strong momentum set to continue as
        improvements                                        business leverages core Tabcorp
                                                            capabilities in digital and retail stakeholder
      o Investing in personalisation, product               engagement
        innovation, digital capability, and retail
        modernisation to deliver exceptional           o Wagering & Media
        customer experience in every channel and          • TAB competing more effectively while
        drive long term returns                             transforming the customer experience and
      o Significant opportunity for business                value perception
        optimisation and associated cost savings          • Uplift in UBET performance anticipated
                                                                                                             WAGERING & MEDIA
        post integration                                    once customers benefit from access to the
                                                            full TAB offering post integration

                                                       o Gaming Services

                                                          • Business under review to improve
                                                            performance and realise full potential

19

                                                                                                             GAMING SERVICES
TABLE OF CONTENTS

03 – 06      Group Overview

08 – 15      Business Results

17           Capital

19           Conclusion

21 – 28      Appendices
1. SIGNIFICANT ITEMS (AFTER TAX)

1H20                                                                                                                      $m

 Implementation costs                                                                                                   11.0

 Racing Queensland arrangements                                                                                           8.2

Com bination w ith Tatts Group                                                                                          19.2

ACTTAB POCT compensation                                                                                                (4.5)

Total                                                                                                                   14.7

 Implementation costs

 o Implementation costs are non-recurring costs and comprise restructure charges, integration management office and dedicated merger implementation
   resources. Implementation costs incurred to 31 December 2019 were $93m pre tax (or $65m after tax). Total implementation costs are now expected to
   be $135m pre tax (or $95m after tax) vs the previous estimate of $95m pre tax (or $66m after tax), with the increase due primarily to the complexity and
   timing of the UBET customer migration.
 Racing Queensland arrangements1

 o           Tabcorp guaranteed minimum fees that RQ will receive under the deed of understanding with UBET Queensland in each calendar year from 2018 to
             2020 inclusive. A significant item expense of $8.2m (after tax) has been recorded in respect of 1H20, reflecting the half year top up payment required
             to meet the minimum fee obligation for the 2019 calendar year. While necessarily uncertain, Tabcorp currently expects that it will be required to make
             further payments related to the 12 months ending 31 December 2020.

 o           In the event Tabcorp is ultimately unsuccessful in the current dispute with Racing Queensland, further payments may need to be made by the Group
             in respect of the minimum fee obligation.

 ACTTAB POCT compensation

 o A one-off compensation amount was received by Tabcorp ACT (ACTTAB) during FY19 following commencement of the ACT Betting Operations Tax. A
   tax refund has been recognised with respect to this compensation amount following finalisation of the tax return. This represents the finalisation of this
   matter.
21      Notes:
        1.       Refer to ASX Announcements dated 28 June 2019 and 24 July 2019 and Note C5 in the Interim Financial Statements for the half year ended 31 December 2019
2. BALANCE SHEET

                      $m                                                                                                                    Dec-19      Jun-19     Change

                        Total current assets                                                                                                 787.1       766.4      2.7%

                        Licences                                                                                                            2,200.7     2,254.4    (2.4%)

                        Other intangible assets                                                                                             9,238.7     9,184.1     0.6%

                        Property, plant and equipment                                                                                        487.0       554.6     (12.2%)

                        Other non current assets                                                                                             798.8       863.6     (7.5%)

                        Total assets                                                                                                       13,512.3     13,623.1   (0.8%)

                        Total liabilities                                                                                                   6,315.0     6,440.1    (1.9%)

                        Shareholders’ funds                                                                                                 7,197.3     7,183.0     0.2%

                        Net debt (reported)                                                                                                 3,825.1     3,665.3     4.4%

                        Net debt (economic) 1                                                                                               3,767.0     3,652.8     3.1%

                        Shares on issue (m)                                                                                                 2,025.3     2,019.3     0.3%

                        Ratios 2

                        Gross debt3 / EBITDA (x)                                                                                               3.4        3.4

                        EBIT4 / Net interest (x)                                                                                               4.1        3.9

     Notes:
22   1.       Net debt (economic) includes USPP debt at the A$ principal repayment under cross currency swaps and excludes restricted cash of $216.0m
     2.       Ratios calculated on a rolling 12 month basis
     3.       Gross debt includes USPP debt at the A$ principal repayment under cross currency swaps
     4.       EBIT excludes amortisation of the Victorian wagering and betting licence
3. CASH FLOW

               $m                                                                      1H20               1H19             Change

                Net operating cash flows                                               433.3              564.7            (23.3%)

                Net interest paid                                                      (98.3)            (114.8)           (14.4%)

                Income tax paid                                                        (98.4)             (95.7)            2.8%

                Payments for PP&E and intangibles                                      (177.8)           (110.8)           60.5%

                Sub-total                                                               58.8              243.4            (75.8%)

                Sun Bets operating cashflows and costs relating to closure                -               (91.7)           100.0%

                Ordinary dividends paid                                                (194.3)           (188.6)            3.0%

                Payment for on-market share purchase                                    (3.0)             (0.7)           >100.0%

                Payment for exercise of call option                                       -               (8.2)            100.0%

                Proceeds from sale of shares in an associate                              -               12.1             100.0%

                Payment for other financial assets                                     (21.2)             (36.2)           (41.4%)

                Other                                                                   1.5                2.5             (40.0%)

                Net cash flow                                                          (158.2)            (67.4)          >100.0%

                Net debt at beginning of period                                       3,665.3            3,562.4            2.9%

                Non cash movements                                                      1.6               122.8            (98.7%)

                Net debt at end of period                                             3,825.1            3,752.6            1.9%

     o Oz Lotto jackpot sequence during June 2019 impacted 1H20 net operating cash flows due to the timing of prize payments, and
       government taxes in July 2019
23
     o 1H20 net operating cash flows include cash outflows of $15.8m relating to significant items (1H19 $17.7m)
     o 1H19 cash flows includes the exit payment relating to the Sun Bets discontinued operation amounting to $72.0m with additional
       amounts of $19.7m relating to trading and other closure costs
4. GROUP OPERATING EXPENSES

                                                                                    Reported opex ex-synergies +4.1%

                                                                  +11.2%                      -0.2%                      +7.6%1

                                                                                                                                         2

24   Notes:
     1.       Gaming Services growth rate reflects adjustment for $2.0m provision release in 1H19. Reported opex ex-synergies is 10.4%
     2.       1H20 incremental cost synergies vs pcp of $17.3m (Lotteries & Keno $5.5m, Wagering & Media $9.3m, Gaming Services $2.5m)
5. IMPACT OF AASB 16 LEASES 1 (BY HALF)

o AASB 16 Leases represents significant changes to how lessees account for operating leases. The adoption of AASB 16 will result in:
            •    Higher assets and liabilities in the balance sheet; and
            •    Charges to the income statement will be included in depreciation and interest in replacement of rental expense, which was classified as an
                 operating expense

                                                                   Lotteries & Keno                                 Wagering & Media                 Gaming Services                    Group
$m2
                                                           1H19            FY19             1H20             1H19        FY19      1H20      1H19         FY19         1H20    1H19     FY19     1H20

 Revenues                                                     -               -               -               2.8         5.7          3.0     -            -            -      2.8      5.7      3.0

 Variable contribution                                        -               -               -               3.7         7.0          3.4     -            -            -      3.6      7.0      3.4

 Operating expenses                                         2.1              4.2             3.0             19.2         38.9     20.1      2.9           5.8         3.7     26.2     52.5     26.8

 EBITDA before significant items                            2.1              4.2             3.0             22.9         45.9     23.5      2.9           5.8         3.7     29.8     59.5     30.2

 D&A                                                       (1.7)            (3.3)           (2.9)            (18.1)      (36.4)    (19.0)    (2.7)        (5.5)        (3.2)   (25.2)   (44.2)   (25.2)

 EBIT before significant items                              0.4              0.9             0.1              4.8         9.5          4.5   0.2           0.3         0.5      4.6     15.3      5.0

 Interest                                                                                                                                                                      (8.7)    (17.1)   (8.1)

 Tax expense                                                                                                                                                                    1.0      0.4      0.9

 NPAT before significant items                                                                                                                                                 (3.1)    (1.4)    (2.2)

 Significant items                                                                                                                                                               -        -        -

 NPAT from discontinued operations                                                                                                                                               -        -        -

 Statutory NPAT                                                                                                                                                                (3.1)    (1.4)    (2.2)

25     Notes:
       1.       Refer Note C1 in the Interim Financial Statements for the half year ended 31 December 2019
       2.       Denotes favourable/(unfavourable) impact
6. LOTTERIES & KENO

                    $m                                  1H20      1H19     Change

                     Lotteries Revenue                 1,466.8   1,292.8   13.5%

                     Keno Revenue                      117.5     116.4      0.9%

                     Revenues                          1,584.3   1,409.2   12.4%

                     Lotteries Variable contribution   347.3     300.0     15.8%

                     Keno Variable contribution         65.7      65.5      0.3%

                     Variable contribution             413.0     365.5     13.0%

                     Operating expenses                (118.1)   (111.2)    6.2%

                     EBITDA                            294.9     254.3     16.0%

                     D&A                               (49.1)    (43.8)    12.1%

                     EBIT                              245.8     210.5     16.8%

                     Lotteries VC / Revenue %          23.7%     23.2%      0.5%

                     Keno VC / Revenue %               55.9%     56.3%     (0.4%)

                     VC / Revenue %                    26.1%     25.9%      0.2%

                     Opex / Revenue %                   7.5%      7.9%     (0.4%)

                     EBITDA / Revenue %                18.6%     18.0%      0.6%

                     EBIT / Revenue %                  15.5%     14.9%      0.6%

26
7. WAGERING & MEDIA KPIs

                                       1H20                                              Com bined         Change     TAB       Change    ex UBET    Change
                                       Turnover by distribution ($m ) 1
                                       Retail                                                 3,611.9       (9.0%)    2,740.4    (9.1%)      871.5    (8.8%)
                                       Digital                                                3,408.4       (4.9%)    2,884.8    (2.0%)      523.6   (18.1%)
                                       Call Centre                                                 207.6   (12.7%)      159.8    (4.7%)       47.8   (31.8%)
                                                2
                                       Other                                                       767.8      4.3%      581.2      7.4%      186.6    (4.1%)
                                       Total                                                  7,995.7       (6.2%)    6,366.2    (4.5%)    1,629.5   (12.3%)
                                       Revenue by product ($m ) 1
                                       Totalisator                                                 587.0    (9.0%)      460.1    (7.9%)      126.9   (12.9%)
                                       Fixed Odds                                                  490.8      5.7%      371.6      6.6%      119.2      3.1%
                                       Total Racing                                           1,077.8       (2.9%)      831.7    (2.0%)      246.1    (5.8%)
                                       Sport                                                       121.8   (10.4%)      106.5   (11.8%)       15.3      0.7%
                                       Trackside                                                    37.2    (5.6%)       37.2    (5.6%)        -              -
                                       Total                                                  1,236.8       (3.8%)      975.4    (3.3%)      261.4    (5.5%)
                                       Fixed Odds Yields
                                       Gross Yield                                                 16.0%      1.3%      15.9%      1.2%      16.4%      1.8%
                                       Generosities                                               (1.5%)    (0.2%)     (1.6%)    (0.4%)     (1.0%)      0.5%
                                       Net Yield                                                   14.5%      1.1%      14.3%      0.8%      15.4%      2.3%
                                       Net Racing Yield                                            15.6%      2.0%      15.4%      1.9%      16.4%      2.6%
                                       Net Sports Yield                                            11.3%    (1.6%)      11.4%    (2.1%)      10.5%      1.1%
                                       Other KPIs
                                       Active customers 3                                    700,000        (3.2%)    547,000      2.6%    153,000   (19.5%)
                                       Digital-in-venue turnover ($m)                              205.6     20.7%      185.5     18.4%       20.1     48.9%
                                       % Retail turnover from SST                                  58.9%     +5.9%      72.8%     +2.0%      16.1%     +4.4%
                                       Sky Racing Active customers                                22,000       n.m.
                                       Sky venue subscriptions (#)                                 4,995    (0.9%)

27                                     Sky races broadcast (#)                                    68,051    (0.3%)
      Notes:
      1.     Combined, TAB turnover and TAB revenue includes Victorian Racing Industry interest
      2.     Other turnover includes Oncourse, Premium Customers and PGI
      3.     Active Customers measured on a rolling 12 month basis
8. GLOSSARY

     Term             Definition                                                          Term             Definition
                                                                                          Lotteries and    The Group’s business that operates lotteries and Keno, which are
     1H               Six months ended 31 December of the relevant financial year
                                                                                          Keno             games of chance
     2H               Six months ended 30 June of the relevant financial year             MAX              The Group’s Gaming Services brand

     ACT              Australian Capital Territory                                        NPAT             Net Profit After Tax

                                                                                                           The combined total of priced probability across all outcomes on a
     ACTTAB           The Tabcorp business located in the ACT                             Over-round
                                                                                                           single event. The excess over 100% represents the implied margin

     ASX              Australian Securities Exchange                                      OPEX             Net operating expenses

     BAU              Business as Usual                                                   PCP              Prior Comparison Period
                      The Tabcorp-Tatts combination which was implemented in                               The Premier Gateway International joint venture operating from the
     Combination                                                                          PGI
                      December 2017                                                                        Isle of Man
     CRM              Customer Relationship Management                                    PPA              Purchase Price Accounting
                      Bets placed through bring-your-own digital devices within retail
     DIV                                                                                  POCT             Point of Consumption Tax
                      venues
     D&A              Depreciation, Amortisation and impairment                           RQ               Racing Queensland
                                                                                                           Part of the Group’s Media business, broadcasting racing and sport
     DPS              Dividends Per Share                                                 Sky Racing
                                                                                                           throughout Australia and internationally
     EBIT             Earnings Before Interest and Tax                                    SRC              Spring Racing Carnival
                      Earnings Before Interest, Tax, Depreciation, Amortisation and
     EBITDA                                                                               TAB              The Group’s wagering brand
                      impairment
                                                                                                           The part of the Group’s wagering business acquired as part of the
     EGM              Electronic Gaming Machine                                           UBET
                                                                                                           Combination
                                                                                          Tatts or Tatts   Tatts Group Limited (ABN 19 108 686 040) which was acquired by
     EPS              Earnings Per Share
                                                                                          Group            Tabcorp Holdings Limited in December 2017
     Financial year /
                      The Group’s financial year is 1 July to 30 June                     The Lott         Umbrella brand for the entire lotteries business
     FY
     Gaming           The Group’s business that provides services to licensed gaming
                                                                                          USPP             US Private Placement
     Services         venues and EGM monitoring services
     Group            The Tabcorp group of companies                                      VC               Variable Contribution
     28
                                                                                                           The Group’s business that operates fixed odds and pari-mutuel
                      A game of chance that is played approximately every three minutes   Wagering and
     Keno                                                                                                  betting products and services on racing, sport and novelty products,
                      and part of the Group’s Lotteries and Keno business                 Media
                                                                                                           and racing and sports broadcasting
28
DISCLAIMER

 This Presentation contains summary information about the current activities of Tabcorp Holdings Limited (Tabcorp) and its subsidiaries
 (Tabcorp Group). It should be read in conjunction with the Tabcorp Group’s other periodic and continuous disclosure announcements
 lodged with the Australian Securities Exchange (ASX), which are available at www.asx.com.au.
 No member of the Tabcorp Group gives any warranties in relation to the statements or information contained in this Presentation. The
 information contained in this Presentation is of a general nature and has been prepared by Tabcorp in good faith and with due care but no
 representation or warranty, express or implied, is provided in relation to the accuracy or completeness of the information.
 This Presentation is for information purposes only and is not a prospectus, product disclosure statement or other disclosure or offering
 document under Australian or any other law. This Presentation does not constitute an offer, invitation or recommendation to subscribe for
 or purchase any security and neither this Presentation nor anything contained in it shall form the basis of any contract or commitment.
 This Presentation is not a recommendation to acquire Tabcorp shares. The information provided in this Presentation is not financial product
 advice and has been prepared without taking into account any recipient's investment objectives, financial circumstances or particular
 needs, and should not be considered to be comprehensive or to comprise all the information which recipients may require in order to make
 an investment decision regarding Tabcorp shares.
 All dollar values are in Australian dollars (A$) unless otherwise stated.
 Neither Tabcorp nor any other person warrants or guarantees the future performance of Tabcorp shares or any return on any investment
 made in Tabcorp shares. This Presentation may contain certain 'forward-looking statements'. The words 'anticipate', 'believe', 'expect',
 'project', 'forecast', 'estimate', 'likely', 'intend', 'should', 'could', 'may', 'target', 'plan' and other similar expressions are intended to identify
 forward-looking statements. Indications of, and guidance on, financial position and performance are also forward-looking statements. Any
 forecasts or other forward looking statements contained in this Presentation are subject to known and unknown risks and uncertainties and
 may involve significant elements of subjective judgement and assumptions as to future events which may or may not be correct. Such
 forward-looking statements are not guarantees of future performance and involve known and unknown risks, uncertainties and other
 factors, many of which are beyond the control of Tabcorp, that may cause actual results to differ materially from those expressed or implied
 in such statements. There can be no assurance that actual outcomes will not differ materially from these statements. You are cautioned not
 to place undue reliance on forward looking statements. Except as required by law or regulation (including the ASX Listing Rules), Tabcorp
 undertakes no obligation to update these forward-looking statements.
 Past performance information given in this Presentation is given for illustrative purposes only and should not be relied upon as (and is not)
 an indication of future performance.

29
®
You can also read