13 August 2020 - Bell Direct
←
→
Page content transcription
If your browser does not render page correctly, please read the page content below

P A G E   1
              13 August 2020
Tim Ford Chief Executive Officer

 P A G E   2

Our team presenting today

           Tim Ford                                    Ben Dollard
           Managing Director and Chief                 President, Americas
           Executive Officer

           Matt Young                                  Peter Neilson
           Chief Financial Officer                     Managing Director, Australia
                                                       & New Zealand

           Tom King                                    Michelle Brampton
           Managing Director, Asia                     Managing Director, EMEA

                                         P A G E   3
This is Treasury Wine Estates

     We are a focused premium wine company with strong positions in key global markets

                                             #1 wine importer in China                            #2 luxury in US
                                                                                                                    F20 Volume
     Growing global premium wine market1
     > 70% of TWE revenue and increasing                                                                                          10%
                                                                                                                      28%
                                                                                                                                        24%
     Award winning and diversified
     portfolio of premium brands
                                                                                           42 vineyards
                                                                                                                              38%
     Consumer and experience led brand                                                     7 wineries
     building                                                                                                       F20 NSR

                                                                                                                         14%
     Global distribution platform                  #1 in Australia                                   #4 in the UK                   23%
     supporting sales in over 70 countries
     Competitively advantaged and                                                                                      41%          22%
     differentiated routes to market                                                       5 vineyards
                                                                                           2 wineries
                                                   71 vineyards                                                     F20 EBITS
     World class vineyard and production
                                                   8 wineries                                                                9%
     assets in internationally acclaimed                                           9 vineyards
     wine-making regions                                                           1 winery
                                                                                                                                        42%
                                               Key geographic location                                               26%
     Global, multi-regional sourcing model
                                                                                                                             23%
     Global expertise with over 3,000
     talented team members                                                                                            Asia              ANZ
                                                                                                                      Americas          EMEA

1.   Luxury and masstige price points                                P A G E   4
Long term investment case driving growth through the cycle

Our ambition is to be the world’s most admired premium wine company

LONG TERM INVESTMENT CASE                                             Long-term Group EBITS margin ambition 25%+

                                                                      Asia Leading in luxury wine           Expanding market leadership
     Attractive category

                                Through the cycle structural growth
                                                                                                            Expand premium multi-country of origin portfolio
     fundamentals
                                                                                         40%                Drive distribution depth, breadth and availability
                                                                                         F20 EBITS margin   Target margin in the high 30% range

     Best global portfolio of                                                                               Deliver future state premium wine business
                                                                      Americas Leader in premium
     premium wine brands
                                                                                                            Restructure and drive mix shift to 25% margin
                                                                                         14%                Invest behind focus brand portfolio
                                                                                         F20 EBITS margin   Drive distribution and availability of focus brands
     Winning RTM model
     in all priority markets                                                                                Elevate the category and target 25% share
                                                                      ANZ Category leader
                                                                                                            Boldly innovate

     Unparalleled global
                                                                                         23%                Transform channel mix to drive expansion
                                                                                         F20 EBITS margin   Deliver to consumer need and occasion expansion
     asset base
                                                                      EMEA Dual premiumisation role Develop premium multi-COO portfolio
                                                                                                            Win in priority European cities and markets
     Strong and flexible
     capital structure                                                                   14%                Future priority sourcing region for luxury
                                                                                                            Target mid-teens margin through premiumisation
                                                                                         F20 EBITS margin

                                                                               P A G E    5
Impact of COVID-19 in F20

TWE’s diversified global business model is well placed to navigate COVID-19 impacts

               Consumption                         ▪   In-home consumption has increased during lockdown periods
               & Sales
                                                   ▪   Bricks and mortar retail and e-commerce channels are performing strongly
               Patterns
                                                   ▪   Consumers are turning to well-known and trusted brands
                                                   ▪   Luxury wine depletions were impacted by disruptions and closures in key
                                                       non-retail sales channels1 and reduced gatherings and social occasions
                                                   ▪   Conditions in key markets improved through 4Q20, albeit at different rates
                                                       across individual markets, while channels for higher-margin luxury wine in
                                                       Australia and the US remain impacted

               Supply                              ▪   No material interruptions encountered through global operations
               Chain                               ▪   2020 Australian vintage successfully completed, with key restrictions and
                                                       protocols enacted to ensure health and safety

               Capital                             ▪   Flexible and efficient capital structure a key strength for TWE
               Structure                           ▪   $1.4bn liquidity position provides significant headroom and flexibility

               People                              ▪   Flexible and remote work practices enacted
                                                   ▪   Redeployment of resources to markets and channels where activity increased

1.   Includes on-premise, cellar doors and global travel retail                  P A G E   6
COVID-19 Plan Ahead Agenda

Our plan is to emerge a fitter and stronger global business

COVID-19       Changes to work and             At-home, food-led               Convenience of purchase
TREND          lifestyle arrangements,         consumption is growing, as      has become key to
               with increased focus on         is demand for trusted and       consumers, evidenced by
               personal health                 well-known brands               the accelerated shift to e-
                                                                               commerce       mx

OUR FOCUS &    ▪ Develop the appropriate       ▪ Increase investment in our    ▪ Leverage consumer and
PRIORITIES       return to work models           focus brands                    customer data and insights
                                               ▪ Reimagine our approach to       to enhance engagement and
               ▪ Progress efficiency of
                                                 engaging the global luxury      drive transactions
                 remote working and review
                 workplace model                 consumer                      ▪ Accelerate investment
                                               ▪ Implement interactive           behind existing and new
               ▪ Elevate employee support
                                                 models that enhance the in-     DTC platforms and
                 programs, focused on health
                                                 home consumer experience        capability
                 & wellbeing
                                               ▪ Innovate hygiene friendly     ▪ Partner with our customers
               ▪ Grow health conscious
                                                 and sustainable pack            to drive and maximise the e-
                 portfolio alternatives
                                                 formats                         commerce opportunity

                                                 P A G E   7
F20 Financial Performance1,2,3,4

     Resilient performance through challenging trading conditions

                               NSR                                                                EBITS                                                                 NPAT
               $2.65bn                        (6.4)%                              $533.5m                          (21.7)%                              $315.8m                         (25.3)%

                      NSR per case                                                        EBITS margin                                                                    EPS

                     $81.9                     2.6%                                       20.1%                    (4.0)ppts                               43.9cps                    (25.5)%

                  Cash conversion                                                                ROCE
                                                                                                                                                         Luxury and masstige
                  94.7%                   16.3ppts                                    10.6%                     (3.3)ppts                                  contribution to
                                                                                                                                                             global NSR
               Net debt / EBITDAS                                                     Full year dividend
                                                                                                                                                              71%                2.0ppts
                        2.2x                  0.4x                                   28.0cps                    (26.3)%

1.   Financial information in this report is based on unaudited financial statements. Non-IFRS measures will not be subject to audit or review, and are used internally by Management to assess the
     operational performance of the business and make decisions on the allocation of resources
2.   All figures and calculations are subject to rounding; prior year comparatives have been restated for the application of AASB16 Leases
3.   Result Headlines metrics disclosed on a reported currency basis
4.   Before material items and SGARA
                                                                                                  P A G E   8
Matt Young Chief Financial Officer

   P A G E   9
F20 result; key measures of performance1,2

             Group NSR (A$m) and NSR per case                                                          Group EBITS (A$m) and EBITS margin

             Return on Capital Employed (ROCE)                                                         Cost of Doing Business (CODB) Margin

1.   Numbers subject to rounding
2.   Prior year comparatives have been restated for the application of AASB16 Leases
                                                                                       P A G E   1 0
F20 result; other earnings insights
Benefits Expected
Material Items Benefits F20 F19
from one-off cost
1/3 luxury capacity
South Australian luxury expansion F25 $(35.0)m $(25.3)m $-
increase
Overheads - $35m F21
Strategic Agenda - overhead & supply chain
$(45.0)m $(11.3)m $-
restructure
Supply Chain - $50m+ F23+
Total Material Items $(80.0)m $(36.6)m $-
One-Off Items recognised through EBITS F20 F20 Comments F19
Net profit on disposal of non-current assets $42.4m Gain on sale of surplus US vineyard assets $25.9m
Write down of assets $(10.0)m Costs related to Simplify for Growth initiatives, $(8.8)m
including the Global Business Services division, and
restructuring of asset footprints. Costs primarily
Restructuring and redundancies $(10.1)m incurred in the Americas. $(24.1)m
Pricing risk associated with challenging US bulk wine
Inventory $(19.8)m $(3.2)m
and grape supply market conditions
Increased global provisions associated with general
Trade receivables $(7.0)m $(0.9)m
COVID-19 trading conditions
Net impact through P&L $(4.5)m $(11.2)m
P A G E 1 1Balance Sheet1,2,3
A$m F20 F19
Strong, efficient and flexible balance sheet
Cash & cash equivalents 449.1 401.8
Receivables 554.1 662.0
• Net assets decreased $18.1m on a reported currency basis;
Current inventories 1,017.4 1,001.7
adjusting for the movement in foreign currency, net assets
Non-current inventories 1,059.2 1,045.6
decreased by $41.2m
Property, plant & equipment 1,397.4 1,369.9
• Key factors driving the movement in net assets included:
Right of use lease assets 517.0 535.9
Agricultural assets 34.1 29.4
– Higher interest bearing debt, principally the result of
Intangibles 1,331.6 1,308.9
higher bilateral facility drawings in F20
Tax assets 183.5 187.0 – Lower receivables reflecting the impact of lower sales in
Assets held for sale 74.3 78.3 2H20
Other assets 54.2 21.0
– Lower net tax liabilities due to the decline in the current
Total assets 6,671.9 6,641.5
year tax expense
Payables 682.1 718.6
Interest bearing debt 1,227.0 1,090.0 • Modest increase in receivables ageing as TWE supports
Lease liabilities 698.6 704.6 customers through recovery
Tax liabilities 357.1 430.1
• ROCE 10.6%, a decrease of 3.3 ppts in F20 a result of lower
Provisions 59.2 48.0
EBITS
Other liabilities 24.5 8.7
Total liabilities 3,048.5 3,000.0
Net assets 3,623.4 3,641.5
1. Unless otherwise stated, all balance sheet percentage or dollar movements from the previous period are on a reported currency basis. Prior year comparatives have been restated for the
application of AASB16 Leases and IFRIC 23, as disclosed in Note 32 of the Financial Statements
2. Working capital balances may include items of payables and receivables which are not attributable to operating activities
3. Borrowings have been reduced $41.7m (F19: $12.1m decrease) to reflect fair value hedges on a portion of US Private Placement notes
P A G E 1 2Inventory analysis
Inventory at book value split by segment1,2,3 Flexible luxury wine allocation program a key strength
• Total inventory volume declined 9%, driven by the 2020
Australian vintage where intake was down approximately 30%
versus the prior year, partially offset by the carry forward of
unsold wine that had been previously allocated to 2H20
• Total inventory value increased $29.3m to $2,076.6m, with the
higher average cost per case for the 2020 Australian and 2019
Californian vintages (the latter due to improved mix) offsetting
the impact of the 9% volume decline
• Luxury inventory increased 8% to $1,305.6m:
- Total luxury inventory volume declined 5% versus the prior
year as a result of the 2020 Australian vintage where luxury
intake was down approximately 45%, partially offset by the
2H20 inventory carry forward
- Higher average cost per case for the 2020 Australian and
2019 Californian vintages were the key drivers of the higher
luxury inventory value
- TWE’s flexible luxury wine allocation program is a key
strength which allows it to manage through short term
changes in demand or single vintage variation
1. Inventory composition subject to rounding. Totals based on sum of Non-Current and Current Inventory
2. Prior year has been restated for application of AASB16 Leases
3. TWE participates in three segments: Luxury (A$20+), Masstige (A$10-A$20) and Commercial
(A$5-A$10). Segment price points are retail shelf prices P A G E 1 3Cash flow and net debt1
A$m (unless otherwise stated) F20 F19
Operating cash flow performance remains strong
EBITDAS 697.9 842.9 • Strong cash conversion of 94.7%, with lower 4Q20 sales and a
Change in working capital (22.2) (167.5)
smaller Australian vintage offset by higher levels of inventory for
Other items (15.0) (14.7)
Net operating cash flows before financing costs, tax & material
luxury wine that had been allocated to 2H20
660.7 660.7
items
Cash conversion 94.7% 78.4% • Cash conversion excluding the investment in non-current luxury and
Payments for capital expenditure and subsidiaries (188.8) (160.7)
masstige inventory was 97.6%
Proceeds from sale of assets 100.2 102.5
Cash flows after net capital expenditure, before financing costs,
572.1 602.5
• TWE targets cash conversion of approximately 90% or higher for
each full financial year, excluding the annual change in non-current
tax & material items
Net interest paid (84.1) (84.8)
Tax paid (168.0) (112.5) luxury and masstige inventory
Cash flows before dividends & material items 320.0 405.2
Historic cash conversion performance2
Dividends/distributions paid (276.3) (244.7) A$m
Cash flows after dividends before material items 43.7 160.5
Material item cash flows (19.8) (1.5)
On-market share purchases (4.9) (16.6)
Total cash flows from activities (before debt) 19.0 142.4
Net (repayment) / proceeds from borrowings 28.8 169.1
Total cash flows from activities 47.8 311.5
Opening net debt (1,380.0) (1,336.9)
Total cash flows from activities (above) 19.0 142.4
Net lease liability additions (41.3) (117.8)
Net debt acquired (4.9) -
Debt revaluation and foreign exchange movements (27.0) (67.7)
Increase in net debt (54.2) (43.1)
Closing net debt (1,434.2) (1,380.0)
1. All cash flow percentage or dollar movements from the previous corresponding period are on a reported currency basis
2. Cash conversion excluding non-current inventory investment excludes the annual change in Luxury and Masstige non-current inventory
P A G E 1 4Capital Expenditure
Continuing to prioritise investment to support growth
A$m F20 F19
IT spend 16.2 16.6 • Capital expenditure (capex) $188.8m in F20, including:
Oak purchases 1 2.4 1.1 − Maintenance & replacement capex of $82.6m
Vineyard redevelopments 30.8 33.0 − Growth capex of $106.2m includes investments in South
Upgrades to wine making equipment and facilities 25.3 32.3 Australian Luxury wine making assets, acquisition of French
Other capital expenditure 7.9 21.2 production assets and vineyard acquisitions
Total maintenance and replacement capex 82.6 104.2
• Net lease additions $ 41.3m were driven primarily by the lease
Growth initiatives 70.9 20.7
extension for South Australian distribution centre
Vineyard acquisitions 13.1 7.0
Investment in French productions assets 22.2 - • In F21, capex is expected to include:
Total growth capex 106.2 27.7 − Maintenance and replacement expenditure of $100-110m
Total capital expenditure 188.8 131.9
− Growth capex of up to $90m to support future
Net lease additions 41.3 117.8
premiumisation and growth, including the investment in
South Australian luxury winemaking assets
− Capex will continue to be managed in accordance with
management of cash flow and liquidity parameters
• South Australian luxury winemaking investment now expected
to be completed for V22 and will support a one-third increase in
production capacity for the luxury and masstige portfolios
1. F19 has been restated to exclude oak purchases that were subsequently entered into leaseback
arrangements. Following transition to AASB16 Leases these are deemed low value assets and therefore
not treated as a lease liability.
P A G E 1 5Capital Management
TWE’s strong, flexible and efficient capital structure retained; liquidity enhanced in 2H20
• Investment grade credit metrics maintained:
- Net debt / EBITDAS1 2.2x at F20 (vs 1.8x at F19) and interest cover 10.1x
- TWE is confident of maintaining the below 2.0x net debt / EBITDAS target through the cycle
• Total available liquidity $1.4bn, comprising cash $449.1m and undrawn committed facilities of approximately $920.2m
- Key funding highlights include refinancing and restoration of 7-year tranche of Asian syndicated facility and
establishment of US$200m term loan facility to provide enhanced liquidity through the COVID-19 period
• Strong capital structure and liquidity position supports the maintenance of TWE’s long-term dividend policy
- F20 final dividend of 8.0 cents per share declared, fully franked, representing a 64% NPAT payout ratio2
Maturity profile – committed debt facilities
1. Ratio of total Net Borrowings to last twelve-month EBITDAS, includes capitalised leases in accordance with AASB16 Leases, with the prior year comparative having been restated
2. TWE targets a dividend payout ratio of 55-70% of NPAT (pre-material items and SGARA) over a fiscal year
P A G E 1 6Tom King Managing Director Asia
Ben Dollard President Americas
Peter Neilson Managing Director ANZ
Michelle Brampton Managing Director EMEA
P A G E 1 7Asia
Strong market fundamentals remain in place, with return to depletions growth in 4Q20 a positive
Asia regional performance Business headlines
• EBITS declined 11.2% and EBITS margin rose 1.6ppts to 39.5%:
$Am F20 F19 % F19 %
− Volume and NSR declines of 23.7% and 14.7% respectively
Reported Currency Constant Currency
were the key driver, a result of COVID-19 impacts throughout
NSR 617.1 721.4 (14.5)% 723.4 (14.7)% the region in 2H20
NSR per case 187.78 167.58 12.1% 168.04 11.7% − Offsetting and supporting the maintenance of EBITS margin
EBITS 243.7 283.0 (13.9)% 274.5 (11.2)% were the 11.7% improvement in NSR per case, reflecting
EBITS margin (%) 39.5% 39.2% 0.3ppts 37.9% 1.6ppts continued portfolio premiumisation, and improved CODB
Historical EBITS and margin performance1 • In China, depletions were up 13% in 4Q20 versus the pcp,
including growth of approximately 40% in June, after having been
A$m down by more than 50% in February and March
• Focus brand portfolio depletions grew and made significant market
share gains across the region
• TWE maintains appropriate and planned inventory channels
throughout the region; forward days of inventory cover at June are
lower versus prior year
• TWE targets EBITS margin in the high 30% range
F20 luxury and masstige
contribution to Asia NSR 89% 3ppts in F20
1. Presented on a reported currency basis, prior year comparatives have been restated for AASB16 Leases, as disclosed in Note 32 of the Financial Statements and includes the
reclassification of $11.5m F19 EBITS for the Middle East & Africa region, from Asia to EMEA
P A G E 1 8Asia Brand Highlights
Recruiting New Consumers Driving Premiumisation Consumer Experiences
Rawson’s Retreat Your Ideal Penfolds Bin 389 60th Anniversary Wolf Blass Michelin South East Asia
Wine Moment Platform Year of the Rat Special Edition Food & Wine Partnership
P A G E 1 9Americas
Focus brand portfolio continues to grow strongly despite challenging US market conditions
Americas regional performance Business headlines
$Am F20 F19 % F19 % • EBITS declined 43.8% and EBITS margin was 7.9ppts lower to 13.8%,
Reported Currency Constant Currency
reflecting:
− Volume and NSR declines of 11.4% and 11.6% respectively as a
NSR 1,069.4 1,134.4 (5.7)% 1,209.6 (11.6)%
result of challenging US wine market conditions and the impact of
NSR per case 86.06 80.87 6.4% 86.24 (0.2)%
COVID-19 to key sales channels outside of retail and e-commerce
EBITS 147.3 233.4 (36.9)% 262.1 (43.8)% where sales are weighted to higher margin, luxury wine2
EBITS margin (%) 13.8% 20.6% (6.8)ppts 21.7% (7.9)ppts
− Higher COGS per case, up 9%, driven by higher costs on US luxury
wine releases in F20 and Australian commercial sourced wine
Historical EBITS and margin performance1
• In the US, shipments were below depletions by 7%, driven by industry
A$m
wide working capital management by distributors
• TWE’s focus brand portfolio performed strongly, partially offsetting the
decline in the commercial portfolio
• TWE has commenced key initiatives to deliver a future state premium
wine business in the US
• 25% medium-term EBITS margin target maintained
F20 luxury and masstige
contribution to Americas NSR 71% 4ppts in F20
1. Presented on a reported currency basis, prior year comparatives have been restated for AASB16 Leases, as disclosed in Note 32 of the Financial Statements
2. Includes on-premise, cellar doors and global travel retail and represented approximately 12% of volume and 25% of revenue in F19
P A G E 2 0Americas Brand Highlights
Recruiting New Consumers Driving Premiumisation, Growing Our Heartland
Connecting Digitally
19 Crimes Cali Red Snoop Dogg Stags’ Leap DTC Acceleration Matua Refreshment Platform &
Partnership Through COVID-19 Coldbox Distribution Gains
P A G E 2 1Australia & New Zealand
Continued positive momentum in growing masstige portfolio, led by key focus brands
ANZ regional performance Business headlines
$Am F20 F19 % F19 % • EBITS declined 13.0% and EBITS margin fell 2.9ppts to 22.5%,
reflecting:
Reported Currency Constant Currency
− Volume and NSR declines of 1.9% and 1.7% respectively, with
NSR 592.4 602.3 (1.6)% 602.4 (1.7)%
strong retail channel performance and increased purchasing
NSR per case 76.12 75.89 0.3% 75.90 0.3%
through e-commerce in 2H20 being more than offset by the
EBITS 133.3 158.0 (15.6)% 153.3 (13.0)% closure of key sales channels outside of retail and e-commerce
EBITS margin (%) 22.5% 26.2% (3.7)ppts 25.4% (2.9)ppts where sales are weighted to higher margin, luxury wine2
− Higher COGS per case, up 4.3%, on Australian sourced
Historical EBITS and margin performance1 commercial and masstige wine from the 2019 vintage
A$m • Market growth is being driven by the $10-20 price point, where
TWE is growing ahead of the market led by its focus brands3
• TWE continues to target a 25% market share in ANZ; current
value share 21%4
F20 luxury and masstige
contribution to ANZ NSR 75% 2ppts in F20
1. Presented on a reported currency basis, prior year comparatives have been restated for AASB16 Leases, as disclosed in Note 32 of the Financial Statements
2. Includes on-premise, cellar doors and global travel retail and represented approximately 11% of volume and 20% of revenue in F19
3. Aztec sales value data, bottle and canned wine only, Australia Liquor weighted, quarter & FY to 21 June
4. Aztec sales value data, bottle and canned wine only, Australia Liquor weighted, MAT to 7 June
P A G E 2 2ANZ Brand Highlights
Recruiting New Consumers Driving Premiumisation Growing Our Heartland
19 Crimes Disruptive Integrated Penfolds 175th Anniversary & Leveraging Partnerships for Long
Activations 100 Point Special Bin 111A Term Brand Growth
P A G E 2 3Europe, Middle East & Africa
Resilient performance through challenging conditions; mid-teens EBITS margin maintained
EMEA regional performance Business headlines
$Am F20 F19 % F19 %
• EBITS declined 24.7% and EBITS margin fell 3.8ppts to 14.0% as
a result of:
Reported Currency Constant Currency
− Volume and NSR declines of 4.0% and 3.7% respectively, with
370.6 373.5 (0.8)% 384.9 (3.7)%
NSR
2H20 declines due to COVID-19 closures in Continental
NSR per case 41.81 40.47 3.3% 41.70 0.3% Europe and Middle East & Africa partly offset by strong
EBITS 51.7 63.3 (18.3)% 68.7 (24.7)% masstige performance through retail channels in the UK
EBITS margin (%) 14.0% 16.9% (2.9)ppts 17.8% (3.8)ppts − Higher COGS per case, which increased 6.7%, reflecting
masstige-led mix shift and higher costs on Australian and US
Historical EBITS and margin performance1 sourced commercial wine
A$m • Targeting mid-teen EBITS margin in F21 with benefits of
premiumisation and cost efficiencies to be more than offset by
impacts of higher Australian commercial sourced COGS
F20 luxury and masstige
contribution to EMEA NSR 35% 3ppts in F20
1. Presented on a reported currency basis, prior year comparatives have been restated for AASB16 Leases, as disclosed in Note 32 of the Financial Statements, and includes the reclassification of
$11.5m F19 EBITS for the Middle East & Africa region, from Asia to EMEA
P A G E 2 4EMEA Brand Highlights
Recruiting New Consumers Driving Premiumisation Growing Our Heartland
Blossom Hill Gin Fizz Launch Premium DTC Platform Launch Wolf Blass Deliveroo Partnership
Through COVID-19
P A G E 2 5Tim Ford Chief Executive Officer
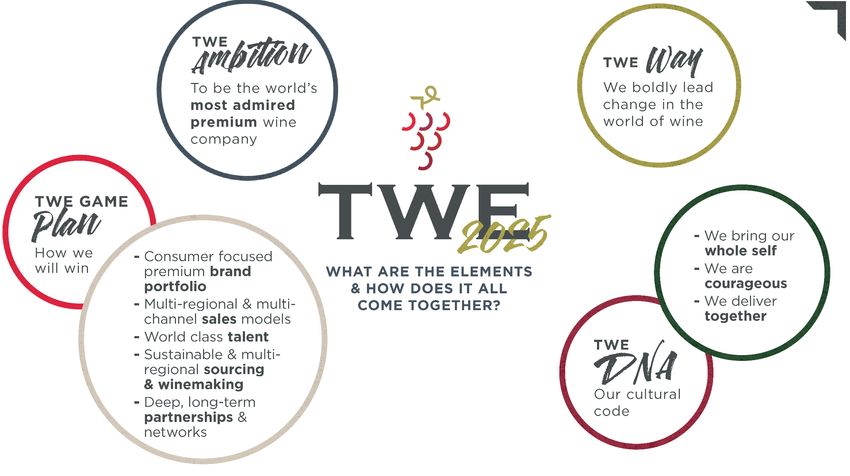
P A G E 2 6TWE 2025
P A G E 2 7Executing the Game Plan – our F21 priorities
Execution of key F21 priorities will accelerate our through the cycle growth ambitions
01 02 03 04 05
Manage performance Shift to a consumer- Optimise our global Deliver the future state Accelerate separate
led marketing model supply chain US wine business focus across portfolio
▪ Stay the course where ▪ Embed consumer and ▪ Continue to grow ▪ Position for long term ▪ Long-term value
we are winning experience led access to luxury wine growth in the US creation expected from
marketing model from multiple COO a separate focus for
▪ Continue partnering ▪ Improve shape of P&L Penfolds and our other
with our customers ▪ Prioritise insight and ▪ Reduce our global cost and progress towards premium brands
and suppliers to data-led decision to serve medium-term 25%
manage through making EBITS margin target ▪ Determine operating
recovery ▪ Optimise sourcing model that best delivers
▪ Implement fewer, with a focus on ▪ Explore divestiture of growth and value
▪ Maintain tight cost bigger and more sustainability selected brands and creation
and capital discipline disruptive campaigns assets and reduce
on focus brands ▪ Maximise asset lower margin ▪ Alternatives include the
▪ Implement the COVID- utilisation commercial volume potential demerger of
19 Plan Ahead Agenda ▪ Bold innovation to Penfolds or internal
to capture meet consumer ▪ Annualised cost Operating model and
▪ divisionalisation
opportunities occasions savings of $50m+ to be organisational changes
delivered by F231 completed, $35m+ ▪ TWE intends to provide
savings from F211 a further update by the
1H21 results
1. Total program costs of approximately $45m to be incurred across F20 and F21, and to be treated as a material item (excludes any potential future impacts of brand divestments)
P A G E 2 8Delivering a future state premium US wine business
Progress update of key business restructuring initiatives to be delivered through to 1H22
#1 #2 #3 #4
Adjust operating model and Restructuring of supply chain Reduction of lower margin Divestiture of brands and
organisational structure to reduce COGS commercial tier brands production assets
Key actions completed 4Q20 Work underway as part of Tail brands to be Exploring the potential
the global supply chain rationalized and divestiture of selected
Re-designed sales and transformation progressively run down brands and assets in the US
marketing operating model and
organisation structure in place $50m+ globally annualised
COGS savings by F23 will
$35m+ benefit F21 onwards include the Americas
A future state premium wine business F17-20 focus brand Our focus brands are outperforming
Americas today Future state ambition1 CAGR the category in US retail2
54% 15%
Volume
VOLUME
VOLUME
85%
+7.1%
MAT change
46%
29% 5%
NSR
NSR
NSR
+15.8%
71% 95%
Luxury / Masstige Commercial
Future state business with broadly half the volume, similar earnings and progress towards 25% EBITS margin ambition
1. Following completion of restructuring initiatives
2. IRI Market Advantage, Multi-Liquor Outlet + Convenience, Moving Annual Target P A G E 2 9Accelerate the separate focus across portfolio
A separate focus across the portfolio will drive long-term growth and value creation
TWE premium
portfolio
Brand hierarchy High-end luxury brand with Portfolio of differentiated
differentiated price tiers premium wine brands
Portfolio centre
of gravity (A$) $80 - $100 $10 - $30
Engaged wine connoisseur Premium wine consumer who
Target consumer who seeks quality and luxury
values differentiated brands
credentials and enjoys variety across
multiple occasions
Expand sourcing capacity, Drive portfolio innovation and
including French and US manage brand lifecycles
Strategic priorities COO products Grow luxury and masstige
Build distribution through portfolios in key markets
Asia and the US Optimise the asset base
Brand with a distinct luxury Portfolio of differentiated
Future growth voice, targeting a greater brands, valued by customers
drivers number of global consumers and consumers for a greater
number of occasions
P A G E 3 0Summary and outlook
• F20 result reflects resilient performance despite two significant market-driven factors: COVID-19 and
challenging conditions in the US wine market
• TWE has remained profitable, with strong cash conversion and a healthy balance sheet
• While positive signs of recovery have emerged recently, TWE remains cautious on the near-term outlook
given the uncertainty that remains around the pace of recovery
• TWE is very well placed to return to growth in the future, once markets stabilise, supported by:
The best global portfolio of premium wine brands, with strong market positions, global distribution
footprint, a world class asset base and a strong and flexible capital structure
A strategic agenda that sets the priorities for F21, is focused on addressing nearer term challenges
and lays the foundations for longer term growth
A clear strategic blueprint – TWE 2025 – that lays out the ambition, game plan and DNA
P A G E 3 1P A G E 3 2
P A G E 3 3
Volume

    (Volume, m 9Le)              F20        F19        %

    Americas                     12.4      14.0     (11.4)%
    Asia                          3.3       4.3     (23.7)%
    EMEA                          8.9       9.2      (4.0)%
    ANZ                           7.8       7.9      (1.9)%
    TWE EBITS                    32.4      35.4      (8.8)%

•    Americas: Lower volume driven by 17% decline in 2H20 volumes with Commercial volumes
     down 19%
•    Asia: Volume decline 23.7% driven by 2H20 declines across all key regions and all price points.
•    ANZ: Volume decline 1.9% with 2H20 gains offset by volume decline in 1H. 2H volumes +3.4%
     driven by Masstige led growth
•    EMEA: Volume declines in Continental Europe and Middle East & Africa partly offset by strong
     masstige portfolio performance in the UK

                                                           P A G E   3 4
Profit & Loss1
First Half Second Half Full Year
F19 F19 F19
$Am (unless otherwise stated) F20 F19 Change Constant Change F20 F19 Change Constant Change F20 F19 Change Constant Change
Currency Currency Currency
Net sales revenue 1,536.1 1,507.7 1.9 % 1,546.4 (0.7)% 1,113.4 1,323.9 (15.9)% 1,373.9 (19.0)% 2,649.5 2,831.6 (6.4)% 2,920.3 (9.3)%
NSR per case ($) 87.00 80.64 7.9 % 82.71 5.2 % 75.72 78.80 (3.9)% 81.78 (7.4)% 81.88 79.77 2.6 % 82.27 (0.5)%
Other Revenue 15.1 30.1 (49.8)% 30.8 (51.0)% 13.6 21.3 (36.2)% 21.0 (35.2)% 28.7 51.4 (44.2)% 51.8 (44.6)%
Cost of goods sold (868.0) (884.9) 1.9 % (909.8) 4.6 % (720.9) (757.6) 4.8 % (786.6) 8.4 % (1,588.9) (1,642.5) 3.3 % (1,696.4) 6.3 %
Cost of goods sold per case ($) 49.16 47.33 (3.9)% 48.66 (1.0)% 49.03 45.09 (8.7)% 46.82 (4.7)% 49.10 46.27 (6.1)% 47.79 (2.7)%
Gross profit 683.2 652.9 4.6 % 667.4 2.4 % 406.1 587.6 (30.9)% 608.3 (33.2)% 1,089.3 1,240.5 (12.2)% 1,275.7 (14.6)%
Gross profit margin (% of NSR) 44.5% 43.3% 1.2ppts 43.2% 1.3ppts 36.5% 44.4% (7.9)ppts 44.3% (7.8)ppts 41.1% 43.8% (2.7)ppts 43.7% (2.6)ppts
Cost of doing business (316.5) (306.0) (3.4)% (311.1) (1.7)% (239.3) (253.5) 5.6 % (262.6) 8.9 % (555.8) (559.5) 0.7 % (573.7) 3.1 %
Cost of doing business margin (% of NSR) 20.6% 20.3% (0.3)ppts 20.1% (0.5)ppts 21.5% 19.1% (2.4)ppts 19.1% (2.4)ppts 21.0% 19.8% (1.2)ppts 19.6% (1.4)ppts
EBITS (before material items) 366.7 346.9 5.7 % 356.3 2.9 % 166.8 334.1 (50.1)% 345.7 (51.8)% 533.5 681.0 (21.7)% 702.0 (24.0)%
EBITS margin (%) 23.9% 23.0% 0.9ppts 23.0% 0.9ppts 15.0% 25.2% (10.2)ppts 25.2% (10.2)ppts 20.1% 24.1% (4.0)ppts 24.0% (3.9)ppts
SGARA (2.6) (6.2) 58.1 % (6.6) 60.6 % (38.7) (13.5) (186.7)% (13.6) (184.6)% (41.3) (19.7) (109.6)% (20.2) (104.5)%
EBIT (before material items) 364.1 340.7 6.9 % 349.7 4.1 % 128.1 320.6 (60.0)% 332.1 (61.4)% 492.2 661.3 (25.6)% 681.8 (27.8)%
Net finance costs (44.8) (40.7) (10.1)% (42.2) (6.2)% (41.1) (45.0) 8.7 % (46.9) 12.4 % (85.9) (85.7) (0.2)% (89.1) 3.6 %
Tax expense (91.9) (86.6) (6.1)% (87.2) (5.4)% (27.4) (80.5) 66.0 % (79.7) 65.6 % (119.3) (167.1) 28.6 % (166.9) 28.5 %
Net profit after tax (before material items) 227.4 213.4 6.6 % 220.3 3.2 % 59.6 195.1 (69.5)% 205.5 (71.0)% 287.0 408.5 (29.7)% 425.8 (32.6)%
Material items (after tax) (16.0) - - - - (10.2) - - - - (26.2) - - - -
Net profit after tax 211.4 213.4 (0.9)% 220.3 (4.0)% 49.4 195.1 (74.7)% 205.5 (76.0)% 260.8 408.5 (36.2)% 425.8 (38.8)%
Reported EPS (A¢) 29.4 29.7 (1.0)% 30.7 (4.2)% 6.9 27.2 (74.6)% 28.6 (75.9)% 36.2 56.9 (36.4)% 59.3 (39.0)%
Net profit after tax (before material items and
229.2 218.1 5.1 % 225.0 1.9 % 86.6 204.7 (57.7)% 215.6 (59.8)% 315.8 422.8 (25.3)% 440.6 (28.3)%
SGARA)
EPS (before material items and SGARA) (A¢) 31.9 30.4 4.9 % 31.3 1.9 % 12.0 28.5 (57.9)% 30.0 (60.0)% 43.9 58.9 (25.5)% 61.3 (28.4)%
Average no. of shares (m) 719.5 718.3 718.3 719.9 718.4 718.4 719.9 718.4 718.4
Dividend (A¢) 20.0 18.0 11.1 % 18.0 11.1 % 8.0 20.0 (60.0)% 20.0 (60.0)% 28.0 38.0 (26.3)% 38.0 (26.3)%
1. Prior year comparatives have been restated for AASB16 Leases and IFRIC 23, as disclosed in Note 32 of the Financial Statements
P A G E 3 5Impact of foreign exchange rate movements & hedging
F20 constant currency impact F21 EBITS sensitivity and risk management
Currency Primary EBITS
Movement
Pair Exposure Sensitivity (A$m)
AUD/USD COGS, EBITS +1% (3.7)
AUD/GBP COGS, EBITS +1% (1.2)
CAD/USD NSR +1% 1.1
EUR/GBP NSR +1% 0.7
USD/GBP COGS +1% (0.3)
• $21.0m constant currency foreign exchange benefit in • The sensitivity of EBITS to a 1% change in primary cost and
F20 (comprising transaction and translation impacts) revenue currencies is shown in the accompanying table
• TWE has a diversified portfolio of currency exposures (excludes potential impact of currency hedging)
where production cost currencies and revenue • TWE maintains an active foreign exchange risk management
generating currencies are not matched strategy, focused on the transactional exposures associated
– $34.0m benefit from depreciation of the AUD relative with the Commercial and lower Masstige price segments:
to the main currency pairs (USD and GBP), offset by − AUD/GBP: 51% of F21 exposure protected against
($9.6m) adverse revenue impact largely reflecting appreciation of the exchange rate above 0.57
movements in TWE’s primary revenue currencies2
− AUD/USD: 61% of F21 exposure protected against
– $3.4m relative impact from hedging in F19 versus appreciation of the exchange rate above 0.65
the prior year ($5.6m realised loss in F20 vs $2.2m
loss in the prior year based on constant currency
basis)
1. CFX hedging impact relative to the prior year
2. USD relative to the CAD in the Americas, GBP relative to the EUR, SEK and NOK in Europe
P A G E 3 6Definitions
Term Definition
CAGR Compound annual growth rate
Constant currency Throughout this presentation, constant currency assumes current and prior period earnings of foreign operations are
translated and cross border transactions are transacted at current year exchange rates
COO Country of origin
NSR Net sales revenue
EBITDAS Earnings before interest, tax, depreciation, amortization, material items and SGARA
EBITS Earnings before interest, tax, materials items and SGARA
EBIT Earnings before interest, tax and material items
Exchange rates Average exchange rates used for profit and loss purposed in the F20 results are: $A1 = $US 0.6711 (F19: $A1 = $US
0.7154), $A1 = GBP 0.5326 (F19: $A1 = GBP 0.5528), Period end exchange rates used for balance sheet items in F20
results are: $A1 = $US 0.6874 (F19: $A1 = $US 0.7005), $A1 = GBP 0.5584 (F19: $A1 = GBP 0.5529)
NPAT Net profit after tax
ROCE Return on Capital Employed
SGARA Australian accounting standard AASB 141 “Agriculture”. From 1 July 2016, changes to AASB 141 applied in respect of
vine assets. Vines are no longer recorded at fair value, but are recorded at cost and depreciated
Shipment Shipments refer to volume movements from TWE to a third party off-premise or on-premise distributor or retailer
Depletion Depletions refer to volume movements from a distributor to an off-premise or on-premise retailer
P A G E 3 7Disclaimer
Summary information
The material in this presentation is summary information about Treasury Wine Estates Limited (TWE) and its subsidiaries
and their activities, current as at the date of this presentation unless otherwise stated. It should be read in conjunction with TWE’s other
announcements filed with the Australian Securities Exchange, which are available at www.asx.com.au.
No representation is made as to the accuracy, completeness or reliability of this presentation.
Forward looking statements
This presentation contains forward looking statements, which may be identified by the use of terminology including ‘expects’, ‘believes’,
‘targets’, ‘likely’, ‘should’, ‘could’, ‘intends’, ‘aims’ or similar expressions. Indicators of and guidance on future earnings and financial position
are also forward looking statements. These forward looking statements are not guarantees or predictions of future performance and involve
known and unknown risks, uncertainties and other factors, many of which are beyond the control of TWE, and which may cause actual
results to differ materially from those expressed or implied in such statements. Readers are cautioned not to place undue reliance on
forward looking statements.
Except as required by applicable regulations or by law, TWE does not undertake any obligation to publicly update or review
any forward looking statements, whether as a result of new information or future events.
Past performance
Past performance information included in this presentation is for illustrative purposes only and cannot be relied on as a guide
to future performance.
No offer of securities
Nothing in this presentation should be construed as either an offer or a solicitation of an offer to buy or sell TWE securities,
or be treated or relied upon as a recommendation or advice by TWE.
P A G E 3 8You can also read