Vodafone Ukraine FY'20 Results - April 14, 2021
←
→
Page content transcription
If your browser does not render page correctly, please read the page content below

April 14, 2021

Vodafone Ukraine FY’20
Results
Disclaimer
For the purposes of this important information and disclaimer, the presentation shall mean and include the slides, the oral presentation of the slides by Private Joint Stock Company “VF
Ukraine” (the “Company”, and jointly with its subsidiaries, the “Group”) or any person on its behalf, any question-and-answer session that follows the oral presentation, hard copies of this
document and any materials distributed in connection with the presentation.
THIS PRESENTATION IS NOT AN OFFER OR SOLICITATION OF AN OFFER TO BUY OR SELL SECURITIES. IT IS SOLELY FOR USE AT AN INVESTOR PRESENTATION AND IS PROVIDED FOR
INFORMATION PURPOSES ONLY. THIS PRESENTATION DOES NOT CONTAIN ALL OF THE INFORMATION THAT IS MATERIAL TO AN INVESTOR. BY ATTENDING THE PRESENTATION OR BY
READING THE PRESENTATION SLIDES YOU ACKNOWLEDGE AND AGREE TO BE BOUND AS FOLLOWS:
This presentation is intended to provide a general overview of the Group’s business and does not purport to deal with all aspects and details regarding the Group. The information contained in
this presentation is only current as at the date of the presentation and is subject to further verification and amendment in any way without liability or notice to any person. The contents of this
presentation have not been verified by or on behalf of the Company or any of its advisers or by any independent third party. Accordingly, neither of the Group nor any of its affiliates, directors,
officers, employees or advisers make any representation or warranty, express or implied, as to, and no reliance should be placed on, the fairness, accuracy or completeness of the information
contained in this presentation or of the views given or implied. None of the foregoing shall have any liability whatsoever for any errors or omissions or any loss howsoever arising, directly or
indirectly, from any use of this information or its contents or otherwise arising in connection therewith.
This presentation does not constitute or form part of any advertisement of securities, any offer or invitation to sell or issue or any solicitation of any offer to purchase or subscribe for, any
securities in any jurisdiction, any form of financial opinion, recommendation or investment advice with respect to any securities, nor shall it or any part of it nor the fact of its presentation or
distribution form the basis of, or be relied on in connection with any investment decision. No reliance may be placed for any purpose whatsoever on the information contained in this
presentation, or any other material discussed verbally, or on its completeness, accuracy or fairness.
This presentation is strictly confidential to the recipient, may not be distributed to the press or any other person, and may not be reproduced in any form. Failure to comply with this restriction
may constitute a violation of applicable securities laws. Misuse of some or all of the information contained in this document (and any other information which may be provided to the recipient)
or of any other confidential matters relating to a possible securities offering may constitute behavior amounting to market abuse and a breach of applicable laws. Any such information is given
in confidence. All confidentiality obligations stated in this disclaimer will be in force indefinitely as from the date the recipient receives the present document.
Certain information contained in this presentation constitutes “forward-looking statements”. Forward-looking statements include potential for future growth, liquidity, capital resources and
capital expenditures, growth in demand for products, economic outlook and industry trends, development of markets, the impact of regulatory initiatives and the strength of competitors. The
forward-looking statements in this presentation are based upon various assumptions, many of which are based, in turn, upon further assumptions, including without limitation, management’s
examination of historical operating trends, data contained in the company’s records and other data available from third parties. These assumptions are inherently subject to significant
uncertainties and contingencies which are difficult or impossible to predict and are beyond its control and it may not achieve or accomplish these expectations, beliefs or projections.

CONTINUED ON THE NEXT SLIDE

 2
Disclaimer
CONTINUED FROM THE PREVIOUS SLIDE

In addition, important factors that, in the view of the company, could cause actual results to differ materially from those discussed in the forward-looking statements include the achievement
of the anticipated levels of profitability, growth, cost and its recent acquisitions, the impact of competitive pricing, the ability to obtain necessary regulatory approvals, and the impact of
general business and global economic conditions. Past performance should not be taken as an indication or guarantee of future results, and no representation or warranty, express or implied,
is made regarding future performance. These forward looking statements speak only as at the date as of which they are made, and none of the Company, the advisers or any of their respective
members, directors, officers, employees, agents or advisers intend or have any duty or obligation to supplement, amend, update or revise any of the forward-looking statements contained in
this presentation, or to reflect any change in the Company’s expectations with regard thereto or any change in events, conditions, or circumstances on which any such statements are based or
to update or to keep current any other information contained in this presentation.
This presentation is not directed to, or intended for distribution to or use by, any person or entity that is a citizen or resident of, or located in, any locality, state, country or other jurisdiction
where such distribution or use would be contrary to law or regulation or which would require any registration or licensing within such jurisdiction. The securities have not been, and will not be,
registered under the U.S. Securities Act of 1933, as amended (the “Securities Act”), or the securities laws of any state or other jurisdiction of the United States and such securities may not be
offered or sold within the United States or to, or for the account or benefit of, U.S. persons, except to qualified institutional buyers (“QIBs”) in reliance on the exemption from registration
provided by Rule 144A under the Securities Act (“Rule 144A”) that are also qualified purchasers (“QPs”) within the meaning of Section 2(A)(51) of the U.S. Investment Company Act of 1940,
and to certain non-U.S. persons in “offshore transactions” in reliance on Regulation S under the Securities Act. Accordingly, this presentation is being provided only to persons that are (i) QIBs
that are also QPs or (ii) non-U.S. persons outside the United States in accordance with Regulation S under the Securities Act. By accepting this information, you warrant that you are (i) a non-
U.S. person outside the United States (within the meaning of Regulation S) or (ii) a QIB that is also a QP. No public offering of the securities will be made in the United States of America or in
any other jurisdiction where such an offering is restricted or prohibited. Any failure to comply with this restriction may constitute a violation of United States securities laws.
This presentation is made to and is directed only at persons in the United Kingdom having professional experience in matters relating to investments who fall within the definition of
“investment professionals” in Article 19(5) of the Financial Services and Markets Act 2000 (Financial Promotions) Order 2005, and to those persons to whom it can otherwise lawfully be
distributed.
In addition, this presentation is only directed at, and being distributed in the European Economic Area (“EEA”), to persons who are “qualified investors” within the meaning of Article 2(e) of
Regulation (EU) 2017/1129.

 3

Agenda & content

 Olga Ustynova
 Chief Executive Officer
Y20 Highlights p5
 Andrey Otroshchenko
 Chief Marketing Officer

FY 20 Financials Nataliya Shevchenko
 p15
Performance Chief Financial Director

 Dmytro Ponomarenko
 Chief Strategy Officer
Strategy p24
 Andrey Otroshchenko
 Chief Marketing Officer
 Olga Ustynova
 Chief Executive Officer
Sustainability report Rishad Aliyev
 p30
 Deputy of CFO Vodafone is the only one European
 Head of Investors relations
 operator that brings the technologies
Appendices p33 of the future to Ukraine
 4
COVID-19 response Y20 Network Development Fastest Mobile Network in Ukraine Vodafone Global brand name and expertise Olga Ustynova Chief Executive Officer Y20 Highlights Y20 Customer Base Development Vodafone Ukraine key digital products Digital Journey: Key achievements 2020 Andrey Otroshchenko Chief Marketing Officer 5

Y20 Highlights

 4G
 Support community Customer base Investors &
 1 & business:
 2 Network 3 development
 4 Digital Journey 5 Partners relations

 Covid-19 Response with the • Growth of 4G coverage1 • 19 M Users EoP'20 • 7,3 M 4G users EoP'20 • Vodafone Eurobond
 help of more than UAH 60 M from 69% to 81% YoY • +17 % ARPU growth YoY • 3.5 M My Vodafone issue is the largest
 • Health & safety of • LTE 900 network launch Users 2 EoP'20 with 25 % DEBUT issue among
 • Post-paid users growth
 employees starting mid Y20 (more growth YoY corporate companies in
 with strong development
 than 800 base stations) • Exclusive partnership Ukraine (USD 500 M
 • Customers & partners IoT connections (+ 27%
 with YouTube & unique with a 6,2 % interest
 support • LTE 900 Network YoY)
 promo offer for YouTube rate)
 • Help for medicals and Sharing MoU for joint • 12.2 M Data users
 network development Premium, YouTube • Vodafone Partnership
 hospitals EoP'20
 Music, YouTube Kids and Brand Agreement
 • Telemedicine consultations • Ookla Speedtest Awards • + 26% Data Usage
 • Launch a NBIoT network extension for 5 years
 without leaving home by Winner during Q3-Q4 growth Q4’20 vs Q’19
 and connect to the global and access to expertise
 launching the Zdorro Smart 2020. Vodafone achieved (up to 5.2 Gb/user )
 IoT Vodafone platform in IT transformation, IoT
 Clinic a Speed Score of 30.9, with
 and 5G
 DL of 29.4 Mbps and UL of
 • Direct Financial Aid to the
 14.1 Mbps.
 Government

 YoY growth : +14% Revenue (up to UAH 18 bn)
 +18% OIBDA (up to UAH 9,8 bn)
 1 by Country population
 6 2 1-month active subscriber base
1 Support community COVID-19 response Employee health and safety Services for customers Help for medicals and hospitals Strict quarantine Adaptive quarantine 80% 50% Free 100 UAH ~$1mn ~$1mn employees employees calls and 30 mln Social worked from worked from for Financial info SMS support home home access roamers aid • Access to services (free unlimited access to • The company adapted work process to the services: Vodafone Press, Vodafone Music, new conditions of quarantine restrictions, Supply and Installation the number of lung Bookmate and BeFit) ventilation devices in hospitals around the helped employees to maintain their physical and mental health • Informing customers: country (extremely needed medical • Training for business clients (a series of equipment for patients with coronavirus) • Remote work format, medical support Help with buying of protective overalls for together with the insurance company and educational webinars : organization of electronic document management; IaaS; health workers regular online communication with Free access to Vodafone Services for medicals employees and online meetings with top self-service services; work with data. About 700 companies across Ukraine took part in Support for charitable initiatives managers were introduced. the webinars. 7

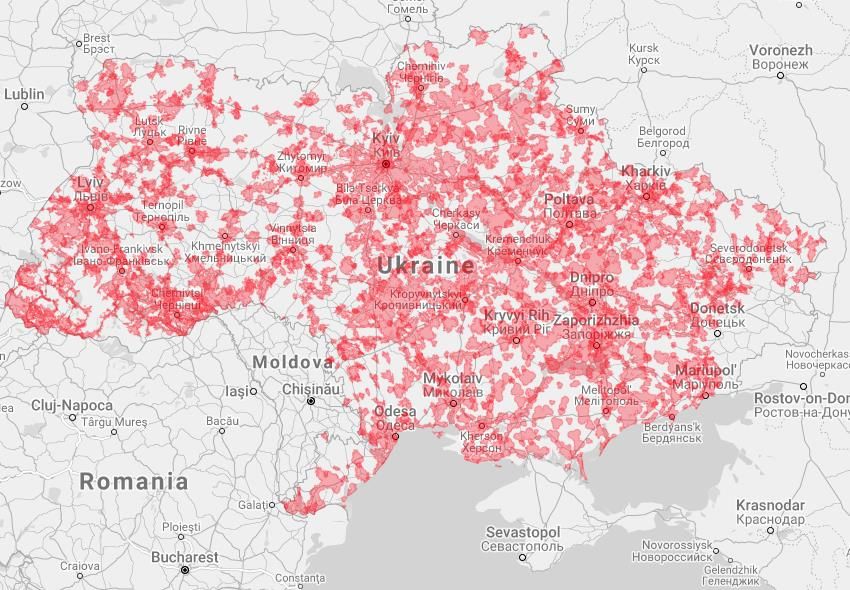
2 Network Y20 Network Development
 LTE coverage 4G network deployment, thousands of base stations

 Growth Y20 vs Y19 69% 81% 10,7
 9,1 9,8
 7,2 7,9

 1,5x
 Growth YoY
 4Q19 1Q20 2Q20 3Q20 4Q20

 Data usage, Gb/user

 4,8 5,0 5,2
 4,1 4,5

 +26%
 Growth Q4’20
 4Q19 1Q20 2Q20 3Q20 4Q20 vs Q4’19

 In the network deployment we are focused on the meeting demand of data usage via the capacity growth as well as coverage
 extension for rural areas in line with LTE 900 MHz license requirement
 8

2 Network Fastest Mobile Network in Ukraine
 332 thousand
#1 According to results of an independent study by OOKLA, Vodafone Ukraine has the highest download
 and upload speed among Ukrainian mobile operators in Q3-Q4 2020.
 unique devices used for measurements
 in OOKLA application in Q3-Q4 2020

 OOKLA Speed Score, Mbps Average (mean) DL speed, Mbps
 30,9 29,4
 26,1 26,9

 14,5 15,5

 Vodafone Kyivstar lifecell Vodafone Kyivstar lifecell

 Average (mean) UL speed, Mbps Average latency, ms.
 14,1 13,8 43,0
 39,0 38,0
 8,3

 Vodafone Kyivstar lifecell Vodafone Kyivstar lifecell
For the past two years, Kyivstar was the leader in terms of mobile internet speed, but as a result of LTE network development, bandwidth
transition to 15 or 20 MHz and usage of Dynamic Spectrum Sharing tools, we managed to overcome main competitor.

 9
3 Customers Y20 Customer Base Development
ARPU evolution (UAH) Customer base, EoP (mln)

Y20 vs Y19 17 % / UAH 10,8 Y20 vs Y19 (3,8) % / (0,7) mln
 Pre-paid Post-paid
 + 17% -0,2%
 + 22% -5,5% + 0,3% - 3,8%
 + 5% + 10% 73,4
 62,6 20,9 20,8 19,7 19,7 19,0
 51,2 1,9 1,9 1,9 2,0
 44,4 46,4 2,2

 19,0 18,9 17,8 17,7 16,8

 2016 2017 2018 2019 2020 2016 2017 2018 2019 2020

 The focus on 4G network and digital users development was reflected in data usage and ARPU (17% YoY).
 Pre-paid users decrease by 5 % was caused by quarantine measures and organic multi-SIM reduction. At the same time the Post-paid
 base has tendency to grow (+ 8%) with higher level of IoT connections .

 10
4 Digital Journey Key achievements 2020

 12,2 M Data users • Fast network development and Covid-19 challenges were
 reflected in usage patterns. The customers were able to
 study and work online, enjoy digital government services
 7,3 M 4G users and other benefits of the digital world.
 • As a result our digital products have become even more
 popular and data users grew up to 12,2 mln EoP'20.

 My Vodafone, 1М users, M IoT users, M

 +25% +27%
 • In 2020, Vodafone Ukraine launched a network for the
 Internet of Things based on NB-IoT technology. This
 2,8 3,5 0,7 0,9 network uses the global IoT platform of Vodafone Global.
 • Vodafone Ukraine IoT-clients increased by 73% during
 Dec 19 Dec 20 Dec 19 Dec 20
 2018-20. Key solutions: tracking vehicles and equipment to
 YouTube MAU in 1M Subs base, M, % Bid Data revenue growth, MUAH monitor work, routes monitor, etc. Business areas: security -
 +81% 25%, transport and logistics - 20%, trade - 15%, agriculture -
 12%, payment terminals - 9%, energy - 9%, etc.

 8,0 8,5

 2Q 20 4Q 20 2019 2020

 11
4 Digital Journey Vodafone Ukraine key digital products development 2016 2017 2018 2019 2020 Vodafone Music – My Vodafone 4G 1800&2600 MHz Cloud IaaS – for access to 4G 900 MHz Launch music service customer’s Launch – Data Network virtual computing resources Vodafone NB-IoT – for uninterrupted application. «My based on LTE vCPU, vRAM, vHDD communication between devices Vodafone TV – TV Vodafone» - your Vodafone IoT Monitor – IoT- channels, movies and mobile independence Vodafone Press - popular MNP is a service for connectivity solution for batch SIM card football for magazines in smartphone and transferring a mobile management in IoT devices smartphones and tablet number from one operator to another eSim tablets OMNI-Bulk messaging is a platform for Children club Vodafone multichannel targeted mailings YouTube Premium 12
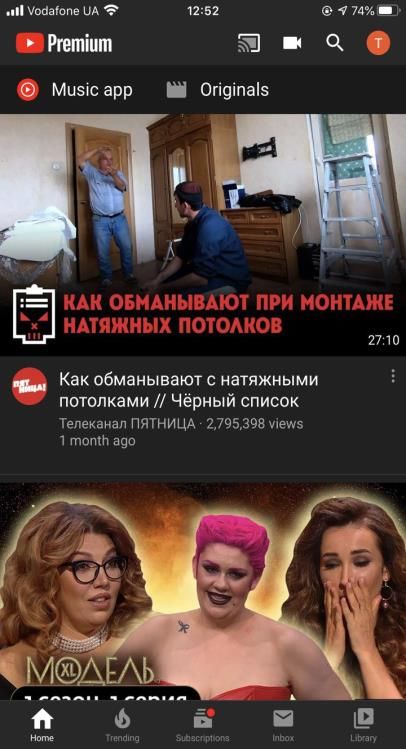
4 Digital Journey
 Vodafone launched joint advertisement promo with
BACKGROUND: YouTube
• YouTube is the biggest video service in the World
• YouTube is the main App by penetration and traffic consumption for data-users in Ukraine
• Vodafone Ukraine and YouTube agreed for exclusive partnership and launched unique promo
 offer

 Promo period 01.06.20 - 31.12.20

 Special offer 4 month trial period
 for YouTube Premium & Video PASS

 Special offer All Vodafone subscribers
 eligibility (base + activations)

 Activation USSD/ My Vodafone/ Vodafone Website / App YouTube

 13
5 Partners
 relations Vodafone Global brand name and expertise
Vodafone Ukraine has extended its branding and access partnership with Vodafone Group for next 5 years with extension option for one
year. A new strategic partnership gives an access to Vodafone's international expertise

 1 Exclusive non transferable Brand License in Ukraine

 2 Ongoing support of strategic decisions and new products rollout

 3 Access to the products and services portfolio

 4 Vodafone assistance, benchmarks, and best practices

 5 Flexible development and roll-out of proprietary digital products

 6 Vodafone's global digital products

 Access to Global Procurement Center, support for IT
 High Priority Projects & Initiatives transformation and Billing Swap, ongoing assistance for IoT, 5G
 initiatives development

 14
Group performance: • Revenue • OIBDA • Net profit Group CAPEX FY 20 Financials Capitalization FX Position Nataliya Shevchenko Performance Chief Financial Director 15
Solid track records in 2020 Changes in key indicators UAH (mln) USD (mln)1 2019 2020 2019 2020 Revenue 15 983 18 142 14% 619 673 9% OIBDA 8 325 9 828 18% 322 365 13% OIBDA, % 52,1% 54,2% 2,1% 52,1% 54,2% 2,1% Net profit 2 539 1 201 -53% 98 45 -54% CAPEX 2 3 788 3 784 -0,1% 147 140 -5% 1Average rate for year (25,84 UAH/USD for 2019, 26,96 UAH/USD for 2020) 2 excluding costs UAH 267 million related to purchase of spectrum licenses in 2020 16
Financial highlights
 Revenues (UAH, mln) Net profit (UAH, mln)
 3 000
20 000
18 000 2 500
16 000
 2 000
14 000
12 000
 1 500
10 000 Declining net
 14% Revenue
 8 000
 growth 1 000 Profit
 6 000
 4 000 ( YoY) 500
 (YoY)
 2 000 11 138 11 731 12 799 15 983 18 142 1 301 2 132 1 747 2 539 1 201
 - -

 2016 2017 2018 2019 2020 2016 2017 2018 2019 2020

 OIBDA (UAH, mln) and OIBDA margin 1(%)

12 000 54% 52% 54% 60%
10 000 43% 50%
 34% • Revenue: 14% growth due to increase in ARPU and digital
 8 000 40%
 services usage
 6 000 30%
 18% OIBDA
 • OIBDA: 18% growth due to increase in subscriber revenue
 4 000 20%
 2 000 10%growth
 • Decrease in Net Profit due to FX losses
 3 799 5 017 6 864 8 325 9 828
 - 0% (YoY)
 2016 2017 2018 2019 2020

 1OIBDA Margin = OIBDA/Revenues

 17
Group performance
Group revenue
(UAH mln) +6% +7% +1%

 4 505 4 391 4 789 4 837
 4 262 4 125

 3Q 2019 4Q 2019 1Q 2020 2Q 2020 3Q 2020 4Q 2020

Group revenue: factor analysis +14 % YoY
(UAH mln) 762
 1 775 30 18 142
 15 983 -6 -297 -105

 FY 2019 Voice&Data Other mobile Interconnect Roaming Sales of goods Other FY 2020
 mobile services services
 18
Group performance
 Group OIBDA +22% +8%
 (UAH mln) -1%
 2 556 2 760
 2 294 2 271 2 342 2 170

 3Q 2019 4Q 2019 1Q 2020 2Q 2020 3Q 2020 4Q 2020

 Group OIBDA : factor analysis +18 % YoY
 (UAH mln)

 1 772 168 45 10 175 9 828
 8 325 -286 -244 -137

 FY 2019 Voice&Data Interconnect Roaming Sales of G&A Consultations Salary Other 1 FY 2020
 mobile services goods
1other 19
 includes gain from disposal of payables and non-current assets
Group performance
 Group net profit/(loss) net profit/loss
 (UAH mln) UAH/USD, EoP
 +1% +394%
 -9%
 28.06
 1 012 776
 845 768 28.27
 26.69 28.30

 157
 23.69 -744

 3Q 2019 4Q 2019 1Q 2020 2Q 2020 3Q 2020 4Q 2020

 Group net profit: factor analysis
 (UAH mln)
 -53 % YoY
 1 503
 2 539
 295 1 201
 -1 938
 -842 -98
 FY 2019 OIBDA FX Interest expenses D&A Tax expenses Other 1 FY 2020
1 other includes interest income , ECL of financial assets, non-operating expenses 20
Group CAPEX

CAPEX dynamic (UAH, mln) CAPEX breakdown (UAH, mln)

 Capex cash (mUAH) Network
 Capex to sales,% construction
 SW&HW updates
 40,8% other
 32,9%
 28,6% 3 788 3 784
 23,7%
 20,9%

 1 888 1 907
 4 790
 4 208
 3 788 3 784
 3 191 1 257 1 391

 643 486
 2016 2017 2018 1 2019 2020 2 2019 2020 2

1 excluding costs UAH 2,433 million related to the purchase of 4G licenses in 2018
2 excluding costs UAH 267 million related to the purchase of spectrum licenses in 2020
 21
CAPITALIZATION
 Sensitivity to a possible change in
Debt profile As of 31 December 2020 USD exchange rates
• On 5-th February 2020 the Group
 successfully issued debut Eurobonds
 a 5- years tranches in amount of USD USD, mln UAH, mln UAH, mln
 500 million with a coupon rate of 6.2% -10% +10%
 28,27 UAH/USD
• As of 31.12.2020 the total face 25,45 UAH/USD 31,10 UAH/USD
 amount of pay off Eurobonds is USD Cash, cash equivalents and
 123 3 484 3 233 3 734
 34,3million deposits
 Total debt 633 17 907 16 404 19 410
• VF Ukraine has entered into FX Notes payable1 (Eurobond issue,
 Forward contracts to hedge the 452 12 793 11 514 14 072
 principal)
 interest payments due in 2021. Notes payable (Eurobond issue, %) 11 315 284 347
• Other debt in main part is Lease Other debt (Lease obligations (under
 170 4 799 4 606 4 991
 obligation (related to right-of-use IFRS 16)
 assets recorded as a result of the Net debt 510 14 423 13 171 15 676
 application of IFRS ‘Leases’ standard).
 OIBDA2 365 9 828 9 847 9 809
 CREDIT RATINGS as of 31.12.2020: Net Debt/OIBDA 1,4x 1,5x 1,3x 1,6x

 Fitch B / Stable 1Fair value (according
 to the FS under IFRS used by 9 standard “Financial instruments”) was initially
 recognized as face amount less transaction costs that were directly attributable to the issue
 (`USD16mln).
 S&P B / Stable 2 OIBDA = EBITDA (av. NBU exch. rate for 2020 was 26,96 UAH/USD)

 22
Liquidity overview
(as of 31 December 2020)
 Group cash breakdown by currencies Split of cash and equivalents between accounts and banks

 x1,8 growth YoY
 As of 31 December 2019 cash eq. was UAH 1 870 mln
 4%
 European bank
 2%
 9% Subsidiaries of International
 UAH UAH 981,6 mln
 33% 28% banking group
 National government-owned
 UAH USD
 Ukraine banks
 3 484 mln USD 47,3 mln Other (1 bank and cash)
 EUR 95%
 EUR 33,5 mln 85%
 International bank (Europe, A
 39% rating)

 eq. USD 123 mln

 Type of accounts
 • Cash and cash eq. on the current accounts are held mainly in large banks located in
 Ukraine that have a reliable reputation. 92% of them were held in four banks –
 246 664 57 662 1 855 subsidiaries of the large international banking groups.
 • Term deposits (with term more than 3 months) are held with subsidiary of large
 international bank (55%) and national government-owned bank.
 Short-term deposits (up to 3 months) Term deposits (> 3 months) • Currencies split secures FX position of the Group. Share of USD and EUR currencies is
 Cash On demand more than 70%.
 Current accounts

 23
Strategy update RETAIL revamp Dmytro Ponomarenko Chief Strategy Officer Strategy Brand Re-positioning Andrey Otroshchenko Chief Marketing Officer 24
Strategy Update
 Strategy 2018-20 Strategy 2021-22

 To create new business opportunities
 New Business Fields with maximum utilizing synergies and
 leverage of core business

 DIGITAL To keep strong position on the core
 DIGITAL telecom market with focus on the
 infrastructure mobile and fixed expansion

 LEADERSHIP For Stable core +
 business
 THE BEST growth

 OPERATOR To maintain the high level of Shareholder
 FOR returns and ensure robust of FCF
 THE BEST OPERATOR FOR generation
 CUSTOMER CUSTOMER

 Our strategic priorities are challenged by new reality.
 We understand that the role of DIGITAL and CUSTOMER CENTRICITY in the company’s strategy has to be maintained and even
 increased for CORE BUSINESS.

 25
Strategy vectors Y 2021 HIGH PRIORITY PROJECTS & THE BEST OPERATOR FOR CUSTOMER DIGITAL INITIATIVES • The best network for a digital • Digital products for mass market • Retail revamp customer My Vodafone network optimization and shifting Coverage 90% LTE & Network TV Platform to the digital channels Leadership • The best partner for business Digital users growth in Subs Base Leadership in IoT & Solutions • Convergence development 5G initiatives development Smart City discovering business • Brand strength • Advanced Data & Analytic solutions opportunities by organic network Growth of NPS and NW Big data development or M&A activity Perception, TOM growth CVM and RTM automation Youth Brand №1 Ad Tech & Programmatic • Customer service transformation 26
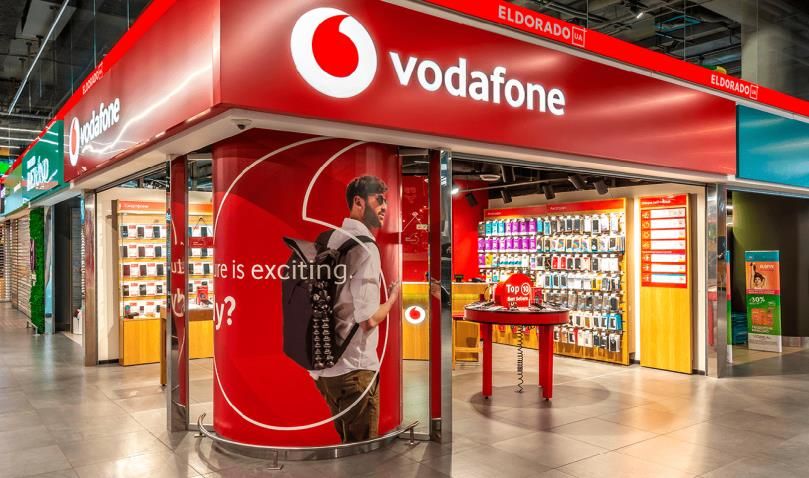
RETAIL revamp
 Revenue & OIBDA, UAH mln (Y20 vs Y19 dynamic) Number of stores
 +53 % / UAH 179 mln

 -4 % / UAH 46 mln
 1 16 1 12 2019 2020 251 182 Covid-19 quick response
 with moving into online
 8 2 EoP'19 EoP'20 store and digital service
 channels
 -162 Revamp project for 2021-2023

 2019 2020 -341 1 Store network 1.1 Network footprint optimization (incl. reformatting)
 transformation
 1.2 In-store personnel headcount optimization

 2 VF Retail HQ 2.1 HQ operating model and headcount rightsizing
 optimization
 3 In-store sales 3.1 Store sales excellence implementation
 operations
 improvement 3.2 Closer integration into VFU CVM

 3.3 Phone as a long-term subscription product

 4 Customer service 4.1 Customer service migration to remote channels
 digitization and optimization of service-anchor stores
 5 Other initiatives 5.1 Online store (part of VFR) performance
 improvement

 We are sure that our Retail chain couldn’t be the same format as before Covid-19 times.
 Our core target is the maximum effectiveness of the channel in the new reality. The key instrument is even more focused on Digital
 products for sales and services. 27
Brand Re-positioning | The relationship between Purpose-led
Vodafone & brand positioning
 Purpose-led Vodafone and the new brand positioning are two parts of the same Vodafone story. Our purpose is a long-term commitment which drives
 everything we do to create a better future by building a Digital Society, ensuring Inclusion For All whilst minimising our impact on the Planet.
 Our new brand positioning is rooted in creating a better future through a combination of our technology and the irrepressible
 drive of the human spirit brought to life by our new tagline Together we can.

 Vodafone
 Purpose We connect for a better future

 Purpose Technology + The Human Spirit = A better future
 led-brand (Our technology serves the irrepressible human drive for better)

 New brand Technology + The Human Spirit = A better future
 positioning (Our technology serves the irrepressible human drive for better)x

 28
Creating sustainable value for all stakeholders Dividend Policy Olga Ustynova Chief Executive Officer Sustainability report Rishad Aliyev Deputy of CFO Head of Investors relations 30
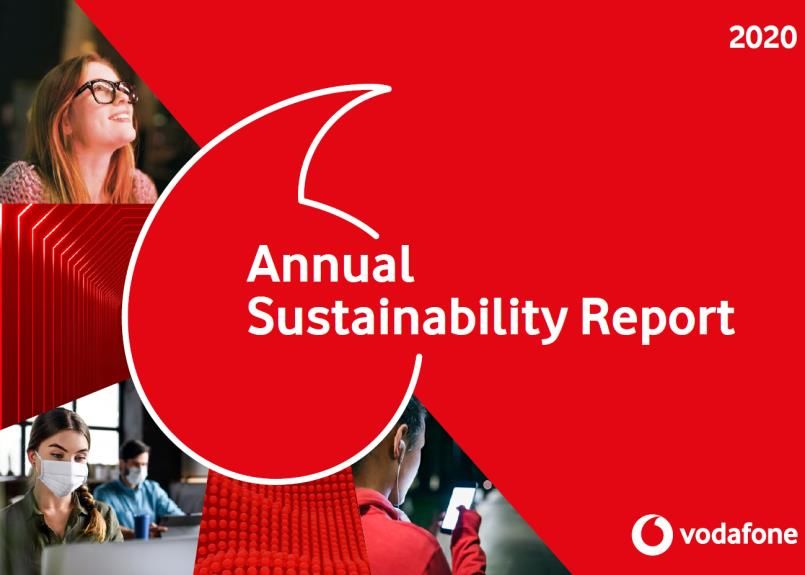
Creating sustainable value for all stakeholders
 • This year Vodafone Ukraine has issued the Sustainability report with overview and results for 2020 for the first time.
 • The report covers ESG (Environmental, Social, and Governance) and other nonfinancial information on PrJSC “VF Ukraine” and its subsidiaries: LLC “VF Retail”,
 LLC “ITSF” from 01.01.2020 to 31.12.2020.

 Sustainable development strategic priorities:

 Transparency Digital society Compliance
• Regular public reporting of • Achieving digital equality • Complying with Ukrainian
 the audited consolidated for all residents of Ukraine and international law
 financial statements • Creating infrastructure and • Developing and
 prepared in accordance with a fundamental implementing the
 IFRS technological basis for compliance system
• Quarterly financial and sustainable development • Aligning with the Anti -
 operational reporting social sphere, business, Corruption and Anti-Bribery
 economy as a whole policies

 For the next years we are planning to receive assuring of the report by the independent audit company. Also ESG rating and GRI standards application are our goals
 with future strategy of sustainability development.

 31
Dividend Policy
 The Regulation of dividend policy is to provide recommendations for paying dividends which are transparent and clear to the Company's
 Shareholders, as well as to ensure a balance between the interests of the Shareholders and the Company's needs for further development
 and investments.

 Calculation of dividends:
 Source Factors taken into account Amount of dividends
 • In 2021, 2022, 2023 and 2024
 financial years the target level of
 Implementation of dividend payments shall amount
 strategic development
 up to 50 per cent of the
 Company’s annual Net Profit
 Investment
 Net profit1 Execution of
 opportunities available
 level of dividend
 investment programs
 for business expansion payments • The amount of dividend
 payments may exceed the target
 Indebtedness that ensures
 level with the condition of
 the necessary indicators of compliance with the covenants
 solvency
 applicable to the Company.
1presented in the audited consolidated financial statements of the Company

prepared in accordance with IFRS

 32
Thank you

For future information and questions, please, contact:
Investor Relations or Rishad Aliyev (Head of Investors relations, Deputy of CFO),
ir@vodafone.ua

 33
Balance sheet statement
 (UAH millions) As of 31 December 2020 As of 31 December 2019

 Property and equipment 10,058 10,110
 Intangible assets 6,969 6,671
 Right-of-use assets 3,966 4,347
 Cost to obtain contracts and Deferred tax assets 574 767
 Total non-current assets 21,567 21,895
 Trade and other receivables 12,205 635
 Cash and cash equivalents 2,820 1,434
 Short-term investments 664 436
 Inventories 159 255
 Advances paid and prepaid expenses 156 92
 Current income tax assets, Other non-current assets, 219 243
 Total current assets 16,223 3,095
 Total assets 37,790 24,990
 Common stock 8 8
 Other components of equity 2 2
 Retained earnings 15,576 14,375
 Total equity 15,586 14,385
 Non-controlling interests 2 -
 Equity attributable 15,588 14,385
 Borrowing 12,793 -
 Lease obligation 3,687 3,610
 Provisions, and Contract liabilities 505 291
 Total non-current liabilities 16,985 3,901
 Trade and other payables 1,441 3,747
 Contract liabilities 1,446 1,377
 Lease obligation 1,112 1,031
 Provisions 559 277
 Borrowings 315 4
 Other financial liabilities 39 25
 Other non-financial liabilities and Income tax liabilities 305 243
 Total current liabilities 5,217 6,704
 Total equity and liabilities 37,790 24,990
 34
Profit and loss statement
(UAH millions) For the year ended 31 December
 2020 2019
Service revenue 17,202 14,938
Sales of goods 940 1,045
Revenue 18,142 15,983
Cost of services (4,595) (3,983)
Cost of goods (849) (999)
Selling, general and administrative expenses (3,161) (2,774)
Depreciation and amortization (4,801) (4,703)
Other operating income, net 291 98
Operating profit 5,027 3,622
Net charge for ECL of financial assets (110) -
Finance income 70 186
Finance costs (1,492) (650)
Currency exchange gain or (loss) (1,867) 71
Other expenses (32) -
Profit before tax 1,596 3,229
Income tax expense (395) (690)
Profit for the period 1,201 2,539

 35
Cashflow statement
(UAH millions) For the year ended 31 December
 2020 2019
Profit before tax 1,596 3,229
Depreciation and amortization 4,801 4,703
Other adjustments 1,916 (928)
Net cash provided by operating activities 8,313 7,004
Purchases of property and equipment (2,309) (2,754)
Purchases of other intangible assets (1,475) (1,034)
Purchase of 4G licenses (267) -
Financial aid and loan provided to related parties (11,618) -
Other proceeds and proceeds/(placement) of short-term investments 41 (116)
Net cash used in investing activities (15,628) (3,904)
Proceeds from borrowings 11,844 -
Repayment of borrowings (963) (2,774)
Repayment of other payables (1,776) -
Lease obligation principal paid (524) (512)
Dividends paid - (920)
Net cash (used in)/provided by financing activities 8,581 (4,206)
Net (decrease)/increase in cash and cash eq. 1,266 (1,106)
Cash and cash eq., beginning of the period 1,434 2,629
Effect of exchange rate changes on cash and cash eq. 120 (89)
Cash and cash eq., end of the period 2,820 1,434

 36
You can also read