Full Year 2020 - Soltec Power Holdings
←
→
Page content transcription
If your browser does not render page correctly, please read the page content below
Full Year 2020
DISCLAIMER
    This document has been prepared by Soltec Power Holdings, S.A. (“Soltec”) exclusively for use during the presentation of financial results of the nine-month period ended on 30 September 2020. As a consequence, thereof,
    this document may not be disclosed or published, nor used by any other person or entity, for any other reason without the express and prior written consent of Soltec .
    Soltec does not assume liability for this document if it is used with a purpose other than the above.
    The information and any opinions or statements made in this document have not been verified by independent third parties; therefore, no express or implied warranty is made as to the impartiality, accuracy, completeness or
    correctness of the information or the opinions or statements expressed herein.
    Neither Soltec nor its subsidiaries or other companies of the Soltec Group or its affiliates assume liability of any kind, whether for negligence or any other reason, for any damage or loss arising from any use of this document
    or its contents.
    Neither this document nor any part of it constitutes a contract, nor may it be used for incorporation into or construction of any contract or agreement.
    Any information in this document about the price at which securities issued by Soltec have been bought or sold in the past or about the yield on securities issued by Soltec cannot be relied upon as a guide to future
    performance.

    IMPORTANT INFORMATION
    Non-IFRS and alternative performance measures
    In addition to the financial information prepared in accordance with International Financial Reporting Standards (“IFRS”) and derived from our financial statements, this presentation contains certain financial measures that
    constitute alternative performance measures (“APMs”) as defined in the Guidelines on Alternative Performance Measures issued by the European Securities and Markets Authority (ESMA) on 5 October 2015
    (ESMA/2015/1415en) and other non-IFRS measures (“Non-IFRS Measures”). The financial measures contained in this presentation that qualify as APMs and non-IFRS measures have been calculated using the financial
    information from the Soltec Group but are not defined or detailed in the applicable financial reporting framework and have neither been audited nor reviewed by our auditors. We use these APMs and non-IFRS measures
    when planning, monitoring and evaluating our performance. We consider these APMs and non-IFRS measures to be useful metrics for management and investors to facilitate operating performance comparisons from period
    to period.
    While we believe that these APMs and non-IFRS measures are useful in evaluating our business, this information should be considered as supplemental in nature and is not meant as a substitute of IFRS measures. In addition,
    other companies, including companies in our industry, may calculate or use such measures differently, which reduces their usefulness as comparative measures.
    The businesses included in each of our geographic segments and the accounting principles under which their results are presented here may differ from the included businesses and local applicable accounting principles of
    our public subsidiaries in such geographies. Accordingly, the results of operations and trends shown for our geographic segments may differ materially from those of such subsidiaries

    Forward-looking statements

    Soltec cautions that this presentation contains statements that constitute “forward-looking statements”. Forward-looking statements may be identified by words such as “expect”, “project”, “anticipate”, “should”, “intend”,
    “probability”, “risk”, “target”, “goal”, “objective”, “estimate”, “future” and similar expressions. These forward-looking statements are found in various places throughout this presentation and include, without limitation,
    statements concerning our future business development and economic performance and our shareholder remuneration policy. While these forward-looking statements represent our judgment and future expectations
    concerning the development of our business, a number of risks, uncertainties and other important factors could cause actual developments and results to differ materially from our expectations.

2                                                                                                              Full Year 2020
DISCLAIMER
    The following important factors, in addition to those discussed elsewhere in this presentation, could affect our future results and could cause outcomes to differ materially from those anticipated in any forward-looking
    statement: (1) general economic or industry conditions in areas in which we have significant business activities or investments, including a worsening of the economic environment, increasing in the volatility of the capital
    markets, inflation or deflation, changes in demographics, consumer spending, investment or saving habits, and the effects of the COVID-19 pandemic in the global economy; (2) exposure to various types of market risks,
    principally including interest rate risk, foreign exchange rate risk, equity price risk and risks associated with the replacement of benchmark indices; (3) political stability in Spain, other European countries, Latin America and the
    US; (4) changes in laws, regulations or taxes, including changes in regulatory capital and liquidity requirements, including as a result of the UK exiting the European Union and increased regulation in light of the global financial
    crisis; (5) our ability to integrate successfully our acquisitions and the challenges inherent in diverting management’s focus and resources from other strategic opportunities and from operational matters while we integrate
    these acquisitions; and (6) changes in our ability to access liquidity and funding on acceptable terms.
    Numerous factors could affect the future results of Soltec and could result in those results deviating materially from those anticipated in the forward-looking statements. Other unknown or unpredictable factors could cause
    actual results to differ materially from those in the forward-looking statements.
    Forward-looking statements speak only as of the date of this presentation and are based on the knowledge, information available and views taken on such date; such knowledge, information and views may change at any
    time. Soltec does not undertake any obligation to update or revise any forward-looking statement, whether as a result of new information, future events or otherwise.

    No offer

    The information contained in this presentation is subject to, and must be read in conjunction with, all other publicly available information, including, where relevant any fuller disclosure document published by Soltec. Any
    person at any time acquiring securities must do so only on the basis of such person’s own judgment as to the merits or the suitability of the securities for its purpose and only on such information as is contained in such public
    information having taken all such professional or other advice as it considers necessary or appropriate in the circumstances and not in reliance on the information contained in this presentation. No investment activity should
    be undertaken on the basis of the information contained in this presentation. In making this presentation available Soltec gives no advice and makes no recommendation to buy, sell or otherwise deal in shares in Soltec or in
    any other securities or investments whatsoever. Neither this presentation nor any of the information contained therein constitutes an offer to sell or the solicitation of an offer to buy any securities. No offering of securities
    shall be made in the United States except pursuant to registration under the U.S. Securities Act of 1933, as amended, or an exemption therefrom. Nothing contained in this presentation is intended to constitute an invitation
    or inducement to engage in investment activity for the purposes of the prohibition on financial promotion in the U.K. Financial Services and Markets Act 2000.
    Historical performance is not indicative of future results

    Statements as to historical performance or financial accretion are not intended to mean that future performance, share price or future earnings (including earnings per share) for any period will necessarily match or exceed
    those of any prior period. Nothing in this presentation should be construed as a profit forecast.

    Third Party Information

    In particular, regarding the data provided by third parties, neither Soltec, nor any of its administrators, directors or employees, either explicitly or implicitly, guarantees that these contents are exact, accurate, comprehensive
    or complete, nor are they obliged to keep them updated, nor to correct them in the case that any deficiency, error or omission were to be detected. Moreover, in reproducing these contents in by any means, Soltec may
    introduce any changes it deems suitable, may omit partially or completely any of the elements of this document, and in case of any deviation between such a version and this one, Soltec assumes no liability for any
    discrepancy.

3                                                                                                                 Full Year 2020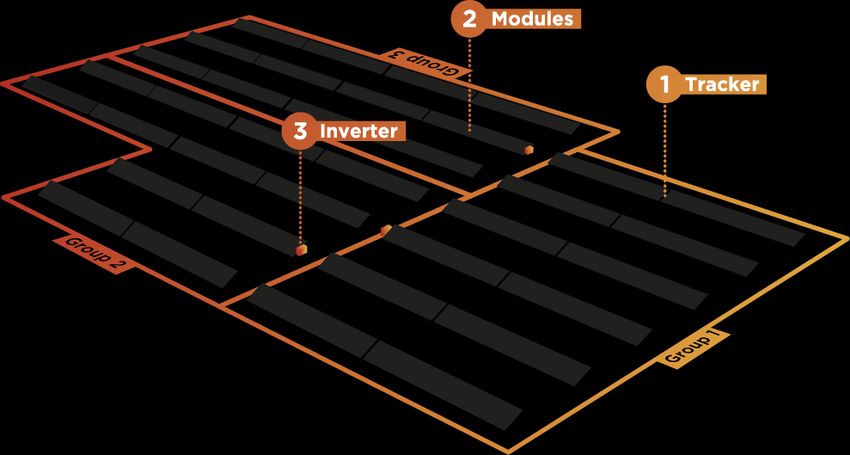
AGENDA

    01
    FY 2020 Key
                  02
                  Operational
                                03
                                FY 2020
                                                  04
                                                   Strategy
                                                              05
                                                              Closing
                                                                        06
                                                                        Appendix
    highlights    Indicators    Results                       remarks

4                                         Full Year 2020
01
FY 2020
Key Highlights
Full Year 2020FY 2020 KEY HIGHLIGHTS
Full Year 2020, a transition year: Soltec Industrial impacted by COVID and positive contribution from Powertis
• FY 2020 impacted by COVID-19, with a significant impact in Q2 and Q4 in Soltec Industrial.
• Track record of more than 8.4 GW in a challenging environment.
• Record Backlog and Pipeline in Soltec Industrial with unprecedented figures: €190 Mn (1.9 GW) of Backlog and €2,665 Mn (24.3 GW) of Pipeline for the year 2020.
• Project development Pipeline: 5.0 GW.
• Soltec Industrial suffered from: (1) delays due to the effects of the pandemic and increases in solar modules prices, combined with (2) increases in some of its
expenses that also affected margins
• Powertis rotated1 more than 1.2 GW2 in Spain, Brazil and Italy, reinforcing its business model. Financial impact of the asset rotation not yet reflected in P/L
completely (pending to recognize €12.4 Mn of Italy).
• Strong balance sheet in 2020.
• Net cash position of €11.5 Mn.
• 1.4 Mn Tn CO2 emissions avoided in 2020.
(1) Totally or partially.
6 (2) Includes 625 MW from Leo Silveira. 249 MW from Aquila and 373 MW from Total. Full Year 2020FY 2020 HIGHLIGHTS
Financial Figures1 By Business Unit Backlog & Pipeline
Soltec Industrial Soltec Industrial
Revenues Adj. EBITDA Backlog Pipeline
€235.6 Mn (€9.4 Mn) Revenues EBITDA Net Profit €190 Mn €2,665 Mn
(+33% vs ‘19) (+128% vs ‘19)
€236.2 Mn (€11.3 Mn) (€16.2 Mn)
1,891 MW 24,340 MW
(+48% vs ‘19) (+152% vs ‘19)
Powertis Powertis
Net Profit Net cash Backlog2 Advanced Early St.
(€4.9 Mn) €11.5 Mn Revenues EBITDA Net Profit 1,342 MW 792 MW 1,366 MW
€0.6 Mn €2.6 Mn €11.9 Mn (+8% (+55% (+145%
vs ´19) vs ‘19) vs ‘19)
(1) Sum of Industrial and Powertis may not foot with SPH figures due to consolidation adjustments
7 (2) Including 625 MW rotated. Full Year 2020IMPACT OF THE COVID
An unprecedented situation with impact in our value chain
KEY HIGHLIGHTS
Delays in projects
increasing the backlog
but delaying income • 2020 has been an exceptional year due to the unexpected COVID-19 crisis that
recognition strongly impacted in our clients, suffering delays in some of our projects.
• Delays in projects during 2020 were due to a combination of port congestion,
Increase in Increase in Supplies & project site labor constraints and interconnection and financing delays, together
External services transportation with an increase in the costs of the solar panels.
COVID 19 expenses
• Impacts in our expenses are the following:
Impacts in Soltec
Industrial • Personnel
• Supplies & transport
• Insurance
• External services
Increase in Increase in
insurance Personnel • As a result, our P/L suffered with more than 26€ Mn of additional expenses linked
policies expenses to the COVID.
8 Full Year 20202021 OUTLOOK
• 3,056 MW1 in 2021 for more than €896 Mn to be recognized in 2021-2023.
SOLTEC INDUSTRIAL
• Targeting new markets to profit from the growth of solar PV worldwide.
Back on track in 2021
• Reinforcing our relationships with strategic suppliers.
DEVELOPMENT • More than 1 GW to be rotated (totally or partially) in 2021 in Spain, Italy and Brazil.
Outlook for 2021 • Entering USA and Colombia.
OUR VISION • SolarFighter: the first complete kit offering a solar tracker, PV module and inverter specifically designed for
distributed generation solar plants.
Become an integrated PV
player • Green Hydrogen and storage: Founder member of the Green Hydrogen Association of the Region of Murcia.
(1) Includes contracts in backlog and contracts in pipeline with 100% MOU signed.
9 Full Year 202002
Operational
Indicators
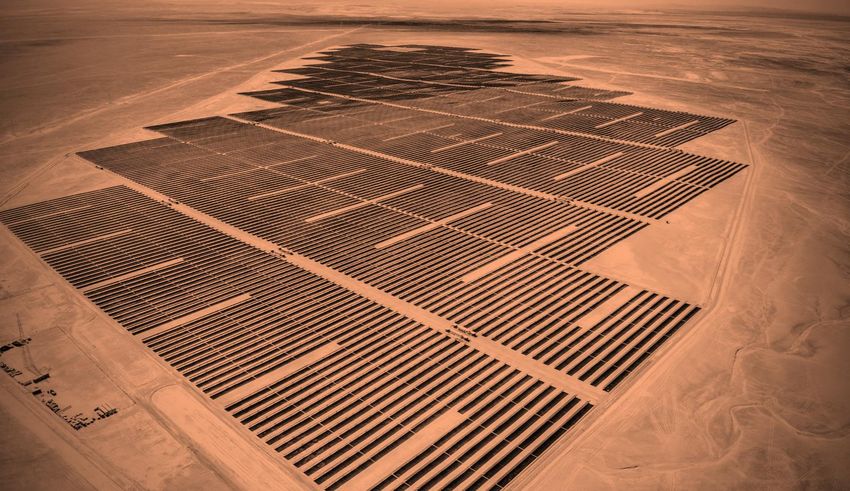
Full Year 2020A STRONG AND CONSOLIDATED LEADERSHIP
+ 8.4 GW Track record of tracker delivery projects since 2014
Proven track-record: Globally diversified to avoid risks and Benefit
17 years of experience from the growth of the market
Throughout its 17 years of history, Soltec Power Holdings has delivered solar Breakdown of Soltec’s cumulative GW by geography
trackers projects for a total of 8.4 GW
8.4 GW MEA; 8%
APAC; 3%
Evolution of delivered GW Europe; 17%
(GW)
6.1 GW
2.23
3.2 GW NA; 28%
2.91
1.7 GW
0.1 GW 0.4 GW 0.7 GW
1.51
0.… 0.32 1.03 Latam; 44%
0.07
2014 2015 2016 2017 2018 2019 2020 Europe NA – North America (Mexico & US) APAC – Asia-Pacific
Cummulative GW Soltec Yearly GW installed Soltec Latam MEA – Middle East & Africa
The company's efforts to reduce its emissions are part of its corporate commitment to become an emissions-neutral
company. In this line, in addition to adopting annual reduction targets, it avoided 1.4 Mn Tn CO2 in 2020
11 Full Year 2020FY 2020 RECORD OPERATIONAL INDICATORS
Order Backlog & Pipeline1 c. €190 Mn (+33% vs 2019) and €2,665 Mn (+128% vs 2019)
Pipeline: 62 MW / € 6 Mn
Pipeline: 130 MW / € 12 Mn
Backlog: 120 MW / €21 Mn Backlog: 4 MW / € 0 Mn
Backlog: 486 MW / € 46 Mn Pipeline: 2,233 MW / € 376 Mn Pipeline: 23 MW / € 2 Mn Powertis
Pipeline: 1,763 MW / € 156 Mn
Pipeline: 534 MW / € 45 Mn Pipeline: 850 MW / € 448 Mn Backlog: 3 MW / € 0 Mn
contributes to
Soltec Industrial
Pipeline: 600 MW / € 48 Mn
Pipeline: 3,375 MW / € 270 Mn projects
Pipeline: 2,000 MW / € 160 Mn
Pipeline: 1,524 MW / € 146 Mn
Backlog: 248 MW / € 19 Mn Pipeline
Pipeline: 492 MW / € 84 Mn 1,606.0 MW
Pipeline: 2,100 MW / € 127 Mn
Backlog: 26 MW / € 2 Mn Pipeline: 690 MW / € 58 Mn €720.5 Mn
Pipeline: 19 MW / € 2 Mn
Pipeline: 117 MW / € 15 Mn Backlog
Backlog: 2 MW / € 0 Mn
230.0 MW
Pipeline: 1,845 MW / € 155 Mn
Backlog: 774 MW / € 70 Mn €33.2 Mn
Pipeline: 660 MW / € 53 Mn
Pipeline: 426 MW / € 41 Mn
Backlog: 228 MW / € 31 Mn
Pipeline: 4,898 MW / € 462 Mn
(1) Value of total Installed capacity of all potential pipeline projects without assigning probability
12 Full Year 2020FY 2020 RECORD OPERATIONAL INDICATORS
Unprecedented Backlog and Pipeline in Soltec Industrial
BACKLOG KEY HIGHLIGHTS GEOGRAPHICAL DISTRIBUTION
1,891 MW • Record figures that reflect the APAC; 8%
+48%
1,280 MW €190 Mn expectations of growth
MW Europe; 31%
€143 Mn • Projects not executed in Q4 are reflected MEA; 23%
in Backlog and Pipeline
Q3 2020 Q3 2020 +33% • €190 Mn vs €128 Mn in Q3 2020
1,195 MW €128 Mn €Mn • €2,665 Mn vs. €2,551 Mn in Q3
2020
NA; 12%
2019 2020 Latam; 25%
KEY FIGURES
PIPELINE
▪ € 190 Mn ▪ 100% of projects with signed
Order Backlog
24,340 MW +152% ▪ 1,891 MW agreement
€2,665 Mn MW ▪ Probability 100%: €806 Mn (out
€1,171 Mn of which 720.5 Mn from Powertis)
9,675 MW Probability >50% ▪ Probability 90%: €166 Mn
Q3 2020 +128%
22,311 MW Q3 2020
€2,551 Mn €Mn OrderOrder
▪ €&2,665
Backlog
Pipeline (1) Pipeline €1,917
Mn Breakdown (1)(2)Mn ▪ Probability 80%: €42 Mn
▪ 24,340 MW ▪ Probability 70%: €176 Mn
▪ Probability 60%: €241 Mn
2019 2020
▪ Probability 50%: €486 Mn
▪ ProbabilityA STRONG 2021 IN SOLTEC INDUSTRIAL
• + 3,056 MW1 • + € 896 Mn1
2,841 4,947
MW MW
€876 Mn €1,086 Mn
1,891 208 6 Exp. 2023
290
MW MW
MW
€18 Mn €2 Mn
€190 Mn
424 Exp. 2022
371 Exp. 2021
Dec 31, Backlog Backlog MOU Feb 25, Dec 31, Backlog Backlog MOU Feb 25,
2020 January February 21 100% 2021 2020 January February 21 100% 2021
(1) Includes contracts in Backlog and contracts in Pipeline with 100% MOU signed.
14 Full Year 2020FY 2020 THE STRENGTH OF OUR OPERATIONAL INDICATORS
Project Development - Backlog of 717 MW(1) and Pipeline of 4,269 MW(2)
KEY HIGHLIGHTS
SPAIN
Backlog: 4.5 MW • Full operations in three countries
Advanced Stage: 593 MW • +20 new team members
Early Stage: 460 MW • 1.2 GW transacted
Id. Opportunities: 1,039 MW • 230 MW in construction in Brazil and Spain
• 4,986 MW in development
• Cash flow positive in 2020
ITALY 2020 MILESTONES
Advanced Stage: 199 MW • Powertis sign an agreement with Total for the joint development of
BRAZIL Early Stage: 734 MW 1GW of PV projects in Spain
Rotated(3): 625 MW • Powertis and BNDES reach an agreement for the financing of the
Id. Opportunities: 260 MW
Araxá 1 and 2 photovoltaic plants (194 million Brazilian Reais)
Backlog: 713 MW
• Powertis reinforces its position in Brazil thanks to a €30-million
Early Stage: 173 MW
funding scheme granted by BNDES
Id. Opportunities: 813 MW • Powertis signs an agreement with Aquila Capital for joint
(1) Installed capacity of all potential projects not weighted by our estimate of the probability that the project will be completed; (2)
development in Italy of projects totaling up to 750 MW
Installed capacity of all potential pipeline projects and not assigning probability not weighted by our estimate of the probability that the
15 project will be completed. (3) Full divestment. Full Year 2020FY 2020 THE STRENGTH OF OUR OPERATIONAL INDICATORS
Unprecedented backlog and pipeline in Powertis
BACKLOG 5.0 GW1
MW/Year
1,245 1,342 Pipeline 2020
625 Rotated
+8%
717 Backlog
STATUS DISTRIBUTION1 COUNTRY DISTRIBUTION1
2019 2020
Backlog 14%
ADVANCED STAGE Advance Stage 42%
Brazil
24% 34%
16%
MW/Year Spain
Early Stage
792 28% Italy
511 +55% Iddentified Opp. 42%
KEY FIGURES
2019 2020
Technology Solar PV projects under development
EARLY STAGE
▪ Brazil: 2,323 MW
MW/Year Capacity ▪ Italy: 1,193 MW
1,366 ▪ Spain: 2,096 MW
+145% ▪ Rotated: 625 MW
558 Degree of ▪ Early Stage: 1,366 MW
▪ Backlog: 717 MW
Development ▪ Identified Opp: 2,112 MW
▪ Advanced Stage: 792 MW
2019 2020
(1) Excluding assets rotated in Brazil (full divestment).
16 Full Year 2020IMPACT OF THE AGREEMENT IN ITALY
Joint Development Agreement between Powertis and Aquila to develop up to 750 MW in Italy
KEY HIGHLIGHTS STRUCTURE & OWNERSHIP
▪ Development target of up to 750 MW in Italy of utility-scale solar PV projects 2
▪ Aquila can purchase Powertis’s projects once they have secured land & interconnection rights.
▪ Powertis continues as developer until projects reach “ready-to-build” status.
▪ Soltec Industrial has certain rights to supply the trackers and secures construction of the
projects as EPC provider. Powertis
51% 49%
▪ SPV: In December 2020 Powertis formalized the transfer of 51% of 10 SPVs to Aquila
Capital (249 MW).
▪ Purchase price is paid in two installments: 1) 50% when the SPVs are transferred; 2) 50% at
RTB
▪ Development Cost is borne by Aquila (51%) and Powertis (49%) from milestone 1 above.
▪ The price of Aquila’s option to buy Powertis’ remaining 49% at RTB or COD is based on a pre-
agreed financial model and IRRs.
• Impact of the transaction: €12.4 Mn to be recognized in 2021 and 2022 when reaching RTB
17 (1) ALBATROS PROJECTS XXIV S.à.r.l., investment vehicle managed by Aquila Capital
(2) Projects of 2.5MW orgreater
Full Year 2020POWERTIS: A BUSINESS OF REALITIES ACCOMPLISHED
Impact of the Assets rotated in 2020
Sale of Leo Silveira Joint Development Agreement Joint Development Agreement
to ATLAS entered between Powertis and Total2 entered between Powertis and
to develop up to 1 GW of solar PV Aquila Capital3 to develop up to 750
projects in Spain MW of solar PV projects in Italy
Impact in 2020: Impact in 2020: Impact in 2020:
€ Mn P&L Line item Cash inflow €3.2 Mn
P/L € Mn
Impairment -0.5 Other profit
EBITDA 7.4
Solatio debts 6.2 Financial revenue
Financial revenue 3.5
ExchangeRt. 3.7 Net exchange rate Total impact P/L 10.9
Impact in 2021, 2022:
Impact P/L 9.4 P/L €12.4 Mn
Impact in 2021: P/L € Mn
EBITDA 6.3
Cash inflow €14.9 Mn
Financial revenue 6.1
Exchange rates differences (€5.3 Mn) Total impact P/L 12.4
18 Full Year 20202021 EXPECTED ROTATION ACTIVITY IN POWERTIS
2021 Provides us a good visibility
EXPECTED PIPELINE 2021 POWERTIS (GW) 2021 ASSET ROTATION POWERTIS (MW)
10 GW 1 GW
Pipeline 2021 To be transacted1 2021
Rotated1 in
10 625 2020
1
2
5
3
4 359 343
298
Dec 31, Brazil Spain Italy New Dec 31, 2021
2020 markets Brazil Spain Italy
KEY HIGHLIGHTS
• New Markets: USA and Colombia.
19 (1) Includes all projects; either full or partial sale and/or sell of any remaining equity in the projects
Full Year 202003
FY 2020
Results
Full Year 2020FY 2020 BY BUSINESS
SOLTEC POWER HOLDINGS INDUSTRIAL POWERTIS
€ Mn FY20 FY19 % FY20 FY19 % FY20 FY19 %
Revenues 235.6 356.8 (34%) 236.2 356.7 (34%) 0.6 0.1 351%
Adj. EBITDA (9.4) 20.4 n.m. (11.3) 22.2 n.m. 2.6 (1.8) n.m.
Net Profit (4.9) 1.3 n.m. (16.2) 1.8 n.m. 11.9 (0.4) n.m.
KEY HIGHLIGHTS
• Soltec Industrial: Impact of COVID in Q2 & Q4 2020
• 2020 has been an exceptional year due to the unexpected COVID-19 crisis that strongly impacted in our clients, suffering delays in some of our projects.
• Delays in projects during 2020 were due to a combination of port congestion, project side labor constraints and interconnection and financing delays, together with an
increase in the costs of the solar panels.
• Powertis: Good evolution of the business
21 Sum of Industrial and Powertis may not foot with SPH figures due to consolidation adjustments Full Year 2020COVID-19 impact
QUARTERLY 2020 BY BUSINESS registered in Q2 and Q4
In Soltec Industrial
INDUSTRIAL
EBITDA Adj.
€ Mn Q1 20 Q2 20 Q3 20 Q4 20 € Mn 5.7
3.7
SOLTEC POWER HOLDINGS Revenues 60.9 55.5 84.3 35.5
Q1 20 Q2 20 Q3 20 Q4 20 Adj. (1.1) (6.8) 3.7 (7.0)
(1.1)(1.0) (1.3) (0.8)
€ Mn
EBITDA
(6.8) (7.0)
Net (2.5) (6.6) 4.4 (11.6)
Revenues 60.8 54.9 84.9 35.1 Profit
Q1 Q2
Soltec Industrial
Q3
Powertis
Q4
POWERTIS
Net Profit
Adj. Q1 20 Q2 20 Q3 20 Q4 20
(2.4) (8.1) 9.3 (8.2) € Mn
EBITDA € Mn 11.8
Revenues 0.2 - 0.5 - 2.5 4.4
0.3
Net
(0.3) (9.0) 16.3 (11.9) Adj.
Profit (1.0) (1.3) 5.7 (0.8) (2.5) (2.6)
EBITDA (6.6)
(11.6)
Net
2.5 (2.6) 11.8 0.3 Q1 Q2 Q3 Q4
Profit
KEY HIGHLIGHTS Soltec Industrial Powertis
• Soltec Industrial recorded the impact of COVID 19 mainly in Q2 and Q4 due to a delay in the recognition of our sales combined with an increase (as a % of sales) of
some of our expenses due to the pandemic (personnel, supplies & transport, insurance and external services)
22 Sum of quarters may not foot with FY figures due to consolidation adjustments Full Year 2020REVENUES BRIDGE: FROM 2019 TO 2020
Projects delayed, not cancelled. Sharp reduction of revenues in Q4 2020.
356.7 (88.5)
(38.5)
6.6 236.2
35.5 Q4
84.3 Q3
55.5 Q2
Q1
60.9
Revenues Supply of trackers Installation Others 1 Revenues
Soltec Industrial Soltec Industrial
2019 2020
23 (1) Includes other construction services and O&M services. Full Year 2020EXPENSES AS A % OF REVENUES
Impact of COVID in expenses. 2020-2019 comparison of main figures.
Expenses as a % of Soltec Industrial revenues KEY HIGHLIGHTS
Revenues: €356.7 Mn Revenues: €236.2 Mn
Expenses impacted Expenses impacted
by COVID: 90% by COVID: 102% 1. Supplies + transport expenses
Insurance; 1% Impact: €9.6 Mn in 2020 due to COVID-19 as a consequence of the increase in
Ext. Services 3% subcontractors and transportation costs required to meet our commitments with
Ext. Services 2% Personnel 15% our clients.
Personnel 9%
Personnel expenses
Impact: €14 Mn. Increase in personnel expenses due to deploying additional
resources to the projects to mitigate the impact of the pandemic in our operations.
External services
Supplies + Supplies +
transport transport Impact: €1.4 Mn. Increase in external services due to additional measures
79% 83% undertaken in order to deal with COVID –19 impact on projects.
2. Insurance
Impact: €1Mn. Higher insurance premiums as a consequence of COVID-19 impact.
2019 2020
24 Full Year 2020EXPENSES AS A % OF REVENUES
Quarterly data
Soltec Industrial Soltec Industrial Soltec Industrial Soltec Industrial
Revenues: €60.9 Mn Revenues: €55.5 Mn Revenues: €84.3 Mn Revenues: €35.5 Mn
Expenses impacted Expenses impacted Expenses impacted Expenses impacted
by COVID: 97% by COVID: 109% by COVID: 91% by COVID: 123%
Insurance 3%
Ext. Services 6%
Insurance 1% Personnel
Ext. Services Personnel
2% Ext. Services 20%
16%
Personnel 3%
18% Personnel
10%
Supplies & Supplies &
transport Supplies &
Supplies & transport transport
93% 94%
transport 77%
77%
Q1 2020 Q2 2020 Q3 2020 Q4 2020
25 Full Year 2020REVENUES BREAKDOWN
REVENUE BREAKDOWN BY GEOGRAPHY1 (%) REVENUE BREAKDOWN BY CUSTOMER (%)
Others; 1%
APAC; 6% Others; 8%
Spain; 28% AES; 2% Enel; 22%
EDF; 2%
LatAm Jinko; 3%
(ExBrazil); 26% Engie; 3%
GPG; 4%
Grupo Ortiz;
4%
Metka; 5% Brookfield; 13%
Sterling &
Wilson ; 5%
Solar Century;
Brazil; 19% Cobra; 7% PCL 12%
North Construction
America; 20% Services;10%
KEY HIGHLIGHTS
• Spain and Latam accounted for 73% of the Group’s total revenues, reinforcing the consolidated position of the Group in LatAm and Europe.
• During 2020, Soltec Power Holdings continued with its customer base diversification trend of the last years with international Tier I clients in both its Industrial and
Development Business Lines.
26 (1) North America includes Mexico. It does not take into consideration eliminations.
Full Year 2020NET FINANCIAL DEBT PROFILE
€, 000
€127,903 €11,501
KEY HIGHLIGHTS
• Soltec’s successful IPO has positioned the company to obtain
a Net Financial Cash Position of €11.5Mn, which reinforces
the Company’s Balance Sheet, allowing it to;
a) Address the growth opportunities in the PV
industry, fully executing the business plan
b) Improve Soltec Industrial’s capacity to obtain
additional bank guarantees
(€116,402)
Gross Financial Debt Cash and other financial Net cash position
liquid assets
27 Full Year 2020CASH FLOW
€, 000
€141,051 €125,748
(€245)
€25,935
(€34,109)
(€6,884)
Cash & cash equivalents Cash flows from Cash flows from Cash flows from Effect of exchange Cash & cash equivalents
at the start operating activities investment activities financing activities rate variations at the end
of the Period of the Period
28 Full Year 2020SYNDICATED FACILITY
2018 SYNDICATED FACILITY EXTENSION
Maturity 28 Sep 2021 Maturity 11 Feb 2024
Revolving credit facility Bankable projects €70 Mn Revolving credit facility Bankable projects €80 Mn
(RCF) (RCF) (+10 Mn)
Euribor +2.5% Free disposal €10 Mn Euribor +2.5% Free disposal €10 Mn
Bank guarantees Bank guarantees
€20 Mn €110 Mn
0.9% p.a. 0.9% p.a. (+90Mn)
ADDITIONAL BANK RISK: €3 Mn ADDITIONAL BANK RISK: €10 Mn
Exceptions Exceptions
▪ FX Derivatives ▪ FX Derivatives
▪ Additional bank guarantees: € 20 Mn ▪ Additional bank guarantees: € 20 Mn
Covenant: EBITDA/FINANCIAL RESULT>2.5 Covenant: NFD/EQUITY04
Strategy
Full Year 2020OUR VISION: A GLOBAL SOLAR PROVIDER
The right steps in the right direction
1 2 3
Positioning the Increasing our product Entrance in
company for a green offer to consolidate our New Markets
and sustainable future Brand as a global to capture growth
based in hydrogen and provider, near our and diversify risks
storage clients: SolarFighter
Sustainability remains at the core of Soltec’s strategy
The company's efforts to reduce its emissions are part of its corporate commitment to become an emissions-neutral
company through more efficient products and constant innovation
31 Full Year 2020SOLARFIGHTER: NEW PRODUCTS FOR NEW NEEDS
Soltec is diversifying its product catalog and client base, offering a new opportunity for projects up to 12 MW
SolarFighter is the first PV plant all-in-
one designed for Distributed Generation
for industrial and commercial projects up
to 12 MW.
With SolarFighter, Soltec entries in the
GD PV market, offering a complete kit for
private developers with Soltec’s
experience and quality now applied to
the GD projects and easing the
construction of the PV plants.
SolarFighter is a standardized, unique,
and competitive product using the best-
in-class technology that supposes a great
advance to accelerate significantly the
developing and the construction of the
plants.
32 Full Year 2020OUR STRENGTH: NEAR OUR CLIENTS
Soltec adds three new facilities in Mexico, Saudi Arabia and India to certify suppliers
KEY HIGHLIGHTS
Soltec adds new capabilities to approve
suppliers strategically located Soltec maintains in-house manufacturing capabilities
2 Existing Facilities:
• 1 in Murcia (Spain) & 1 in Salvador da Bahia (Brazil)
3 New capabilities to approve suppliers in strategic locations:
•1 MEXICO
Optimal manufacturing market strategically located to supply USA.
•2 SAUDI ARABIA
Positioning in the Middle East, the market with the highest growth
expectation in the world, being Saudi Arabia, the second highest growth
expected market in the Middle East, where local manufacturing is
usually a requirement in most projects.
•3 INDIA
New supplier
It is strategic market to supply the whole world, especially Asia.
facilities
33 Full Year 2020IN THE CORE OF OUR STRATEGY: ESG COMMITMENT
STRATEGIC PILLARS FOR 2021 ACTION PLAN
GOOD
ENVIRONMENT SOCIETY INNOVATION PEOPLE
GOVERNANCE
1,402,008 Mn CO2 + 75,000 € to local +43% women in the Launch of SF7 Tandem >41.4k hours of training
Emissions avoided communities and Board Lauch of SF8
donations to + 43% independent 19.4% women
60% plastic reduction organizations and directors Hydrogen and Storage
COVID -19 Lead Independent SolarFighter Soltec wellbeing
100% clean energy Directors
+ 150 volunteers
CNR integrated by Solteach: training
Soltec Foundation independent directors programs
Compliance Certification
Fiscal Certification Equality committee
34 Full Year 202004
Closing
remarks
Full Year 2020MANTAINING OUTLOOK 2021-2023
1
Expected Market ▪ 2019 trackers market share expected to be maintained in the next 3 years (c.10%)(1)
Share ▪ Additional business from Powertis projects c.15% of initial tracker MWs deliveries (all including full suite of additional services)
2
▪ Estimated revenue split:
▪ Trackers Supply: 65%-75% (expected lower split estimations on the long term ( c. 55%-65%))
▪ Installation: 1%-5%
Soltec Industrial
Additional Services
▪ BoP: 5%-10%
▪ EPC: 20%-25%
▪ O&M: 1%-3%
3
Margins ▪ Gross margin expected to remain stable as industry price reductions (c. 5% CAGR 20-25)(2) are transferred to suppliers
4
Cash Flow ▪ Soltec Industrial expected to become cash–flow positive from 2021 onwards (or earlier)
5
Working Capital ▪ Successful implementation of sales efficiency measures expected to maintain cash conversion cycle to < 40 days
6
CAPEX ▪ Yearly CAPEX 1-2% over sales (mainly R&D), in line with previous years
1
Asset Rotation ▪ Hard currency countries: Divestment at or after COD (up to 24 months)
▪ Soft currency countries: Divestment at RTB
Development
Strategy
2
Project
Target Invested
▪ Average cost of € 15K / MW targeted for projects developed in Spain and Italy
Equity / MW for
▪ Average cost of BRL 80k(3) / MW targeted for projects in Brazil
Development
3
Target CoC on ▪ Brazil: Target return on equity invested for development of c. 4-6x CoC(3)(4)
Invested Capex ▪ Europe: Target return on equity invested for development of c. 6-8x CoC
(1) Market share adjusted by “Safe Harboring Shipments”. Source: ‘The Global PV Tracker Landscape 2020’ by Wood Mackenzie and “Global PV Tracker Market Report” –2020 by IHS Markit
36 (2) Prices to be reduced from 0.10 USD/MW to 0.08 USD/MW. Source: ‘The Global PV Tracker Landscape 2020’, developed byFull
WoodYear 2020Power & Renewables; (3) Includes development of pure greenfield projects and acquisition of early stage
Mackenzie
projects ; (4) Cash on CashCLOSING REMARKS: WORKING TOWARDS THE FUTURE
1 ✓ Impact of COVID-19 pandemic in Soltec Industrial in Q2 and Q4:
FY 2020
Impacted • Delays in projects: including the effects of price increases in modules
• Increases in expenses: supplies and transport, personnel, external services and insurance
2 +
✓ Growth of PV industry: Solar PV is expected to grow from 2% of total generation to 25% in 2040
Strong PV Global
✓ PV energy is the cheapest source of electricity
Outlook
✓ Trackers will represent 40% of total installations in 2025 (from 20% in 2020)
3 + ✓ Record figures of Backlog (€190 Mn and 1.9 GW) and Pipeline (€2,665 Mn and 24.3 GW) for Soltec Industrial
Growth
✓ Total Pipeline of Powertis 5.0 GW in 2020 and expected 10 GW in 2021 proposal
✓ New projects in Soltec Industrial in 2021 amount to 3,056 MW and €897 Mn. Asset rotation in Powertis for
High Visibility on
Business Plan 2021 expected in 1.0 GW.
✓ Financial strength: net cash position
✓ Entry into new markets: USA, Middle East
✓ New products: green hydrogen and storage; SolarFighter
37 Full Year 2020Q&A Full Year 2020
06
Appendix

           Full Year 2020
SOLTEC POWER HOLDINGS P&L
(€, 000) 2019 2020
Revenue 356,812 235,646
Changes in inventories of finished goods and work in progress 917 559
Other operating income 1,762 2,598
Works carried out by the Group for its assets 968 3,445
Supplies (260,679) (180,973)
Personnel expenses (32,309) (36,429)
Other operating expenses (49,750) (45,883)
Amortisation and depreciation (4,386) (3,712)
Income from the sale of fixed assets and others (204) (644)
Other profit/loss 2,318 (7,818)
EBIT 15,449 (17,575)
Adjusted EBITDA 20,373 (9,408)
Financial income 149 6,550
Finance costs (5,221) (6,722)
Changes in the fair value of financial instruments (5,394) 10,288
Net exchange rate differences (3,947) (3,272)
Loss of net monetary position (289) -
Other net finance revenue / expenses (387) -
Net financial profit (15,089) 6,845
Share of profit/(loss) investments valued using equity method - -39
Profit/(Loss) Before Tax 360 (10,769)
Income tax 980 5,842
Consolidated Net Profit/(Loss) 1,340 (4,928)
40 Full Year 2020BALANCE SHEET
ASSETS 31.12.20 31.12.19 SHAREHOLDERS' EQUITY AND LIABILITIES 31.12.20 31.12.19
NON-CURRENT ASSETS SHAREHOLDERS' EQUITY
Intangible assets 13,393 34,045 Capital and reserves
Share capital 22,847 15,060
Property, plant and equipment 8,486 7,259
Reserves 136,656 1,220
Right-of-use 16,464 9,088 Exchange rate differences (12,116) 363
Investments accounted for using the equity method 5,308 - Profit/loss attributed to the Parent Company (4,918) 1,338
Non-current financial assets 5,128 4,985 Shareholders' equity attributed to the Parent Company 142,469 17,981
Deferred tax assets 13,788 4,339 Non-controlling interest (8) 1
Total non-current assets 62,567 59,716 Total shareholders' equity 142,461 17,982
NON-CURRENT LIABILITIES
CURRENT ASSETS
Non-current financial liabilities 19,414 15,552
Non-current assets held for sale 18,583 -
Non-current provisions 2,367 181
Inventories 22,883 25,461 Deferred tax liabilities 1,595 8,073
Debtors and other current assets 65,139 117,644 Total non-current liabilities 23,376 23,806
Credits with public administrations 12,255 18,386 CURRENT LIABILITIES
Shot-term investments in group companies and associates 143 - Liabilities linked to non-current assets held for sale 4,646 -
Current financial assets 2,155 3,191 Current financial liabilities 96,988 100,340
Trade and other accounts payable 40,127 103,125
Other current assets 1,963 797
Debts with public administrations 1,721 5,283
Cash and cash equivalents 125,748 25,935 Current provisions 594
2,117
Total current assets 248,869 191,414 Total current liabilities 145,599 209,342
TOTAL ASSETS 311,436 251,130 TOTAL SHAREHOLDERS' EQUITY AND LIABILITIES 311,436 251,130
41 Full Year 2020CASH FLOW
CASH FLOW (€, 000) FY 2020 FY 2019
Profit/(loss) before tax (10,770) 360
Adjustments to the profit (6,353) 17,411
Change in net working capital (10,969) (6,655)
Other operating cash flow (6,017) (6,327)
Cash flows from operating activities (34,109) 4,789
Cash flows from investment activities (6,884) (10,427)
Free cash flows from financing activities 141,051 31,001
Effect of exchange rate variations (245) 572
Net increase/(decrease) of cash and cash equivalents 99,813 25,935
Cash and cash equivalents at the start of the Period 25,935 -
Cash and cash equivalents at the end of the Period 125,748 25,935
42 Full Year 2020POWERTIS- BACKLOG AND PIPELINE OF PROJECTS OVERVIEW
Project status categorization
1H20 9M20 FY20 ▪ Projects in a preliminary stage (expected probability of completion 80%):
1,331 MW 1,335 MW 717 MW o Land secured;
o Interconnection rights granted;
o PPA / Off-take agreement agreed; and
RTB RTB RTB o Expected asset rotation within 6-12 months
Construction Construction Construction ▪ Projects that have already started construction or are in a pre-construction phase
and notice to proceed has been given to the relevant EPC contractor
Operation Operation Operation
▪ Projects in operation. Plants that have already started generating energy
43 Full Year 2020SOLTEC INDUSTRIAL
Order Pipeline Categorization Criteria
BID Status BID Probability
Contract Signed 100%
MoU(3) (Existing Customer) 100%
MoU (New Customer) 90%
LOI(4) (Existing Customer) 80%
Contract under Negotiation (Existing Customer) 70%
LOI (New customer) 70%
Contract under Negotiation (New Customer) 60%
Shortlisted (2 contenders) 50%
Shortlisted (3 contenders) 33%
Shortlisted (4 contenders) 25%
Shortlisted (5 contenders) 20%
Offer (Existing Customer) 10%
Offer Updated to same client (Existing Customer) 10%
Offer (New Customer) 5%
Offer Updated to same client (New Customer) 5%
Offer Lost 0%
Offer Not Sent: Out of Market Price 0%
Offer Closed: Customer Discarded 0%
44 Full Year 2020THANK YOU Full Year 2020
You can also read