Following Gold - Bloomberg Professional ...
←
→
Page content transcription
If your browser does not render page correctly, please read the page content below
January 2021 Edition
Bloomberg Commodity
January 2021 Edition Index (BCOM)
Bloomberg Commodity Outlook 2021
Bloomberg Commodity Outlook
Following Gold
Gold, Commodities Foundation, Is Firming for Endurance in 2021
What to Expect in Crude Oil: 2020 May Define Range for Years
$2,000 Gold, Liquidity Should Keep Metals Ahead of Equities
Soybeans at $13 May Limit Agriculture Sector Going for the Gold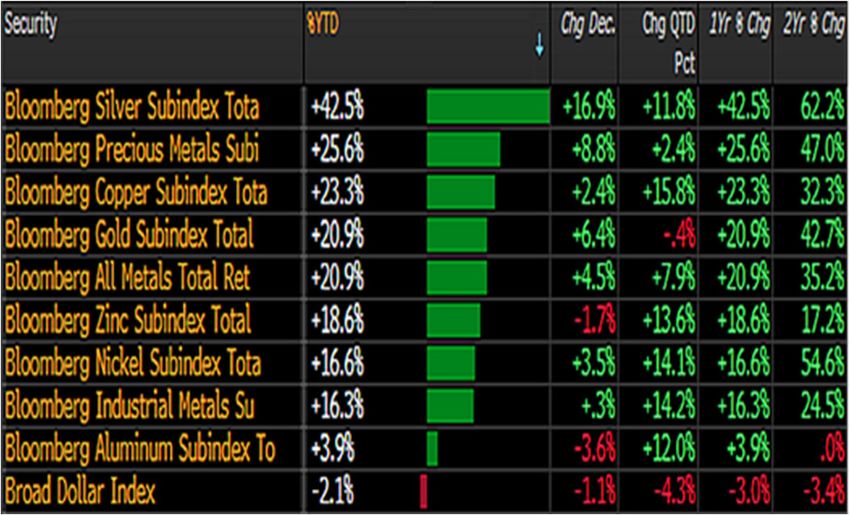
January 2021 Edition
Bloomberg Commodity Outlook 2021

 Contents
 03 Broad Market Outlook
 05 Energy
 08 Metals
 11 Agriculture

 Data
 14 Performance
January 2021 Edition
Bloomberg Commodity Outlook 2021

                                                                            Learn more about Bloomberg Indices
Data and outlook as of December 31, 2021
Mike McGlone – BI Senior Commodity Strategist
BI COMD (the commodity dashboard)
                                                                     Note ‐ Click on graphics to get to the Bloomberg terminal

Gold, Commodities Foundation, Is Firming for                      This Year's Commodities Take Cue From 2020 Gold.
Endurance in 2021                                                 Broad commodities have crossed the halfway threshold of
                                                                  the 2011-15 bear market, tilting prices toward further
Performance: December +5.0%, 2021 -3.1%, Spot +11.8%              appreciation, in our view. A bottom line for a recovering
(Returns are total return (TR) unless noted)                      commodity market is a peak dollar, but in a world of
                                                                  historically low and competing negative interest rates, we
(Bloomberg Intelligence) -- Led by gold, we expect broad          see advancing gold as a better proxy for currency weakness,
commodities to continue advancing in 2021 and view energy         and thus commodity strength. Our graphic depicts the
as the most vulnerable sector. It's a battle with the record-     Bloomberg Commodity Spot Index (BCOM) appearing well
setting stock market, yet a key 2020 driver -- liquidity --       poised to simply follow gold in 2021. Some commodity back-
appears enduring and is historically more supportive of the       and-fill, notably in elevated crude oil and copper prices,
metals. The gold advance of about 25% in 2020 was about           should be expected with a wobbly stock market, but the
the same as the broad U.S. money supply, and it beat the          foundation for the BCOM from 2020 appears firm.
S&P 500 total return by about 5%. We see more of the same
advancing metals prices in 2021, but copper, like the stock       The highly negative dollar-correlated metals sector is poised
market, is entering the new year at relatively elevated levels.   to be a bull-market leader as accelerating decarbonization
Agriculture is also at elevated reversion risk, with soybeans     efforts increase demand.
revisiting $13 a bushel for the first time since 2014

                                                                  MACRO PERFORMANCE
Broad Commodities Golden Trajectory
                                                                  Gold, Copper May Continue to Outperform Equities. A
Commodities May Have Performance Advantage vs.                    record-setting year for the S&P 500 that failed to outperform
Stocks in 2021. With rising metal prices appearing as the         gold may be a precursor for more enduring results for the
most sustainable among commodities, we see the sector             metal, in our view. Gold and copper atop the 2020
continuing to lead in 2021. Limited crude-oil upside that         macroperformance scorecard with gains near 25% vs. about
occurred before the pandemic is set to prevail, but the 2020      18% for the S&P 500 total return may see more of the same in
low should remain the bottom. Copper may be a bit too hot         2021. Increasing liquidity underpinnings support a
at the start of 2021, though appears poised to follow the         fundamentally sound gold bull market and, unlike equities,
2020 gold lead to new highs.                                      the metal had a correction of about 15% in 2H; it may have
                                                                  simply refreshed the gold rally. Copper and the S&P 500
Commodities Cross the Recovery Rubicon                            appear vulnerable to some similar back-and-fill.

                                                                  2021 Set for More 2020 Commodity Performance

                                                                  In 2021, we expect an outcome similar to the 2020 scorecard
                                                                  to prevail -- metals to lead performers with crude oil falling
                                                                  behind. If stock market volatility continues to rise, precious
                                                                  metals stand to be a primary beneficiary.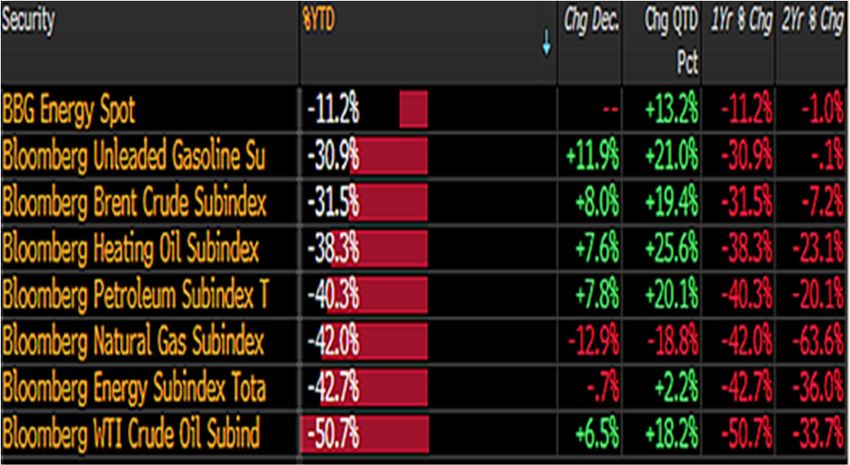
January 2021 Edition
Bloomberg Commodity Outlook 2021
                                                                 Curve Analysis – Contango (-) | Backwardation (+)

SECTOR PERFORMANCE

Metals Poised for More of the Same in 2021.
Underpinnings appear more sustainable for metals in 2021
than agriculture, in our view. Both are primary sectors
supported by a weak dollar, which we see best represented
by advancing gold, but the ability for grain supply to swiftly
recover in response to rising prices will act as more of an
agriculture price headwind, based on historical data. This
year should be a good test of the Corn Belt production
machine and, absent adverse weather, we expect the trend
in oversupply to prevail. Metals mining production is more
constrained by longer lead times and increasing focus on
ESG investing, which is putting constraints on supply.

Metals Bull Market vs. Energy Bea

The 2020 scorecard graphic, showing metals on the top and
energy on the bottom, is more likely to see some form of
mirroring in 2021, in our view.

                                                                 Measured via the one-year futures spread as a percent of the first contract price.
                                                                 Negative means the one-year out future is higher (contango). Positive means
                                                                 the one-year out future is lower (backwardation).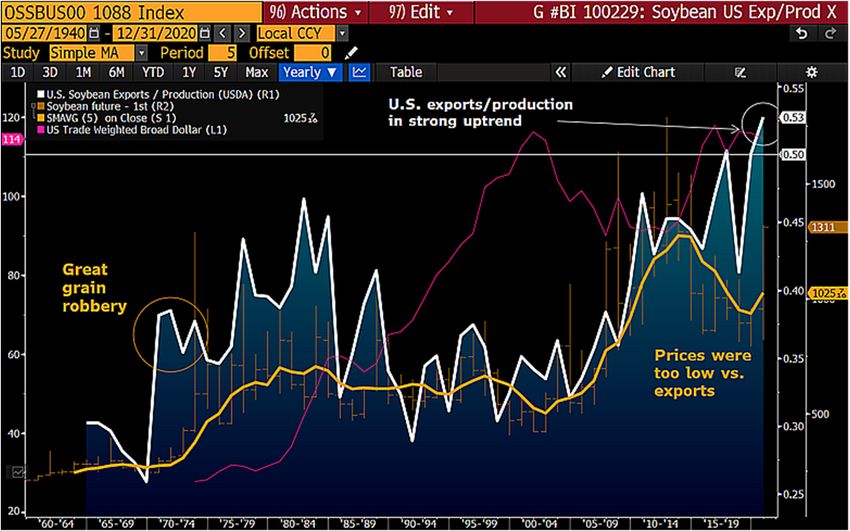
January 2021 Edition
Bloomberg Commodity Outlook 2021
                                                                   Unfriendly Trends for Crude-Oil Prices

Energy
(Index weight: 19% of BCOM)
Performance: December -0.7%, 2021 -42.7% , Spot -11.2%

Energy Settling Into a Bears Den

What to Expect in Crude Oil: 2020 May Define Range for
Years. The 2020 Brent crude-oil high around $70 a barrel
and low about $20 may cage prices for a long time, in our
view. Unlike macroeconomic partner copper, time decay is
unfavorable for fossil-fuel prices. Bearish pre-pandemic
conditions are unlikely to reverse, with demand elasticity
                                                                   The greater likelihood that rapidly advancing technology and
diminishing vs. the opposite dynamic in supply.
                                                                   demographic trends will simply stay the course should keep
                                                                   a lid on WTI prices. WTI crude near $50 at the start of 2021
Unfavorable Oil Demand vs. Supply Before 2020. Slack
                                                                   appears similarly vulnerable as just above $60 at the start of
crude-oil consumption vs. robust production trends in place
                                                                   2020.
before the pandemic are more likely to prevail, keeping
prices subdued for an extended period, in our view. Recent         Normal Backwardation Means Plenty of Oil Supply. The
downward revisions in demand-recovery estimates are                2020 Bloomberg Energy Spot Subindex decline of about 11%
consistent with diminishing use before 2020. Our graphic           vs. its total return closer to minus 43% emphasizes the
depicts consumption of world crude oil and liquid fuels            nuances of commodity investing that tilt performance favor
peaking in 2015 vs. the five-year moving average. It's             toward the metals, in our view. One-year crude-oil futures
significant that despite Brent's plunge to about $40 a barrel      curves are in backwardation, but rolling on a shorter-term
in 2015 from $110 in 2014, demand showed negative                  basis more often into contango can pressure total returns.
elasticity.                                                        Spot natural gas up almost 30% in 2020 is approaching
                                                                   good resistance at around $3 per million BTUs, which should
2020 Brent $20-$70 Range May Hold for Years
                                                                   limit further upside.
                                                                   2021 Energy May Have Limited Recovery Potential

With a global shift toward decarbonization, it's unlikely that
demand elasticity for fossil fuels will shift upward despite
                                                                   Backwardation is the condition when further out futures trade
2020's roughly one-third decrease in the average oil price.
                                                                   at lower prices. Typically it's a sign of demand, but
About $50 Brent on Dec. 22 appears at greater risk of
                                                                   backwardation in crude oil has become more synonymous
marking 2021's upper bound.
                                                                   with producer hedging. Energy is the most expensive sector
WTI Crude Oil Tilted Toward $40, Not $60. West Texas               to store, which often pressures total returns, notably vs. the
Intermediate crude oil at just under $50 a barrel near the end     cheapest-to-store metals.
of December is at greater risk of heading toward $40 and not
                                                                   A Friendly Trend: Copper Climbing vs. Crude. A pre-
sustaining above $60 in 2021, in our view. It took the
                                                                   pandemic trend in commodities with strengthening
pandemic and lower prices to suppress U.S. production, but
                                                                   underpinnings -- the price of copper advancing vs. crude oil -
returning to normal leaves us with a bear market. Our
                                                                   - is on a path we expect to continue. Our graphic depicts the
graphic depicts the predominant trend that has pressured
                                                                   ratio of LME-traded copper vs. Brent crude pulling back
global fossil fuel prices since the financial crisis: A reversal
                                                                   toward the end of 2020 from the high in our database since
from the U.S. consuming 10 million net barrels of fuel a day in
                                                                   1997. A top reason this trend should stay in place is U.S.
2009 vs. a surplus of 4 million barrels in 2020.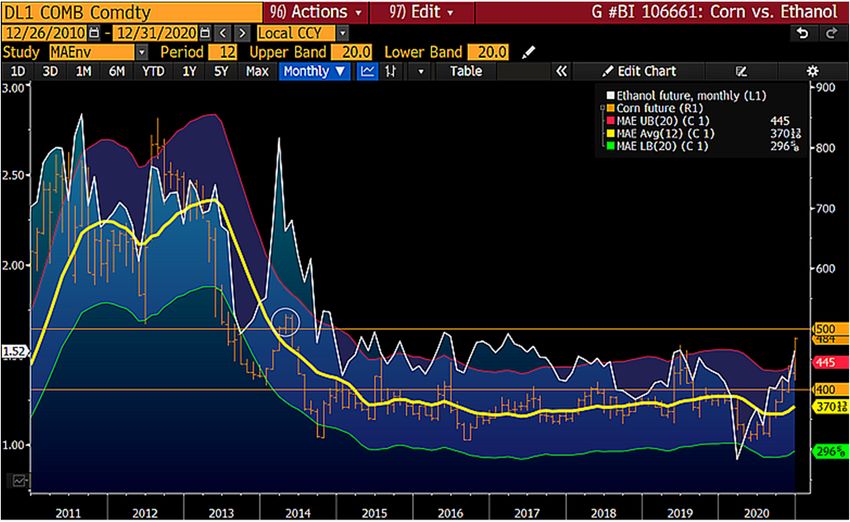
January 2021 Edition
Bloomberg Commodity Outlook 2021
                                                                  Gold/Crude Ratio Near Key `Prove It Wrong'
                                                                  LevelEnduring trends in increasing levels of negative
liquid-fuel production running well in excess of demand.
                                                                  yielding debt, quantitative easing and debt-to-GDP vs. the
Rapidly advancing technology is hitting both sides of fossil
                                                                  accelerating process of technology replacing fossil fuels
fuels -- reducing demand and increasing supply.
                                                                  support gold price appreciation vs. crude oil, in our view.
2020 Copper/Crude Leap Gaining Legs                               Fundamentals and technical indicators are favorable for
                                                                  more of the same since the financial crisis. Our graphic
                                                                  depicts the gold-to-Brent crude ratio dipping below its
                                                                  upward-sloping 50-week moving average for the first time in
                                                                  about two years. This macroeconomic-related spread of the
                                                                  world's most significant commodity and quasi-currency has
                                                                  returned to a key "prove the trend wrong" level.
                                                                  Friendly Trends Favor Higher Gold vs. Crude Oil

Copper demand is a primary beneficiary of greater
decarbonization and electrification efforts. In the unlikely
event that these trends subside, copper may underperform
crude, but we believe acceleration is more likely due to a
new U.S. president and an increasing global focus on ESG.
Following the Money Favors Copper, Not Oil. Increasing
inflows and price appreciation in clean-energy exchange-
traded funds vs. generally the opposite in ETFs tracking old-     The last time the gold-to-crude price ratio sustained a
guard energy companies may signal a paradigm shift of             meaningful downtrend was 2016-18 when the Federal
enduring tailwinds for the price of copper and headwinds for      Reserve was raising rates. A return to similar seems quite
crude oil. Our graphic depicts the copper-to-crude price          distant.
ratio appearing relatively low next to the ratio of the iShares
                                                                  Crude Oil: Bear, Bull or Lower Plateau? Brent crude oil
Global Clean Energy ETF (ICLN) to the Energy Select Sector
                                                                  approaching $50 a barrel at the start of December appears
SPDR Fund (XLE). Declining investment in fossil-fuel
                                                                  as vulnerable as it did near $70 in 2019, in our view. The
production has been noted by some as a reason for crude
                                                                  annual trend, as defined by the 50-week moving average,
prices to rise, but we see it as simply prudent amid the
                                                                  turned downward in 2018. Buyers above this level haven't
significant global push for decarbonization.
                                                                  fared well since. Our graphic depicts Brent peeking above its
Copper/Crude Appears too Low vs. Clean Energy                     annual mean and bumping into its most widely traded level
                                                                  and pivot since dropping from above $100 in 2014.
                                                                  Sustaining above $50 is necessary to initially indicate
                                                                  strength. Probabilities appear tilted toward mean reversion.
                                                                  $50 Brent Appears as Vulnerable as $70 in 2019

On pace to approach 15% in the next few years, corn-based
ethanol was a small percentage of total U.S. gasoline
consumption about a decade ago.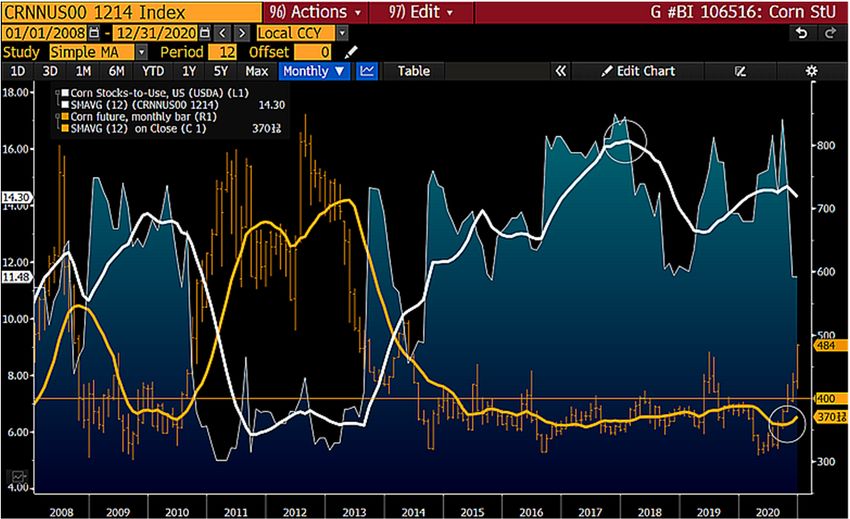
January 2021 Edition
Bloomberg Commodity Outlook 2021

                                                               Market Flows – Commitment of Traders
The 50-week average on December is about $43 vs. the front
future of $49. Brent was at similar levels in 2016 when it
began its recovery to the 2018 peak at about $86. That was a
bear market bounce. The bell curve of trading could be in a
$40-$50 range for the foreseeable future.

PERFORMANCE DRIVERS

Front Energy Futures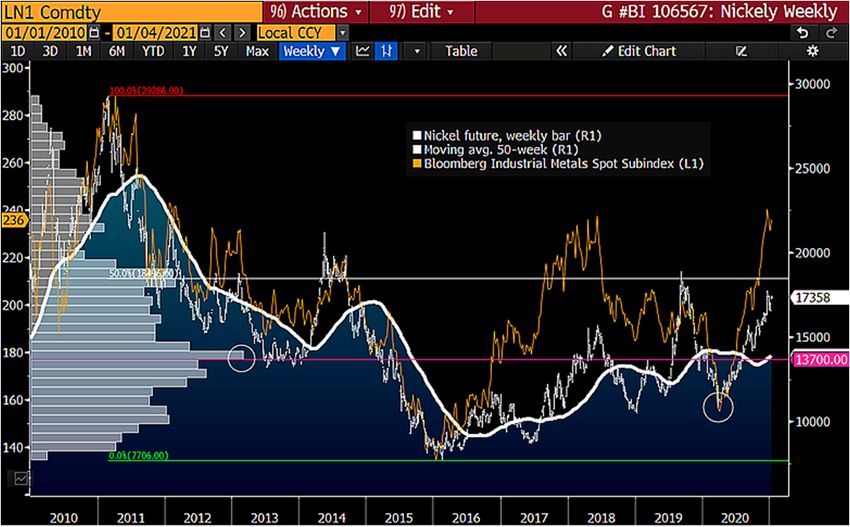
January 2021 Edition
Bloomberg Commodity Outlook 2021
                                                                 Not Beating Gold Means Underperforming. Gold may gain
                                                                 increasing reference as the performance benchmark to beat.
                                                                 In a year when the U.S. money supply increased about 25%,
                                                                 a similar advance in the price of gold was expected. Our
                                                                 graphic depicts the total returns of the S&P 500 and
Metals                                                           Bloomberg Barclays U.S. Treasury 20+ both falling short of
                                                                 spot gold in 2020 by about 5%, and we see little to reverse
All (Index weight: 40% of BCOM)
                                                                 the trend in 2021. If stock-market volatility keeps climbing
Performance: December +4.5%, 2021 +20.9%
                                                                 and past patterns repeat, gold stands to be a primary
Industrial (Index weight: 19.0% of BCOM.                         beneficiary.
Performance: December +0.3%, 2021 +16.3%, Spot +19.2%
                                                                 Gold May Continue Beating U.S. Stocks, Bonds
Precious (Index weight: 16.1% of BCOM.
Performance: December +8.8%, 2021 +25.6%, Spot +29.4%

Metals Set to Take 2021 Gold

$2,000 Gold, Liquidity Should Keep Metals Ahead of
Equities. Underpinnings for outperforming metals in 2020
appear sustainable in 2021, in our view. The unlikeliness of
reversing the unprecedented global fiscal and monetary
stimulus that helped boost gold and copper about 25% in
2020 -- vs. less than 20% for the S&P 500 -- should keep the
metals atop the leader board.
                                                                 In an investment landscape increasingly dominated by how
Metals' 2020 Upper Hand Appears Sustainable. Copper is
                                                                 low -- or negative -- central banks will set base rates, along
overdue for some back-and-fill, but the broad metals sector      with rising debt-to-GDP and QE, we see the foundation
is set to simply stay its bull-market course, in our view. In    solidifying under the price of gold. Resistance at about
2020, the Bloomberg All Metals Total Return Index gained
                                                                 $2,000 an ounce in 2020 is set to transition to support in
almost 21%, which beat the record-setting S&P 500 by about       2021.
3%. Massive liquidity has been a primary fuel source for
advancing asset prices, so the key question in 2021 is           Silver Well Placed to Continue Shining in 2021. Silver is
sustainability. Our bias is that the greater potential for       poised to keep outperforming in 2021 as it did in 2020, in
quantitative easing (QE) and debt-to-GDP levels to keep          our view. Often referred to as leveraged gold, silver's unique
rising should keep metals prices -- notably gold and silver --   attribute as being about half precious and half industrial
going up. The graphic shows the metals index crossing            should keep it a top beneficiary of a favorable
above the halfway threshold of the 2011-15 bear market.          macroeconomic backdrop. Fundamental and technical
                                                                 underpinnings are strong, on the back of the multiyear price
Metals Sector Set to Follow Rising Gold
                                                                 decline and rapidly advancing technology increasing
                                                                 demand for one of the best conductors of electricity. New
                                                                 highs for gold in 2020 should mean it's a matter of time for
                                                                 similar moves in silver and most other metals.
                                                                 Metals Set to Build on 2020 Foundation

A top shorter-term metals risk is a drop in the stock market,
but the potential for lower equities to result in more QE and
rising debt levels should favor the metals.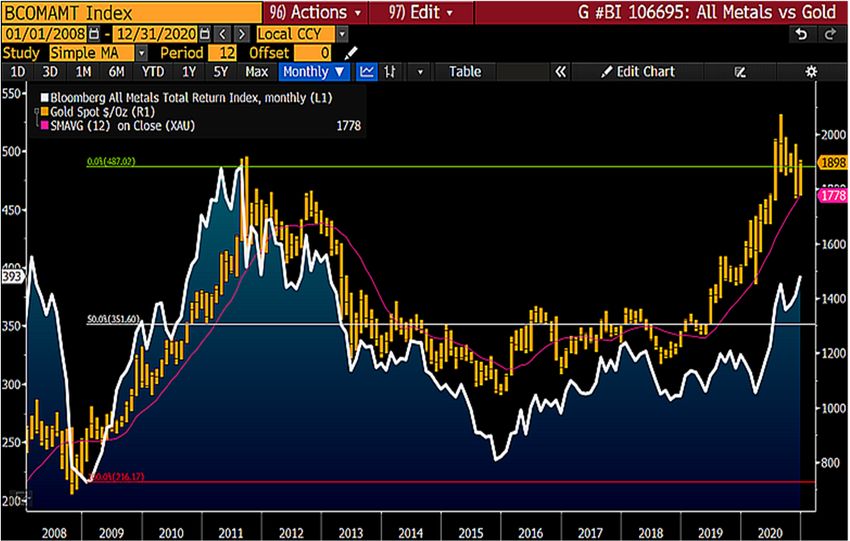
January 2021 Edition
Bloomberg Commodity Outlook 2021
Vaccine Optimism vs. Gold-Bull Realism
Mean-reversion risks in elevated copper and equity prices
may rhyme with 1Q20, which could instill some caution at the
onset of 2021. But the bigger picture for metals appears
more likely to build on the foundation of 2020.
Silver Underpinnings Stronger Than Post-2008. Annual
technical indicators for silver are akin to those during turns
higher at the start of the new millennium and following 2008.
We see the metal following a similar trajectory as the
aftermath of the financial crisis toward $50 an ounce, but
with greater potential for staying power on a path paved by
gold. Silver has breached $20 resistance that caged the
market since 2013 in a bullish outside-range, up-year pattern.
There's a good chance that the 2020 low at about $12 will be
as enduring as about $8.50 from 2008, which hasn't traded
since. The March risk-off swoon was the last time gold kissed its
annual mean and it proved to be good support. Conditions
Silver's Road to $50 May Be Paved by Gold are in place for more of the same in 2021, in our view.
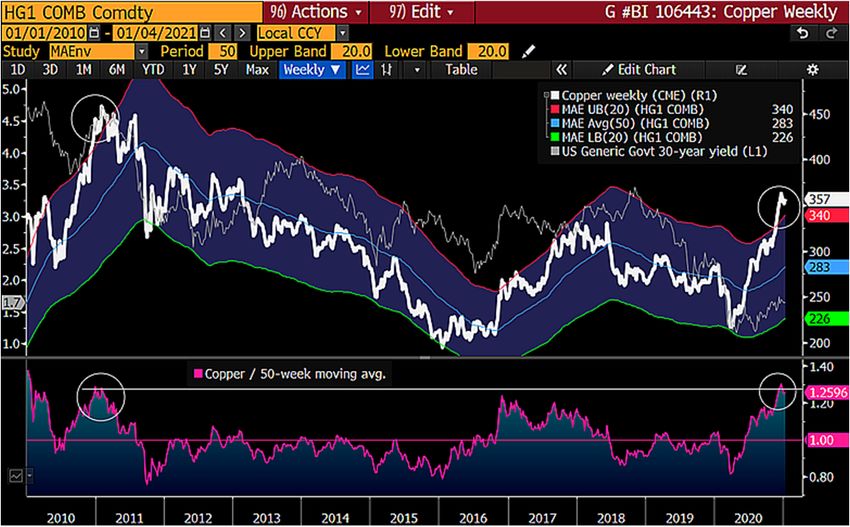
Is Copper Indicating It's Different this Time?
Copper prices may be showing a bit of irrational
macroeconomic exuberance at the start of December, if
previous trends repeat. Our graphic shows the metal
stretched about 30% above its 50-week moving average, the
most since the CME-traded copper future hit an all-time peak
of about $4.64 a pound in February 2011. A new bull market
appears to be brewing in the metal, but history indicates
mean-reversion risks are quite extreme. About the same as
nine years ago, the U.S. Treasury long bond topped out
about 4.7%, vs. closer to 1.7% on Dec. 4.
Copper and Too Much Post-Pandemic Optimism?
The 2008 launchpad peaked in 2011 with silver matching the
1980 high at about $50. Underpinnings are firmer this time,
as evidenced by the five-year moving average recently
turning upward. A risk-off event like 1Q should find good
silver support at around $20.
Gold Fundamentals and Technicals Tilted Favorably. Gold
appears too cold nearing the end of 2020, if previous
patterns surrounding quantitative easing and debt-to-GDP
are a guide. Our graphic depicts favorable fundamental and
technical underpinnings for the store-of-value. U.S. debt-to-
GDP has crossed the 130% threshold, a post-war high, while
G4 central-bank balance sheets as a percentage of GDP have
reached an all-time apex of about 54%. Unless an unlikely In May 2011, the S&P 500 peaked at about 1,360 before
scenario unfolds in which these measures sustain declines, it shedding about 20% to its October low. European debt
should be hard for gold to do anything but appreciate, issues and aftershocks from the financial crisis were
particularly when the metal is in close proximity to its predominant in 2011 and may be a guide for post-pandemic
upward-sloping 12-month moving average. optimism near the start of 2021.
A Bull Market in Little Hurry – Nickel. The nickel 50-week
moving average crossing above the most widely traded price
of the past 10 years -- $13,700 -- toward the end of 2020 is an
indication of a solidifying bull-market base for 2021. Our
graphic depicts an increasing potential that the 2020
correction was a final gasp of the bear market. Sustaining
above the halfway mark of the 2011-16 decline of about
$18,500 a ton would indicate taking the next step of a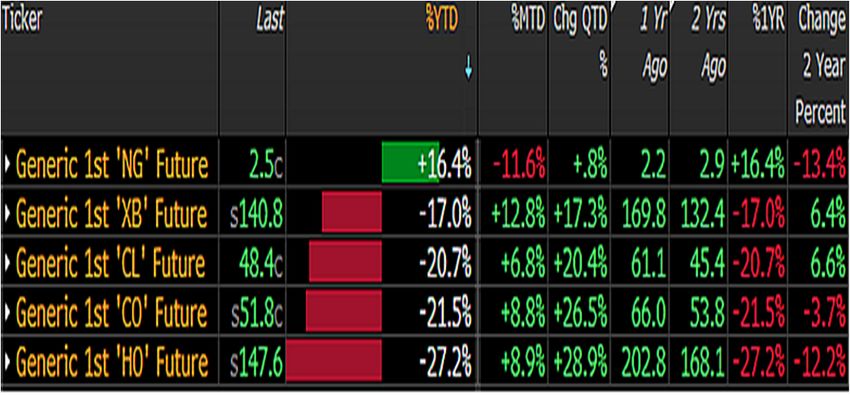
January 2021 Edition
Bloomberg Commodity Outlook 2021
                                                                Individual Commodities Front Future Change
recovery. Approaching the upper end of its range since 2012,
nickel is bumping into a good resistance zone from about
the Dec. 15 price of $17,700 to the halfway mark.
Nickel Set to Follow Industrial Metals Index

A risk-off volatility event such as 1H20 may revisit $14,000,
which is now key support. Sustaining below this level would
indicate recovery failure. The more likely case in 2021, we
believe, is an advance to the 2014 peak near $20,000.
January 2021 Edition
Bloomberg Commodity Outlook 2021
Soybeans are global and U.S. exports -- notably to China --
are a primary price tailwind, but as the graphic shows,
pullbacks following strong years are quite common.
Agriculture
New Corn Cage Is Likely $4-$5. The world's most
(Index weight: 35% of BCOM)
significant grain in terms of the dollar value of production --
Performance: December +10.4%, 2021 +16.5, Spot +23.6%
corn -- is likely turning what was $4-a-bushel resistance into
Grains (Index Weight: 24% of BCOM) support, but we see limited upside above $5, at least in the
Performance: December +11.9%, 2021 +19.3%, Spot +27.2% near term. Increasingly linked to energy, our graphic depicts
a primary headwind for the U.S. benchmark future, as
Softs (Weight: 6% of BCOM) ethanol futures appear in a more-prolonged slump amid a
Performance: December +6.1%, 2021 +2.9%, Spot +8.2% potential paradigm shift toward less driving and more
working from home.
Corn Problem - Declining Ethanol Demand
Agriculture Bull May Need Some Rest
Soybeans at $13 May Limit Agriculture Sector Going for
the Gold. Agriculture prices appear to have bottomed and
the dollar peaked in 2020, but risks may be tilted toward
some ag back-and-fill at the onset of 2021. Rising U.S.
exports are a primary tailwind for the grains, which dominate
the Bloomberg Agriculture Subindex. In a zero-interest-rate
world, ag prices may follow a path paved by gold.
Agriculture May Back-and-Fill Into 2021. The best year for
the Bloomberg Agriculture Spot Subindex in about a
decade, up almost 20% to Dec. 23, portends the end of the
bear market, but price headwinds are strengthening at the The need for producers to hedge suggest that corn's price
start of 2021, if previous patterns repeat. Comprising about around $4.50 at the end of 2020 -- the most extended above
40% of the subindex, soybeans, oil and meal dominate its 12-month moving average since the 2019 peak -- should
agriculture, and the benchmark future may indicate limited have limited further upside.
upside for the sector. Our graphic depicts the significance of
$13-a-bushel soybeans, about the halfway mark to the 2019 Rocking Soybeans May Share With Corn, Wheat. The best
trough from 2012's peak. At about $13.11 on Dec. 31, U.S. year since 2010 for the Bloomberg Grains Spot Subindex in
farmers may be the most profitable since 2012, while the 2020 is part of a nascent bull market, in our view, but higher
price is the most stretched above its 50-week mean since prices should encourage plenty of supply in 2021, limiting
January 2011. further upside potential. Unless growing conditions are
generally adverse, the largest-ever crop may be in the cards,
Bull Markets are Supposed to Get Over Heated notably as U.S. producers haven't had this much price
incentive in about seven years. Relatively elevated soybean
prices should attract planting acres, thus the 30% 2020 gain
in the Bloomberg Soybeans Subindex Total Return may give
way some to corn or wheat in 2021.
2020, The Best Year for Gains in a DecadeJanuary 2021 Edition
Bloomberg Commodity Outlook 2021
Low Prices May Have Planted Corn in a $4-$5 Range: BI
Overdue for a subpar weather year, potentially akin to 2012, Commodity. Corn, the world's most significant agriculture
2021 should be a good test of the great Corn Belt production commodity, is on path to recovery following an enduring
machine. Despite plenty of supply in Brazil and Argentina, period of moribund prices, in our view. Futures in
demand has been stronger, which -- along with a peak dollar backwardation reflect increasing demand, notably for U.S.
-- boosts prices. exports that appear to be offsetting a decline in ethanol use.
Biofuel production is likely to get a boost from the Biden
Soybeans Likely Ripen Toward $10-$13 Range in 2021: BI
administration as the Trump era of paying farmers to
Commodity. The enduring soybean bear market appears
produce and U.S.-China trade tensions may mark an
over, but we see prices limited at around $13-a-bushel
enduring price low. The price recovery should boost Corn
resistance in 2021 while the old ceiling of about $10 appears
Belt supply in 2021, which adds headwinds above $5 a
to be pivoting to support. U.S. exports breaching the 50%
bushel resistance, but $4 appears in transition to support.
threshold of production appears sustainable, notably if the
The trend in favorable weather patterns is historically
dollar declines. Peaking global stocks-to-use are akin to
extended.
2006. A late start to the 2021 Southern Hemisphere crop is
price supportive, especially during the typically price- Stocks-to-Use May Have Peaked, Supporting Corn. Corn
favorable period until the U.S. growing season starts in May. prices have greater potential to recover as U.S. stockpiles
Strong production in Brazil and Argentina -- and their appear to have peaked vs. production, in our view. The
weakening currencies -- are primary headwinds. graphic depicts what has been elevated stocks-to-use since
A rollover in crude oil or a recovery in the greenback are key about 2014 and the inverse relationship to prices. Around 11%
soybean price-recovery risks as China demand appears at the end of November compares with closer to 14% a year
enduring. ago. The stocks' 12-month average appears to be resuming
its downward track from the 16-year peak in 2018, which may
Soybeans Moving on From U.S.-China Export Blip. The
be an enduring high. Low prices may have finally cured the
rise in U.S. soybean exports as a percentage of production is
bear market.
a strong price tailwind. Market rebalancing appears to be in
force as production stabilizes, after unfavorable weather in Corn Price Tailwind - Peaking Stockpiles
2019 and lower prices. There's no precedent for the U.S.
exporting more than half its crop, yet that threshold has been
breached despite an elevated dollar. The divergence in
increasing exports and decreasing prices is the most extreme
since the 1980s. Back then, exports averaged about 39% of
production vs. 53% in 2020.
Low Prices, China Keeping U.S. Exports Strong
It's notable that the Corn Belt hasn't had a severely dry year
since 2012. Adverse weather typically affects production
about every seven years. The U.S is the world's largest
producer and exporter of corn.
Corn in Backwardation as Demand Tops Supply. The corn
future one-year curve at about 2% in backwardation on Dec.
9, vs. closer to 8% contango a year ago, indicates demand
Among most USDA-derived data, our calculation of the exceeding supply and an overall price recovery, based on
percentage of U.S. production that's exported (.EXUSSOY% normal trends. Our graphic, emphasizing 52-week moving
G Index ) tops the list of positive correlations to averages, shows the upward-trending futures curve
soybean prices at 0.50 (over the past 20 years, measured appearing to lead the same measure of the front corn price.
annually), about the same vs. corn. In 2010, the recovery was more simultaneous, which may
indicate catch-up room for spot futures. The backwardation
trend in corn is another indication that what was resistance at
around $4 a bushel in the front future is transitioning toward
support.January 2021 Edition
Bloomberg Commodity Outlook 2021
Index Performance (as of December 31)
Corn May Be Transitioning $4 Into Support
Backwardation is the condition when the price of the front
future exceeds the back. Expensive-to-store corn is typically
in contango, thus backwardation is a rare indication of
demand exceeding supply.PERFORMANCE: Bloomberg Commodity Indices
Composite Indices * Click hyperlinks to open in Bloomberg
2020
Index Name Ticker
Dec YTD 1-Year 3-Year 5-Year 10-Year 20-Year 30-Year 40-Year 50-Year
Bloomberg Commodity ER BCOM 4.97% -3.50% -3.50% -11.47% -0.64% -51.93% -31.90% -24.00% -43.93% 322.94%
Bloomberg Commodity TR BCOMTR 4.97% -3.12% -3.12% -7.41% 5.25% -48.93% -9.89% 62.31% 184.87% 4217.09%
Bloomberg Commodity Spot BCOMSP 5.21% 11.83% 11.83% 10.41% 46.24% -13.81% 198.56% 286.38% 209.65% 1854.13%
Bloomberg Roll Select BCOMRST 4.86% 1.44% 1.44% -4.95% 12.85% -39.47% 107.97%
1 Month Forward BCOMF1T 5.35% 0.72% 0.72% -2.70% 12.73% -40.84% 59.26%
2 Month Forward BCOMF2T 5.11% 2.32% 2.32% 1.65% 19.41% -38.57% 105.05%
3 Month Forward BCOMF3T 5.58% 3.48% 3.48% 1.73% 19.92% -35.76% 123.87%
4 Month Forward BCOMF4T 5.39% 5.29% 5.29% 3.14% 25.01% -30.15%
5 Month Forward BCOMF5T 5.47% 6.36% 6.36% 5.33% 27.86% -28.33%
6 Month Forward BCOMF6T 4.47% 5.97% 5.97% 4.99% 27.98% -27.73% 188.26%
Energy BCOMENTR -0.66% -42.72% -42.72% -44.10% -37.81% -81.52% -87.32% -59.44%
Petroleum BCOMPETR 7.78% -40.30% -40.30% -35.49% -17.15% -69.43% -33.70%
Agriculture BCOMAGTR 10.42% 16.48% 16.48% 5.70% -4.01% -43.86% -5.93% 1.61% 16.34% 1340.50%
Grains BCOMGRTR 11.86% 19.32% 19.32% 11.50% -6.92% -42.82% -18.26% -26.04% -29.33% 383.97%
Industrial Metals BCOMINTR 0.31% 16.33% 16.33% 0.21% 55.44% -30.26% 135.53%
Precious Metals BCOMPRTR 8.85% 25.60% 25.60% 40.27% 70.40% 8.25% 473.88% 391.34% 146.09%
All Metals BCOMAMT 4.51% 20.92% 20.92% 18.21% 65.17% -11.74% 291.11%
Softs BCOMSOTR 6.08% 2.91% 2.91% -16.58% -19.58% -63.82% -45.40% -29.81% 2.11% 2738.93%
Livestock BCOMLITR 2.10% -23.42% -23.42% -29.24% -28.97% -41.54% -65.06% -56.22%
Ex-Energy BCOMXETR 6.83% 15.17% 15.17% 8.72% 23.47% -28.37% 72.05%
Ex-Petroleum BCOMXPET 4.49% 6.82% 6.82% -2.21% 6.08% -46.47%
Ex-Natural Gas BCOMXNGT 6.98% 2.29% 2.29% 0.26% 18.48% -36.22%
Ex-Agriculture BCOMXAGT 2.47% -10.95% -10.95% -13.14% 8.04% -52.33%
Ex-Grains BCOMXGRT 3.52% -7.29% -7.29% -11.09% 7.38% -50.99%
Ex-Industrial Metals BCOMXIMT 6.11% -6.98% -6.98% -9.20% -3.82% -52.72%
Ex-Precious Metals BCOMXPMT 4.06% -9.25% -9.25% -15.88% -5.97% -57.00%
Ex-Softs BCOMXSOT 4.89% -3.59% -3.59% -6.79% 7.08% -48.00%
Ex-Livestock BCOMXLIT 5.13% -1.76% -1.76% -5.96% 7.48% -49.50%
Ex-Agriculture & Livestock BCOMXALT 2.50% -9.71% -9.71% -11.64% 11.58% -53.46%
Bloomberg Dollar Spot BBDXY -2.15% -5.45% -5.45% -3.38% -9.11% 14.84%
Bloomberg US Large Cap TR B500T 3.96% 21.61% 21.61% 53.22% 108.85% 277.58%
US Aggregate LBUSTRUU 0.14% 7.51% 7.51% 16.89% 24.23% 45.76% 157.02% 452.70% 1791.97%
US Treasury LUATTRUU -0.23% 8.00% 8.00% 16.40% 20.32% 38.85% 135.26% 404.07% 1533.62%
US Corporate LUACTRUU 0.44% 9.89% 9.89% 22.71% 38.56% 72.94% 226.77% 632.93% 2547.54%
US High Yield LF98TRUU 1.88% 7.11% 7.11% 19.90% 50.98% 93.04% 352.13% 1202.97%
Single Commodity Indices
2020
Index Name Ticker
Dec YTD 1-Year 3-Year 5-Year 10-Year 20-Year 30-Year 40-Year 50-Year
Natural Gas BCOMNGTR -12.88% -41.96% -41.96% -63.62% -74.45% -95.90% -99.92%
Low Sulfer Gas Oil BCOMGOT 7.64% -42.26% -42.26% -36.31% -1.31% -58.86% 28.53%
WTI Crude BCOMCLTR 6.51% -50.71% -50.71% -47.29% -40.68% -82.52% -64.78% -11.71%
Brent Crude BCOMCOT 8.04% -31.55% -31.55% -21.02% 13.13% -56.51% 69.98%
ULS Diesel BCOMHOTR 7.56% -38.25% -38.25% -35.15% -0.45% -59.17% -12.50% 53.91%
Unleaded Gasoline BCOMRBTR 11.90% -30.89% -30.89% -28.37% -21.63% -43.54% 50.43% 288.10%
Corn BCOMCNTR 13.62% 12.94% 12.94% 2.15% -18.95% -52.37% -72.03% -81.97% -82.95% -44.22%
Soybeans BCOMSYTR 11.70% 32.16% 32.16% 16.02% 22.40% 13.21% 329.18% 384.35% 349.50% 3784.40%
Wheat BCOMWHTR 9.50% 10.25% 10.25% 24.85% -17.06% -69.17% -78.98% -84.27% -87.08% -31.48%
Soybean Oil BCOMBOTR 13.57% 15.98% 15.98% 12.37% 12.11% -51.22% 39.27% -9.84% 10.83% 1477.76%
Soybean Meal BCOMSMT 9.50% 32.30% 32.30% 18.28% 33.01% 78.67% 872.19%
HRW Wheat BCOMKWT 10.34% 14.25% 14.25% 0.13% -36.33% -75.44% -68.59%
Copper BCOMHGTR 2.36% 23.32% 23.32% 4.18% 55.74% -29.53% 342.50% 592.70%
Alumnium BCOMALTR -3.65% 3.89% 3.89% -16.94% 19.56% -46.77% -28.42%
Zinc BCOMZSTR -1.74% 18.60% 18.60% -7.82% 88.27% 2.79% 88.36%
Nickel BCOMNITR 3.51% 16.64% 16.64% 29.28% 81.59% -39.61% 240.24%
Gold BCOMGCTR 6.42% 20.95% 20.95% 38.74% 68.61% 22.51% 495.75% 343.50% 188.74%
Silver BCOMSITR 16.91% 42.47% 42.47% 45.71% 75.73% -25.55% 355.45% 405.89% 18.30%
Sugar BCOMSBTR 6.76% 10.61% 10.61% -16.66% -23.61% -69.13% -35.58% 59.21% -81.75% 71.92%
Coffee BCOMKCTR 4.02% -9.49% -9.49% -25.36% -38.16% -78.97% -82.17% -82.16% -61.74%
Cotton BCOMCTTR 8.28% 9.99% 9.99% -4.63% 18.65% -28.23% -62.94% -51.26% 78.73% 1288.72%
Live Cattle BCOMLCTR 1.91% -17.92% -17.92% -14.80% -13.92% -18.64% -21.49% 20.23% 577.02% 2777.36%
Lean Hogs BCOMLHTR 2.49% -31.52% -31.52% -50.73% -50.84% -68.46% -91.16% -93.37%PERFORMANCE: Bloomberg Commodity Roll Select Indices
Composite Roll Select Indices * Click hyperlinks to open in Bloomberg
2020
Index Name Ticker
Dec YTD 1-Year 3-Year 5-Year 10-Year 20-Year 30-Year 40-Year 50-Year
BCOM Roll Select BCOMRST 4.86% 1.44% 1.44% -4.95% 12.85% -39.47% 107.97%
Roll Select Agriculture BCOMRAGT 9.44% 13.41% 13.41% 3.62% -2.11% -38.93% 61.38%
Roll Select Ex-Ags & Livestock BBURXALT 2.82% -2.65% -2.65% -7.30% 24.07% -41.83% 124.76%
Roll Select Grains BCOMRGRT 10.40% 16.50% 16.50% 9.50% -4.43% -39.33% 48.59%
Roll Select Softs BCOMRSOT 5.62% -1.29% -1.29% -21.61% -22.12% -59.96% -11.43%
Roll Select Livestock BCOMRLIT 2.06% -14.53% -14.53% -27.69% -35.21% -37.86% 7.96%
Roll Select Energy BCOMRENT 0.02% -29.04% -29.04% -33.51% -16.22% -68.82% -28.06%
Roll Select Ex-Energy BCOMRXET 6.43% 14.96% 14.96% 7.58% 23.44% -24.59% 179.60%
Roll Select Petroleum BCOMRPET 6.53% -27.29% -27.29% -22.26% 7.89% -52.15% 165.10%
Roll Select Industrial Metals BCOMRINT 0.48% 15.60% 15.60% -2.38% 52.62% -28.45% 234.72%
Roll Select Precious Metals BCOMRPRT 8.84% 26.65% 26.65% 41.59% 72.62% 10.15% 494.46%
Single Commodity Roll Select Indices
2020
Index Name Ticker
Dec YTD 1-Year 3-Year 5-Year 10-Year 20-Year 30-Year 40-Year 50-Year
Natural Gas RS BCOMRNGT -9.75% -29.94% -29.94% -59.00% -62.37% -91.05% -98.35%
Low Sulfer Gas Oil RS BCOMRGOT 6.42% -39.33% -39.33% -34.80% -4.44% -57.10% 53.75% 199.83%
WTI Crude RS BCOMRCLT 5.87% -20.46% -20.46% -14.41% 13.19% -54.50% 198.90%
Brent Crude RS BCOMRCOT 6.47% -28.78% -28.78% -20.53% 13.22% -49.19% 204.87%
ULS Diesel RS BCOMRHOT 6.94% -40.73% -40.73% -39.54% -11.79% -62.33% 52.02%
Unleaded Gasoline RS BCOMRRBT 8.62% -15.56% -15.56% -10.35% 23.34% -19.26% 247.70%
Corn RS BCOMRCNT 11.76% 9.11% 9.11% -1.02% -17.57% -51.74% -50.42%
Soybeans RS BCOMRSYT 10.98% 30.42% 30.42% 23.12% 39.46% 38.24% 537.02%
Wheat RS BCOMRWHT 6.76% 7.05% 7.05% 11.57% -26.61% -71.19% -39.41%
Soybean Oil RS BCOMRBOT 13.57% 13.78% 13.78% 9.31% 10.33% -47.97% 91.56%
Soybean Meal RS BCOMRSMT 8.82% 29.02% 29.02% 24.40% 43.57% 107.25% 1273.70%
HRW Wheat RS BCOMRKWT 9.82% 12.89% 12.89% -5.56% -37.33% -74.46% -31.91%
Copper RS BCOMRHGT 2.39% 22.61% 22.61% 3.05% 55.16% -28.30% 505.23%
Alumnium RS BCOMRALT -3.36% 2.17% 2.17% -22.13% 13.40% -45.16% 0.47%
Zinc RS BCOMRZST -1.40% 18.73% 18.73% -10.68% 83.33% 3.50% 177.13%
Nickel RS BCOMRNIT 3.63% 16.44% 16.44% 28.86% 81.82% -36.98% 437.43%
Gold RS BCOMRGCT 6.48% 22.36% 22.36% 40.62% 71.66% 24.80% 506.76%
Silver RS BCOMRSIT 16.68% 42.15% 42.15% 45.15% 75.43% -24.36% 395.66%
Sugar RS BCOMRSBT 6.23% 0.89% 0.89% -28.11% -31.31% -67.47% 21.57%
Coffee RS BCOMRKCT 4.02% -8.71% -8.71% -26.02% -38.15% -77.34% -72.93%
Cotton RS BCOMRCTT 7.36% 9.55% 9.55% -1.43% 23.04% -11.14% -44.93%
Live Cattle RS BCOMRLCT 2.85% -15.03% -15.03% -18.06% -20.11% -22.12% 31.49%
Lean Hogs RS BCOMRLHT 0.72% -10.92% -10.92% -41.04% -53.81% -58.20% -33.92%BCOM Constituent Weights
BCOM Index MEMB * Click hyperlinks to open in Bloomberg
Dec 2020
Dec 2020 Contrib Dec 31 2020 Nov 30 2020 2021 Target
Group Commodity Ticker Weight%
to Return % Weight % Weight % Weight
Change
Natural Gas NG -1.33 8.42 10.11 (1.69) 8.07%
Low Sulfer Gas Oil QS 0.12 1.61 1.56 0.06 2.64%
WTI Crude CL 0.36 5.61 5.50 0.11 8.14%
Energy Brent Crude CO 0.38 4.80 4.67 0.13 6.86%
ULS Diesel HO 0.10 1.39 1.35 0.04 2.08%
Gasoline XB 0.19 1.66 1.53 0.13 2.18%
Subtotal -0.17 23.49 24.72 (1.23) 29.97%
Corn C 0.82 6.62 6.13 0.49 5.59%
Soybeans S 0.77 7.06 6.62 0.44 5.82%
Wheat W 0.29 3.19 3.07 0.12 2.89%
Grains Soybean Oil BO 0.40 3.19 2.97 0.22 3.20%
Soybean Meal SM 0.38 4.23 4.05 0.18 3.60%
HRW Wheat KW 0.17 1.70 1.62 0.08 1.57%
Subtotal 2.83 26.00 24.46 1.54 22.65%
Copper HG 0.20 7.91 8.13 (0.22) 5.39%
Aluminum LA -0.17 4.26 4.63 (0.37) 4.21%
Industrial
Zinc LX -0.06 3.61 3.85 (0.24) 3.25%
Metals
Nickel LN 0.11 2.96 3.00 (0.04) 2.71%
Subtotal 0.08 18.74 19.61 (0.87) 15.56%
Gold GC 0.95 14.79 14.62 0.17 14.65%
Precious
Silver SI 0.75 4.89 4.40 0.49 4.35%
Metals
Subtotal 1.70 19.68 19.02 0.66 19.00%
Sugar SB 0.20 3.09 3.05 0.04 2.99%
Coffee KC 0.10 2.56 2.59 (0.03) 2.74%
Softs
Cotton CT 0.12 1.50 1.46 0.04 1.51%
Subtotal 0.43 7.16 7.10 0.06 7.23%
Live Cattle LC 0.06 3.30 3.40 (0.11) 3.85%
Livestock Lean Hogs LH 0.04 1.63 1.67 (0.04) 1.73%
Subtotal 0.10 4.92 5.07 (0.15) 5.57%
Total 4.97 100.00 100.00 100.00%The data included in these materials are for illustrative purposes only. The BLOOMBERG TERMINAL service and Bloomberg data products (the “Services”) are owned and distributed by Bloomberg Finance L.P. (“BFLP”) except (i) in Argentina, Australia and certain jurisdictions in the Pacific islands, Bermuda, China, India, Japan, Korea and New Zealand, where Bloomberg L.P. and its subsidiaries (“BLP”) distribute these products, and (ii) in Singapore and the jurisdictions serviced by Bloomberg’s Singapore office, where a subsidiary of BFLP distributes these products. BLP provides BFLP and its subsidiaries with global marketing and operational support and service. Certain features, functions, products and services are available only to sophisticated investors and only where permitted. BFLP, BLP and their affiliates do not guarantee the accuracy of prices or other information in the Services. Nothing in the Services shall constitute or be construed as an offering of financial instruments by BFLP, BLP or their affiliates, or as investment advice or recommendations by BFLP, BLP or their affiliates of an investment strategy or whether or not to “buy”, “sell” or “hold” an investment. Information available via the Services should not be considered as information sufficient upon which to base an investment decision. The following are trademarks and service marks of BFLP, a Delaware limited partnership, or its subsidiaries: BLOOMBERG, BLOOMBERG ANYWHERE, BLOOMBERG MARKETS, BLOOMBERG NEWS, BLOOMBERG PROFESSIONAL, BLOOMBERG TERMINAL and BLOOMBERG.COM. Absence of any trademark or service mark from this list does not waive Bloomberg’s intellectual property rights in that name, mark or logo. All rights reserved. © 2021 Bloomberg. Bloomberg Intelligence is a service provided by Bloomberg Finance L.P. and its affiliates. Bloomberg Intelligence shall not constitute, nor be construed as, investment advice or investment recommendations (i.e., recommendations as to whether or not to “buy”, “sell”, “hold”, or to enter or not to enter into any other transaction involving any specific interest) or a recommendation as to an investment or other strategy. No aspect of the Bloomberg Intelligence function is based on the consideration of a customer's individual circumstances. Bloomberg Intelligence should not be considered as information sufficient upon which to base an investment decision. You should determine on your own whether you agree with Bloomberg Intelligence. Bloomberg Intelligence Credit and Company research is offered only in certain jurisdictions. Bloomberg Intelligence should not be construed as tax or accounting advice or as a service designed to facilitate any Bloomberg Intelligence subscriber's compliance with its tax, accounting, or other legal obligations. Employees involved in Bloomberg Intelligence may hold positions in the securities analyzed or discussed on Bloomberg Intelligence.
You can also read