Hexatronic Group AB (publ) Year-End Report 2018
←
→
Page content transcription
If your browser does not render page correctly, please read the page content below
Hexatronic Group AB (publ)
Year-End Report 2018
(Full year 1 January – 31 December 2018

 The full year (1 January – 31 December 2018)
     •   Net sales amounted to MSEK 1,597.8 (1,299.4), which represents 23% (26%) growth during the full
         year.
     •   The operating result before interest, taxes, depreciation and amortisation (EBITDA) totalled MSEK
         138.2 (151.0), which corresponds to an EBITDA margin of 8.7% (11.6%).
     •   The operating result amounted to MSEK 92.5 (122.3).
     •   Net earnings totalled MSEK 59.3 (90.4).
     •   Earnings per share after dilution totalled SEK 1.62 (2.38).
     •   Cash flow from operating activities during the full year amounted to MSEK 15.6 (133.4)
     •   The board will propose a dividend of SEK 0.40 (0.40) per share for the financial year 2018 to the
         annual general meeting.

 The quarter (1 October – 31 December 2018)
     •   Net sales amounted to MSEK 443.2 (325.0), which represents 36% (7%) growth during the quarter.
     •   The operating result before interest, taxes, depreciation and amortisation (EBITDA) totalled MSEK
         31.0 (37.9), which corresponds to an EBITDA margin of 7.0 (11.7%).
     •   The operating result amounted to MSEK 17.4 (30.4).
     •   Net earnings totalled MSEK 6.3 (23.7).
     •   Earnings per share after dilution totalled SEK 0.17 (0.62).
     •   Cash flow from operating activities during the quarter amounted to MSEK 51.6 (56.0)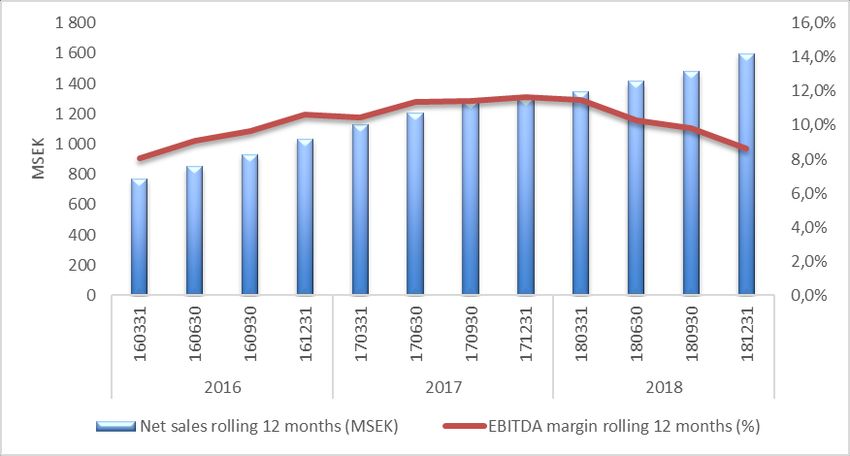
Comments from the CEO
Continued strong international growth
2018 was a year of continued strong growth for Hexatronic. The main item on our agenda was to increase
our presence the UK, Germany and USA. All these markets are in the early stages of developing fiber to the
home (FTTH). We made acquisitions in these markets during the year, which means we are continuing to
reposition Hexatronic strategically towards distinct emerging markets. On a pro forma basis, i.e. including
Opternus and PQMS, sales to the relatively well-developed Swedish market today account for about 35%
which is a gradual decrease from 49% in 2017 and 60% in 2016.

Overall, 2018 was a strategically successful year in which we advanced our positions on several emerging
markets. In terms of profitability, however, it was a poor year in which we did not achieve our EBITDA target
of 10%, mainly due to the biding Swedish FTTH market. In addition to the acquisitions in the UK, Germany
and USA, we also made important investments in sales and marketing on these markets, which had an
adverse impact on profitability for the full year.

Growth during the quarter totalled 36%, of which 34% related to acquisitions and 2% to organic growth.
There is still very strong growth outside of the Nordics, and weaker development primarily on the Swedish
market. In terms of financial results, the already seasonally weak quarter was burdened by agent costs of
MSEK 3.0 relating to the patent dispute in the UK. In the corresponding period last year, we had a positive
effect of MSEK 6.5 relating to the reimbursement of costs from our counterparty in the Swedish patent
dispute, which we won. We continued to see good development in the USA, and our operations in the UK
showed a strong upward trend. The recent acquisition in Germany has developed according to plan and has
also created awareness of Hexatronic on the German market.

Looking ahead to 2019, we believe that the global market will show healthy growth. The Swedish market will
be much the same as in 2018. We noticed a certain amount of price pressure on the Swedish market
towards the end of 2018, which we are responding to with streamlining and cost cutting. We believe the
British market will develop strongly and that we are well positioned to benefit from that growth. We are
building up stock in the UK due to the uncertainty surrounding Brexit. Also, the North American market is
expected to grow, and we believe we will take market share. The German market will grow from low
volumes. We do however believe that the major growth on the German market is a year or so off yet.

We enter the first quarter of 2019 with an order book which is organically 18% higher than at the same point
last year. We plan to continue making acquisitions intensively and are bolstering our resources so that we
can carry on growing on important emerging markets. The first quarter is normally our weakest quarter due
to the winter period. We believe that our comprehensive efforts in the UK, Germany and USA will have a
positive effect on both growth and profitability during 2019.

We still have a highly positive view of the FTTH market, the opportunities 5G will bring in the shape of fiber
expansion, and our potential for continued profitable growth moving forward.
Thank you for joining us on this journey.

Henrik Larsson Lyon
President and CEO of Hexatronic Group AB (publ)

                                                                                                                 2
Events during the quarter (October – December 2018))
• Hexatronic acquired the German fiber optic company Opternus GmbH. The company is consolidated
into the Hexatronic Group from November 1, 2018.
Events since the end of the period
No events to report since the end of the period.
Financial information, Group
Quarter Quarter Period Full year
181001 171001 180101 170101
MSEK 181231 171231 181231 171231
Net sales 443.2 325.0 1,597.8 1,299.4
EBITDA 31.0 37.9 138.2 151.0
EBITDA margin 7.0% 11.7% 8.7% 11.6%
Operating result 17.4 30.4 92.5 122.3
Net earnings 6.3 23.7 59.3 90.4
Earnings per share after dilution, SEK 0.17 0.62 1.62 2.38
Cash flow from operating activities 51.6 56.0 15.6 133.4
Liquid assets 84.6 108.2 84.6 108.2
See other key metrics on page 18.
Net sales and results
The full year (January – December 2018)
Net sales for the full year amounted to MSEK 1,597.8 (1,299.4). Net sales increased by 23% for the Group
compared to the year before. The growth in sales is attributable to the acquisitions of Blue Diamond
Industries, PQMS, Gordon Franks Training, Smart Awards and Opternus. Organically the net sales dropped by
6% compared to the year before because of a weaker Swedish market.
EBITDA totalled MSEK 138.2 (151.0), which corresponds to an EBITDA margin of 8.7% (11.6%).
Other operating expenses and operating income have been affected by adjustments of previously booked
debt raised for additional purchase amounts, which is shown in the outcome for the quarter below.
During the year, the Group has had significant agent costs for the ongoing patent dispute in the UK.
Net financial items for the full year amounted to -10.8 MSEK (-6.2), whereof net interest amounted to -6.9
MSEK (-1.8), unrealised foreign exchange differences to -1.6 MSEK (-4.4) and other financial items to -2.3
MSEK (0).
The quarter (October – December 2018)
Net sales during the quarter amounted to MSEK 443.2 (325.0). Net sales increased by 36% for the Group
compared to the same quarter last year. The growth is attributable to the acquisitions of Blue Diamond
3Industries, PQMS, Gordon Franks Training, Smart Awards and Opternus. The organic growth was 2%
compared to the same quarter last year.
EBITDA totalled MSEK 31.0 (37.9), which corresponds to an EBITDA margin of 7.0% (11.7%).
Other operating income during the quarter totalled MSEK 15.0 (17.1), of which MSEK 9.2 relates to
adjustment of a previously booked debt raised for additional purchase amounts linked to the acquisitions of
PQMS and Opternus, and MSEK 1.5 relates to insurance compensation for agent costs linked to the patent
dispute in the UK.
During the quarter, the Group has had significant agent costs for the ongoing patent dispute in the UK.
Other operating expenses during the quarter totalled MSEK 4.7 (0) linked to adjustment of a previously
booked debt raised for an additional purchase amount related to the acquisition of Blue Diamond Industries.
Net financial items during the quarter amounted to -3.7 KSEK (-2.4), whereof net interest amounted to -2.0
MSEK (-0.3), unrealised foreign exchange differences to -0.6 MSEK (-2.1) and other financial items to -1.1
MSEK (0).
Net sales 12 months, MSEK and EBITDA margin rolling 12 months (%)
Financial position and liquidity
Liquid assets
Liquid assets on 31 December 2018, excluding overdraft facilities, amounted to MSEK 84.6 (108.2).
Unutilised overdraft facilities amounted to MSEK 42.6 on 31 December 2018.
4Non-current assets
Non-current assets amounted to MSEK 594.7 on 31 December 2018 (212.8). The increase is primarily related
to acquired assets in connection with the acquisitions of Blue Diamond Industries, PQMS, Gordon Franks
Training, Smart Awards and Opternus.
Equity
Equity amounted to MSEK 494.4 on 31 December 2018 (415.3), which equated to SEK 13.54 per outstanding
share before dilution at the end of the reporting period.
Borrowing
The Parent Company has an acquisition facility of MSEK 565. The utilised amount on 31 December 2018
totalled MSEK 408.2, and MSEK 351.7 of this is long-term borrowing. The debt falls due for payment on 15
December 2021 with an option to extend. The Parent Company’s loan agreements include the usual
conditions, commitments and provisos.
Net debt totalled MSEK 353.4 at the end of the reporting period compared to MSEK 14.2 in net cash as per
31 December 2017.
Equity ratio
The equity ratio on 31 December 2018 was 38% (53%).
Cash flow
Cash flow from operating activities
Cash flow from operating activities during the full year amounted to MSEK 15.6 (133.4), including a change in
working capital of MSEK -83,2 (12.7). The negative change in working capital is primarily attributable to
increased capital tied up in inventories and accounts receivable.
Cash flow from operating activities during the quarter amounted to MSEK 51.6 (56.0), including a change in
working capital of MSEK 28.8 (30.3). The lower cash flow is attributable to increased capital tied up in
inventories.
Cash flow from investing activities
Cash flow from investing activities during the full year amounted to MSEK -361.5 (-45.8). The cash flow is
primarily attributable to the acquisition of Blue Diamond Industries, PQMS, Gordon Franks Training, Smart
Awards and Opternus and to some extent to investments in tangible and intangible assets.
Cash flow from investing activities during the quarter amounted to MSEK -96.7 (-9.6). The cash flow is
primarily attributable to the acquisition of Opternus and investments in tangible and intangible assets.
Cash flow from financing activities
Cash flow from financing activities during the full year amounted to MSEK 322.3 (-18.9). The cash flow from
financing activities during the full year is attributable to new borrowing related to the acquisition of Blue
Diamond Industries, PQMS, Gordon Franks Training, Smart Awards and Opternus, amortisation of loans and
dividend paid.
Cash flow from financing activities during the quarter amounted to MSEK 69.9 (0.1). The cash flow from
financing activities during the quarter is attributable to new borrowing related to the acquisition of Opternus
and amortisation of loans.
5Dividend policy
Any dividend is decided by the Annual General Meeting, following a recommendation by the Board of
Directors. The Group is currently in an expansive phase of development, and in the next few years the focus
will be on re-investing profits back into the business.
The Board will propose to the AGM a dividend of SEK 0.40 (0.40) per share for the 2018 financial year.
The Group’s financial goals up until 31 December 2018
Profitability
An EBITDA margin (EBITDA as a percentage of net sales) of at least 10% on a rolling 12-month basis. The
EBITDA margin on a rolling 12-month basis on 31 December 2018 was 8.7% (11.6%).
Growth
The Group shall grow more than its market organically. The Group strives for an average annual growth of at
least 20%. The growth will be both organic and acquisition-driven. Growth on a rolling 12-month basis was
23% (26%).
Financial stability
The Group shall have an equity ratio of at least 30%. The equity ratio was 38% at the end of the reporting
period.
In acquisitions, the equity ratio may fall below 30% for a period of less than 12 months. This may occur when
the Board deems that the profitability and cash flow from acquired companies will cause a swift
improvement in the equity ratio.
New Group financial goals from 1 January 2019
In light of the transition to the new reporting standard, IFRS 16 Leases, the Board of Directors has adopted
new financial goals to apply from 1 January 2019.
Profitability
The EBITA margin (Earnings before interest, taxes, and amortisation) should be at least 9% on a rolling 12-
month basis. The EBITA margin for year 2018 was 7.2%.
Growth
The Group shall grow more than its market organically. Annual growth of at least 20%. The growth will be
both organic and acquisition-driven.
Segments
Hexatronic Group AB (publ) is an engineering group specialising in fibre communications. The Group delivers
products and solutions for optical fibre networks and supplies a complete range of passive infrastructure for
telecom companies, including related training. Hexatronic Group AB (publ) comprises the operating segment
fibre optic communication solutions.
Customers
The Group’s customers are telecom operators, network owners, telecom companies, installers and system
houses, and a part of the Group’s products are distributed via wholesalers.
6Employees
There were 564 (384) employees in the Group on 31 December 2018. The increase in employees compared
to the same time last year is primarily due to the acquisition of Blue Diamond Industries, PQMS, Gordon
Franks Training and Opternus.
Parent Company
The Parent Company’s main business consists of performing Group-wide services. Revenue for the full year
January-December amounted to MSEK 27.2 (22.2) and the result for the period was MSEK -4.6 (8.8).
The Parent Company’s financial assets amounted to MSEK 630.2 at the end of the period (compared to MSEK
221.8 at the beginning of the year). The increase is related to the value of shares in the acquired companies
Blue Diamond Industries, PQMS, Gordon Franks Training, Smart Awards and Opternus. The value of shares in
ICT Education and Iftac has been written-down by MSEK 15.5 during the full year.
Transactions with related parties
The Group rents premises from Fastighets AB Balder, in which the Group’s board member Erik Selin has a
significant influence. The rental contract has been entered under normal commercial conditions. The rent for
the premises amounts to MSEK 4.6 annually.
Significant risks and uncertainties
Like all business activities, Hexatronic’s operation is associated with risks of various kinds. Continually
identifying and assessing risks is a natural and integral part of the operation, enabling risks to be controlled,
limited and managed proactively.
The Group’s ability to map and prevent risks minimises the likelihood of unpredictable events having an
adverse impact on the business. The aim of risk management is not necessarily to eliminate the risk, but
rather to safeguard set business goals with a balanced risk portfolio. Mapping, planning and management of
identifiable risks supports the management in making strategic decisions. Risk assessment also aims to
increase the entire organisation’s risk awareness.
Several risk areas have been identified in Hexatronic’s risk management process. Hexatronic has divided
identified risks into operational and environmental risks, market risks and financial risks.
A more detailed description of the Group’s risks and risk management is provided in the Hexatronic Group
Annual Report for 2016/17 on page 32-35.
Patent dispute
In June 2018 Emtelle UK Ltd. filed a lawsuit in England against Hexatronic UK Ltd., Hexatronic Cables &
Interconnect Systems AB and Hexatronic Group AB., for infringement in two British patents related to air-
blown fiber. Hexatronic has contested the claim.
7The Group – Hexatronic Group AB (publ)
The Group offers a broad product range designed for fibre optic communication solutions for telecom
companies, operators and network owners. It develops, designs, manufactures and sells its own products
and system solutions in combination with products from leading partners around the world. The Group
conducts its own business through established companies in Sweden, Norway, the UK, Germany, China, USA
and New Zealand.
The Group’s growth strategy is to grow organically by continuously developing its product range and
introducing more added value services such as servicing, aftermarket sales, support and training.
The Group has an explicit acquisition and growth strategy.
The market
Broadband expansion is in full swing all around the world. Some nations have come a long way, while several
major countries have barely begun.
At EU level, and in many individual countries, there are digitalisation goals that include a certain bandwidth
per household at a point in time. “The Digital Agenda for Europe” stipulates the goals up to 2025. The global
economy is changing quickly, and it is important to the competitiveness of individual countries and the
whole of the EU that the goals are accomplished.
There is still high activity on the global FTTH market worldwide, and especially on our focus markets of the
Nordics, Central Europe and North America. In an FTTH Council Europe report presented in February 2018,
relating to the percentile coverage of FTTH/FTTB by country, small countries such as the United Arab
Emirates, Singapore and South Korea are at the top of the rankings for the percentage of fiber households. In
Europe, Latvia is in the lead with 50.6% followed by Sweden with 43.4% and lagging far behind are major
nations like Germany and Italy with just 2.3% each, while the UK has under 1%.
In terms of size, the North American market is comparable to Europe, and expansion there is expected to be
strong in the next few years. During 2017, the number of ‘homes passed’ increased by 20% to 50 million
households in total, which indicates that the market is active.
On the Swedish market, it is primarily connection in rural areas that is yet to be completed. Since the
material requirement for rural connection is about 2.6 times higher for duct and cable than in built-up areas,
this means that the number of connections is falling, the need for materials is not decreasing at the same
rate.
85G is imminent – a technological shift that is required to provide sufficient support for new services and
connected products that need higher transfer speeds in the networks, such as driverless vehicles.
Video currently comprises around 50% of all traffic, and this is expected to rise to 75% by 2023. The
transition to 5G entails a dramatic condensation of senders/receivers, which has an effect on the fiber
networks as these are largely connected to fiber, and the need for fiber will increase.
The development of 5G is in its infancy and is expected to gather real momentum in two to three years’
time. The number of mobile users is expected to increase from around 8 billion to around 9 billion by 2023,
according to the Ericsson Mobility Report.
The development of Internet of Things (IoT) and smart cities has only just begun, and the market is expected
to grow dramatically in the years to come. Creative ideas and solutions are emerging, and new needs are
arising. The opportunities and potential applications are virtually endless.
The segments expected to grow the most in IoT are the ‘short range’ ones, i.e. products with a wireless
range of up to 100 m, often with a connection to WiFi, Bluetooth and Zigbee. The number of IoT products is
expected to grow by about 20% a year up to 2023, which would then result in 20 billion connected devices
worldwide – a clear indication of the dramatic growth that’s anticipated in this segment.
Outlook
The Group will continue to work with large customers and major projects, where the Group’s added value as
a competent systems and product supplier constitutes a competitive edge. The Group’s principal offering is
systems and products for broadband communication, primarily for fibre optic networks.
The Group has an active acquisition and growth strategy whereby attractive candidate – i.e., those that can
complement Hexatronic either in terms of market or products – are continuously being evaluated. The
Group does not prioritise acquisitions in which cost synergies need to be harnessed to achieve a good return
on the acquisition investment.
The Group does not publish forecasts.
The Hexatronic share
The company’s share is listed in the Mid cap segment on Nasdaq Stockholm.
The company’s share is listed under the ticker HTRO. On the balance sheet date, the share capital in
Hexatronic Group AB (publ) amounted to SEK 1,825,590.95, distributed among a total of 36,511,825 shares,
before dilution from existing employee stock option programmes.
At the Annual General Meeting (AGM) on 19 April 2018, it was decided to authorise the Board to acquire and
transfer personally held shares in line with the Board’s decision, and to decide on the new issue of shares
and/or warrants and/or convertibles equating to no more than 10% of the registered share capital. The AGM
decided to pay a dividend of SEK 0.40 per share, which was paid on 26 April 2018.
The fair value on the issued options, in all employee stock option programs, has been calculated according to
the Black & Scholes model. Each option entitles the holder to buy one share.
9Employee stock option programmes active at the time of this report’s publication are:
• In 2016/17 an employee stock option programme was approved with 700,000 options available to
the company’s personnel; 346,500 of these options were subscribed at an issue price of SEK 51.65,
with a redemption window of 15 January – 15 February 2020.
• In 2018 an employee stock option programme was approved with 1,000,000 options available to the
company’s personnel; 603,000 of these options were subscribed at an issue price of SEK 82.20, with
a redemption window of 15 May – 15 June 2021.
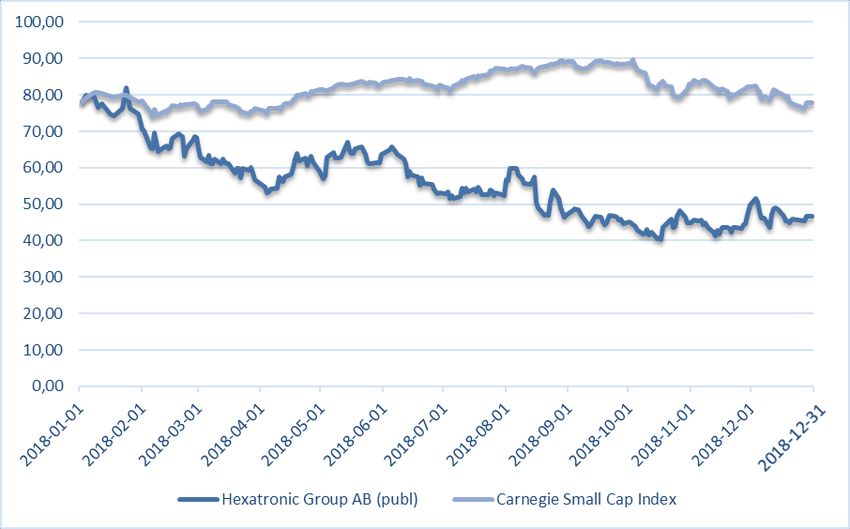
Share price development in the past 12 months (SEK)
The company’s market value at the end of the period was MSEK 1,705.
The number of shareholders at period end, 7,854, is based on data from Euroclear. The shareholder
structure of Hexatronic Group AB (publ) on 31 December 2018 is shown in the table below.
10Other information
Publication
This information comprises disclosures that Hexatronic Group AB (publ) must publish according to the EU
Market Abuse Regulation and the Swedish Securities Market Act. The information was submitted for
publication, under responsibility of the contact persons named below, on 22 February 2019 at 08:00 CET.
Financial calendar
Interim Report January-March 2019: 3 May 2019
Interim Report April-June 2019: 16 August 2019
Interim Report July-September 2019: 6 November 2019
Year-End Report: 21 February 2020
Annual General Meeting
The AGM will be held on 9 May 2019.
Please direct any questions to:
• Henrik Larsson Lyon, President and CEO, + 46 (0)70-650 34 00
• Lennart Sparud, CFO, + 46 (0)70-558 66 04
11The Board of Directors and President hereby confirm that this interim report provides a true and fair
overview of the business, financial position and results of the Parent Company and the Group and describes
significant risks and uncertainty factors with which the Parent Company and the companies forming the
Group are faced.
Gothenburg, 22 February 2019
Anders Persson Erik Selin
Chairman Board member
Jaakko Kivinen Malin Frenning
Board member Board member
Malin Persson Henrik Larsson Lyon
Board member President and CEO
This interim report has been reviewed by the company’s auditor.
Hexatronic Group AB (publ) is a group that develops, markets and delivers products, components and system solutions
with the main focus on the fiber optic market. Hexatronic offers a wide range of innovative system and product solutions
mainly for passive fiber optic infrastructure with global trademarks like Ribbonet®, Micronet™, Drytech™, Lightmate®,
FibreHub™, Matrix, Viper, Stingray and Wistom®. The Group has its headquarters in Gothenburg, Sweden and has sales
offices and/or subsidiaries in Sweden, Norway, Finland, United Kingdom, Germany, China, New Zealand and the US. The
Group is listed on Nasdaq Stockholm under the ticker HTRO. For more information, visit www.hexatronicgroup.com.
12Consolidated income statement (SEK thousand) Quarter Quarter Full year Full year
181001 171001 180101 170101
181231 171231 181231 171231
Revenue
Net sales 443,159 324,994 1,597,768 1,299,419
Other operating income 14,989 17,089 17,526 19,003
458,148 342,083 1,615,294 1,318,423
Operating expenses
Raw materials and goods for resale -264,517 -181,222 -906,639 -728,476
Other external costs -73,306 -52,123 -259,596 -176,801
Personnel costs -84,686 -70,803 -306,191 -259,950
Other operating expenses -4,653 0 -4,653 -2,191
Earnings before interest, taxes, depreciation and
30,985 37,934 138,214 151,004
amortisation (EBITDA)
Depreciation of tangible assets and amortisation of
intangible assets -13,624 -7,486 -45,669 -28,704
Operating result 17,362 30,448 92,545 122,300
Result from financial items
Financial income 2,219 152 194 230
Financial expenses -5,936 -2,568 -10,988 -6,399
Result after financial items 13,645 28,033 81,751 116,130
Income taxes -7,310 -4,346 -22,472 -25,699
Net result for the period 6,335 23,686 59,279 90,432
Attributable to:
Parent Company shareholders 6,335 23,686 59,279 90,432
Earnings per share
Earnings per share before dilution (SEK) 0.17 0.65 1.63 2.50
Earnings per share after dilution (SEK) 0.17 0.62 1.62 2.38
Consolidated statement of comprehensive income Quarter Quarter Full year Full year
181001 171001 180101 170101
181231 171231 181231 171231
Result for the period 6,335 23,686 59,279 90,432
Items which can later be recovered in the income statement
Translation differences 826 22 11,542 -2,687
Cash flow hedge 0 -3,077 3,077 -3,077
Other comprehensive income for the period 826 -3,055 14,619 -5,765
Comprehensive income for the period 7,160 20,631 73,898 84,667
Attributable to:
Parent Company shareholders 7,160 20,631 73,898 84,667
13Consolidated balance sheet (SEK thousand)
2018-12-31 2017-12-31
Assets
Non-current assets
Intangible assets 454,517 118,585
Tangible assets 139,197 93,933
Financial assets 1,015 312
Total non-current assets 594,729 212,830
Current assets
Inventories 334,282 236,925
Current receivables
Accounts receivable 261,774 204,062
Current tax receivables 1,594 0
Other receivables 2,553 1,649
Prepaid expenses and accrued income 23,582 13,394
Total current receivables 289,502 219,104
Liquid assets 84,621 108,239
Total current assets 708,405 564,268
Total assets 1,303,134 777,098
14Consolidated balance sheet (SEK thousand)
2018-12-31 2017-12-31
Equity
Equity attributable to Parent Company shareholders
Share capital 1,826 1,809
Other contributed capital 205,787 186,077
Reserves 5,905 -8,714
Result brought forward, including comprehensive
280,897 236,087
Income for the period
Equity 494,415 415,259
Non-current liabilities
Liabilities to credit institutions 351,741 70,530
Deferred tax 62,630 35,372
Total non-current liabilities 414,372 105,903
Current liabilities
Liabilities to credit institutions 56,457 23,510
Overdraft facilities 29,863 0
Accounts payable 173,772 140,886
Provisions 3,000 3,000
Current tax liabilities 0 11,779
Other liabilities 72,815 26,215
Accrued expenses and deferred income 58,440 50,546
Total current liabilities 394,347 255,936
Total equity, provisions and liabilities 1,303,134 777,098
15Result
brought
Consolidated statement of changes in equity Other capital forward,
Share capital Reserves Total equity
(SEK thousand) contributions including
result for the
period
Balance brought forward as of 1 January 2017 1,807 182,924 -158 145,774 330,347
Result for the period 0 0 -2,792 90,432 87,640
Other comprehensive income 0 0 -5,765 -118 -5,883
Total comprehensive income 0 0 -8,556 90,313 81,757
New share issue relating to business acquisitions 2 1,627 0 0 1,629
Employee stock option programme 0 1,526 0 0 1,526
Total transactions with shareholders, reported
directly in equity 2 3,153 0 0 3,155
Balance carried forward as of 31 December
1,809 186,077 -8,714 236,087 415,259
2017*
Balance brought forward as of 1 January 2018 1,809 186,077 -8,714 236,087 415,259
Result for the period 0 0 0 59,279 59,279
Other comprehensive income 0 0 14,619 0 14,619
Total comprehensive income 0 0 14,619 59,279 73,897
New share issue relating to business acquisitions 17 17,436 0 0 17,453
Employee stock option programme 0 2,274 0 0 2,274
Dividends paid 0 0 0 -14,469 -14,469
Total transactions with shareholders, reported
directly in equity 17 19,710 0 -14,469 5,258
Balance carried forward as of 31 December 2018 1,826 205,787 5,905 280,897 494,415
* Other capital contributions have been decreased and result brought forward including result for the period has been increased by
MSEK 4.751, compared to the last annual report regarding incorrect accounting of adjustment within the item Equity.
16Consolidated statement of cash flows (SEK thousand) Quarter Quarter Full year Full year
181001 171001 180101 170101
181231 171231 181231 171231
Operating result 17,362 30,448 92,545 122,300
Items not affecting cash flow 18,508 5,587 50,508 16,534
Interest received 101 152 194 164
Interest paid -5,274 -2,929 -10,403 -2,025
Income tax paid -7,875 -7,477 -34,094 -16,299
Cash flow from operating activities before changes in
22,822 25,780 98,749 120,674
working capital
Increase (-)/decrease (+) in inventories 12,103 -15,974 -67,247 -29,931
Increase (-)/decrease (+) in accounts receivable 70,670 66,936 1,378 -7,726
Increase (-)/decrease (+) in operating receivables -2,815 651 -4,627 8,369
Increase (+)/decrease (-) in accounts payable -36,584 -6,206 5,183 35,613
Increase (+)/decrease (-) in operating liabilities -14,611 -15,140 -17,872 6,360
Cash flow from changes in working capital 28,763 30,266 -83,186 12,684
Cash flow from operating activities 51,585 56,046 15,564 133,358
Investing activities
Acquisition of tangible and intangible assets -9,916 -6,628 -41,034 -33,087
Acquisition of subsidiaries after deduction of acquired
-86,794 -2,991 -320,478 -12,683
liquid assets
Cash flow from investing activities -96,710 -9,619 -361,512 -45,770
Financing activities
Borrowings 87,105 0 348,728 0
Amortisation of loans -21,726 0 -43,446 0
Changes in overdraft facilities 4,557 0 29,863 -20,277
New share issues for the period 0 101 1,654 1,340
Dividends paid 0 0 -14,469 0
Cash flow from financing activities 69,936 101 322,330 -18,937
Cash flow for the period 24,811 46,528 -23,618 68,651
Liquid assets at the start of the period 59,810 61,710 108,239 39,588
Liquid assets at the end of the period 84,621 108,239 84,621 108,239
17Key metrics for the Group Quarter Quarter Full year Full year
181001 171001 180101 170101
181231 171231 181231 171231
Growth in net sales 36% 7% 23% 26%
EBITDA margin 7.0% 11.7% 8.7% 11.6%
EBITDA margin, 12 months rolling 8.7% 11.6% 8.7% 11.6%
Operating margin 3.9% 9.4% 5.8% 9.4%
Equity ratio 37.9% 53.4% 37.9% 53.4%
Earnings per share before dilution (SEK) 0.17 0.65 1.63 2.50
Earnings per share after dilution (SEK) 0.17 0.62 1.62 2.38
Net sales per employee (SEK thousand) 801 844 3,090 3,456
Result per employee (SEK thousand) 11 62 115 241
Quick ratio 0.9 1.3 0.9 1.3
Average number of employees 553 385 517 376
Number of shares at period end before dilution 36,511,825 36,171,677 36,511,825 36,171,677
Average number of shares before dilution 36,438,900 36,171,677 36,278,940 36,148,508
Average number of shares after dilution 36,836,200 37,965,697 36,676,240 37,942,528
For the definition of key metrics, see the Annual Report for 2016/17.
The key metrics presented are deemed essential to describing the Group’s development as they both constitute the Group’s
financial objectives (growth in net sales, EBITDA margin, equity ratio) and are the key metrics by which the Group is governed.
Several key metrics are considered relevant to investors, such as earnings per share and the number of shares. Other key metrics
are presented in order to provide different perspectives on how the Group is developing and are therefore deemed to be of benefit
to the reader.
18Parent Company income statement (SEK thousand) Full year Full year
180101 170101
181231 171231
Revenue
Net sales 27,242 22,245
27,242 22,245
Operating expenses
Other external costs -28,163 -14,476
Personnel costs -20,119 -21,271
Earnings before interest, taxes, depreciation and
-21,039 -13,501
amortisation (EBITDA)
Depreciation of tangible assets -215 -225
Operating result -21,254 -13,726
Result from financial items
Interest income 1,134 1,538
Interest expenses -14,112 -2,443
Result after financial items -34,232 -14,630
Appropriations 29,550 25,510
Result before tax -4,682 10,880
Tax on profit for the period 90 -2,088
Net result for the period -4,591 8,792
19Parent Company balance sheet (SEK thousand)
2018-12-31 2017-12-31
Assets
Tangible assets 548 762
Financial assets 630,239 221,847
Total non-current assets 630,786 222,609
Current receivables
Receivables from Group companies 151,401 128,644
Current tax receivables 507 0
Other receivables 3,324 2,871
Prepaid expenses and accrued income 1,605 1,144
Total current receivables 156,837 132,659
Cash and bank balances 0 51,348
Total current assets 156,837 184,007
Total assets 787,623 406,616
Equity, provisions and liabilities
Equity 192,922 193,480
Untaxed reserves 6,330 6,330
Non-current liabilities
Liabilities to credit institutions 343,092 70,530
Total non-current liabilities 343,092 70,530
Current liabilities
Liabilities to credit institutions 56,457 23,510
Overdraft facilities 29,863 0
Accounts payable 6,504 2,488
Liabilities to Group companies 98,914 101,166
Current tax liabilities 0 1,050
Other liabilities 49,104 1,839
Accrued expenses and deferred income 4,437 6,222
Total current liabilities 245,279 136,276
Total equity, provisions and liabilities 787,623 406,616
20NOTES
Note 1 General information
Hexatronic Group AB (publ), with corporate identity number 556168-6360, is the Parent Company of the
Hexatronic Group. Hexatronic Group AB (publ) is based in Gothenburg at the address Sofierogatan 3A, SE-
412 51 Gothenburg, Sweden.
All amounts are in thousands of Swedish kronor (SEK thousand) unless otherwise stated. The figures in
parentheses refer to the previous year.
Note 2 Accounting policies
The consolidated financial statements for Hexatronic Group (“Hexatronic”) have been prepared in
accordance with International Financial Reporting Standards (IFRS) as adopted by the EU, RFR 1
Supplementary Accounting Rules for Groups and the Swedish Annual Accounts Act. This interim report has
been prepared in accordance with IAS 34 Interim Reporting, the Swedish Annual Accounts Act and RFR 1
Supplementary Accounting Rules for Groups.
The Parent Company’s financial statements have been prepared in accordance with the Swedish Annual
Accounts Act and the Swedish Financial Reporting Board’s recommendation RFR 2 Accounting for Legal
Entities. The application of RFR 2 means that in its interim report for the legal entity, the Parent Company
applies all IFRS and statements adopted by the EU as far as possible within the framework of the Swedish
Annual Accounts Act and the Swedish Insurance Act and regarding the relationship between accounting and
taxation.
For full accounting policies, see the Annual Report for 2016/17.
New standards applied from 1 January 2018
IFRS 9 Financial Instruments and IFRS 15 Revenue from Contracts with Customers are applied from 1 January
2018.
IFRS 9 Financial Instruments replaces IAS 39 Financial Instruments: Recognition and Measurement. IFRS 9
presents a new model for classification and measurement of financial instruments, a forward-looking
impairment model based on expected credit losses, and a reformed approach to hedge accounting. The new
standard also entails a change in the character of the Group’s disclosures relating to financial instruments.
The Group has deemed that the standard does not entail any material effects on the consolidated financial
statements, and the transition therefore involved no adjustment to the opening balance for 2018.
IFRS 15 establishes principles for reporting useful information to users of financial reports regarding the
nature, amount, timing and uncertainty of revenue and cash flows arising from a contract with a customer.
Revenue in the Hexatronic Group’s standard operation comprises the sale of goods and services. The
Group’s sales consist primarily of products, the sale of which is identified at a point in time. The sales that
have been identified over time partly comprise training, the extent of which in relation to the Group’s total
net sales is deemed to involve insignificant amounts and is therefore reported at a point in time, and partly
sales of submarine cables which are reported according to the percentage-of-completion method.
21Hexatronic Group meets the requirements that IFRS 15 places on revenue recognition about the sale of
goods. Since submarine cable contracts occur only to a limited extent, the new standard did not have a
significant effect on the Group’s accounting. Consequently, the opening balances for 2018 have not been
recalculated.
Estimated effects from transition to IFRS 16 Leases
Hexatronic has assessed the impact of the transition to the new standard IFRS 16 Leases effective 1 January
2019. Hexatronic´s initial estimate is that IFRS 16, during 2019, will have small positive impact on operating
profit and a negative impact on profit after financial items. The estimated effects on the balance sheet are
presented in the table below. The lease portfolio covers mainly operational office leases. Leases are
reclassified to IFRS 16 to the amounts recognized immediately before the date of application of the new
standard.
Hexatronic has assessed many contracts concerning premises being open-ended contracts. This requires the
Hexatronic lessee to determine the contract period instead of considering the termination clause. The lessee
then determines the length of the contract period based on factors such as the importance of building to the
business, any planned or made leasehold investments and the market situation for premises. Consequently,
these contracts have in many cases had the contract period extended.
Hexatronic has chosen to perform the transition in line with the Cumulative catch-up approach and has
applied the expedient to not restate any comparative information. Right-of-use assets have been
determined as an amount equal to the lease liabilities as identified at initial application. A marginal rate of
interest equal to the parent company´s borrowing interest rate has been applied. Lease contracts shorter
than 12 months or ending within 12 months at the date of application are considered short-term and hence
not recognized as lease liability or right-of-use asset. Low value contracts, with a value as new below SEK 50
thousand, are also excluded from being recognized as lease liability or right-of-use asset.
Closing
balance 31 Estimated
Dec 2018 Estimated adjustments Estimated
before reclassifications due to adjusted
transition to due to transitions opening
IFRS 16 transition to to IFRS 16 balance 1
MSEK Leases IFRS 16 Leases Leases Jan 2019
Right-of-use assets premises - - 180,685 180,685
Lease liabilities, interest bearing - - 180,685 180,685
22Note 3 Revenue
January to December 2018
Rest of North Rest of the
Geographical markets Sweden Europe America world Total
Revenue from external customers 606,701 287,637 365,625 337,805 1,597,768
Category
Goods 577,281 245,678 365,625 337,805 1,526,389
Services 29,420 41,959 0 0 71,379
Total 606,701 287,637 365,625 337,805 1,597,768
Time for revenue recognition
At a given time 606,701 287,637 365,625 337,805 1,597,768
Over time 0 0 0 0 0
Total 606,701 287,637 365,625 337,805 1,597,768
January to December 2017
Rest of North Rest of the
Geographical markets Sweden Europe America world Total
Revenue from external customers 788,891 227,488 16,757 266,283 1,299,419
Category
Goods 743,403 227,488 16,757 266,283 1,253,931
Services 45,488 0 0 0 45,488
Total 788,891 227,488 16,757 266,283 1,299,419
Time for revenue recognition
At a given time 788,891 227,488 16,757 266,283 1,299,419
Over time 0 0 0 0 0
Total 788,891 227,488 16,757 266,283 1,299,419
Note 4 Pledged assets
Group Parent Company
Pledged assets 181231 171231 181231 171231
Assets pledged for liabilities to credit institutions
Chattel mortgages 157,350 57,166 100 100
Shares in subsidiaries 281,484 338,190 82,504 134,258
Total 438,834 395,356 82,604 134,358
23Note 5 Business acquisitions
Business acquisitions 2018
Blue Diamond Industries LLC
On 2 January 2018, the Group acquired 100% of the share capital in Blue Diamond Industries LLC for MUSD
26.8. There may be a possible additional purchase price of a maximum of MUSD 2.5 based on the EBITDA of
the forthcoming two financial years.
The table below summarises the purchase price paid for Blue Diamond Industries and the fair value of
acquired assets and assumed liabilities recognised on the acquisition date.
Purchase price as of 2 January 2018
Liquid assets 222,898
Contingent purchase consideration (not paid) 16,450
Total purchase price 239,348
Recognised amounts for identifiable acquired assets and taken-over liabilities
Liquid assets 4,601
Tangible assets 23,932
Customer contracts and customer relations 71,066
Inventories 21,397
Accounts receivable 30,432
Other receivables 512
Accounts payable -15,035
Other payables -2,668
Total identifiable net assets 134,237
Goodwill 105,111
Acquisition-related costs of SEK 2,900 thousand are included in other external costs in the consolidated
statement of comprehensive income for the 2018 financial year. Total cash flow, excluding acquisition
related costs, attributable to the business acquisition amounted to SEK -218,296 thousand. Goodwill is
attributable partly to the added earning capacity the company is expected to bring, and partly to the
anticipated synergistic effects of merging the Group’s operations with those of Blue Diamond Industries.
Under the terms of the conditional purchase price, the Group will pay a maximum of SEK 20,750 thousand,
up to a maximum of SEK 11,676 thousand based on EBITDA in the period 2 January 2018 – 31 December
2018, and a maximum of SEK 9,081 thousand based on EBITDA in the period 1 January 2019 – 31 December
2019.
The fair value of the conditional purchase price of SEK 16,450 thousand was estimated by applying the
return of value approach. The fair value estimates are based on a discount rate, which is based on a two-year
government bond of approximately 0.2%, and an assumed EBITDA in Blue Diamond Industries. The fair value
of accounts receivable totals SEK 30,432 thousand. No accounts receivable is deemed to be doubtful.
24Blue Diamond Industries net sales have been included in the consolidated income statement since 2 January
2018 and amount to SEK 301,956 thousand. Blue Diamond Industries also generated a net profit of SEK
21,138 thousand in the same period on group level.
Professional Quality Management Services Ltd. (“PQMS”)
On 8 June 2018, the Group acquired 100% of the share capital in PQMQ for MGBP 1.5. There may be a
possible additional purchase consideration of a maximum of MGBP 1.95 based on the EBITDA of the
forthcoming three financial years.
The table below summarises the purchase price paid for PQMS and the fair value of acquired assets and
assumed liabilities recognised on the acquisition date.
Purchase price as of 8 June 2018
Liquid assets 11,376
Equity instruments (91,029 shares, based on the share price per acquisition date) 5,279
Contingent purchase consideration (not paid) 10,357
Total purchase price 27,012
Recognised amounts for identifiable acquired assets and taken-over liabilities
Liquid assets 755
Tangible assets 2,684
Customer contracts and customer relations 13,078
Trademarks 3,799
Accounts receivable 9,051
Other receivables 4,915
Trade creditors -3,253
Other liabilities -10,818
Total identifiable net assets 20,221
Goodwill 6,753
Acquisition-related costs of SEK 1,324 thousand are included in other external costs in the consolidated
statement of comprehensive income for the 2018 financial year. Total cash flow, excluding acquisition
related costs, attributable to the business acquisition amounted to SEK -10,620 thousand. Goodwill is
attributable to the added earning capacity the company is expected to bring.
Under the terms of the conditional purchase price, the Group will pay a maximum of SEK 22,877 thousand,
up to a maximum of SEK 7,919 thousand based on EBITDA in the period 1 May 2018 – 30 April 2019, a
maximum of SEK 7,919 thousand based on EBITDA in the period 1 May 2019 – 30 April 2020, and a maximum
of SEK 7,039 thousand based on EBITDA in the period 1 May 2020 – 30 April 2021.
The fair value of the conditional purchase price of SEK 10,357 thousand was estimated by applying the
return of value approach. The fair value estimates are based on a discount rate, which is based on a two-year
government bond of approximately 0.2%, and an assumed EBITDA in PQMS. The fair value of accounts
receivable totals SEK 9,051 thousand. No accounts receivable is deemed to be doubtful.
25PQMS net sales have been included in the consolidated income statement since 8 June 2018 and amount to
SEK 35,535 thousand. PQMS also generated a net profit of SEK -184 thousand in the same period on group
level.
Had PQMS been consolidated from 1 January 2018, the consolidated income statement for the period 1
January 2018 to 31 December 2018 would have shown increased net sales amounting to SEK 56,348
thousand and a net profit of SEK 1,902 thousand.
Gordon Franks Training Ltd. (GFT)
As part of the acquisition of PQMS, on 8 June 2018 the Group acquired 100% of the share capital in GFT for
MGBP 0.1. There may be a possible additional purchase price of a maximum of MGBP 0.13 based on the
EBITDA of the forthcoming three financial years.
Smart Awards Ltd. (SAL)
As part of the acquisition of PQMS, on 8 June 2018 the Group acquired 100% of the share capital in SAL for
MGBP 0.4. There may be a possible additional purchase price of a maximum of MGBP 0.52 based on the
EBITDA of the forthcoming three financial years.
Opternus GmbH (“Opternus”)
On 1 November 2018, the Group acquired 100% of the share capital in Opternus GmbH for EUR 10,000
thousand. There may be a possible additional purchase consideration of a maximum of EUR 2,500 thousand
based on the EBITDA of the forthcoming three financial years.
The table below summarises the purchase price paid for Opternus and the fair value of acquired assets and
assumed liabilities recognised on the acquisition date.
Purchase price as of 1 November 2018
Liquid assets 94,020
Equity instruments (218,776 shares, based on the share price per acquisition date) 10,414
Contingent purchase consideration (not paid) 22,507
Total purchase price 126,941
Recognised amounts for identifiable acquired assets and taken-over liabilities
Liquid assets 7,259
Tangible assets 2,407
Other intangible assets 451
Customer contracts and customer relations 19,036
Trademarks 43,327
Accounts recievable 19,487
Inventories 8,712
Other receivables 1,760
Accounts payable -9,460
Other payables -34,001
Total identifiable net assets 58,978
Goodwill 67,963
26Acquisition-related costs of SEK 1,811 thousand are included in other external costs in the consolidated
statement of comprehensive income for the 2018 financial year. Total cash flow, excluding acquisition
related costs, attributable to the business acquisition amounted to SEK -86,761 thousand. Goodwill is
attributable to the added earning capacity the company is expected to bring.
Under the terms of the conditional purchase price, the Group will pay a maximum of SEK 26,025 thousand,
up to a maximum of SEK 11,061 thousand based on EBITDA in the period 1 October 2018 – 31 December
2019, a maximum of SEK 8,849 thousand based on EBITDA in the period 1 January 2020 – 31 December
2020, and a maximum of SEK 6,116 thousand based on EBITDA in the period 1 January 2021 – 30 September
2021.
The fair value of the conditional purchase price of SEK 22,507 thousand was estimated by applying the
return of value approach. The fair value estimates are based on a discount rate, which is based on a two-year
government bond of approximately 0.2%, and an assumed EBITDA in Opternus. The fair value of accounts
receivable totals SEK 19,487 thousand. No accounts receivable is deemed to be doubtful.
Opternus net sales have been included in the consolidated income statement since 1 November 2018 and
amount to SEK 28,221 thousand. Opternus also generated a net profit of SEK 1,383 thousand in the same
period on group level.
Had Opternus been consolidated from 1 January 2018, the consolidated income statement for the period 1
January 2018 to 31 December 2018 would have shown increased net sales amounting to SEK 163,346
thousand and a net profit of SEK 8,675 thousand.
27RECONCILIATION BETWEEN IFRS AND KEY METRICS USED
In this interim report, Hexatronic presents certain financial parameters that are not defined in IFRS, known
as alternative key metrics. The Group believes that these parameters provide valuable supplementary
information for investors, as they facilitate an evaluation of the company’s results and position. Since not all
companies calculate financial parameters in the same way, these metrics are not always comparable with
those used by other companies. Investors should see the financial parameters as a complement to, rather
than a replacement for, financial reporting in accordance with IFRS.
Organic growth
SEK thousand, % October-December January-December
Net sales 2018 443,159 1,597,768
Acquisition driven -111,230 -371,076
Comparable net sales 331,929 1,226,692
Net sales 2017 324,994 1,299,419
Net sales increase 118,165 298,349
% 36% 23%
Organic growth 6,935 -72,727
% 2% -6%
Organic growth is calculated as net sales for the year adjusted by acquisitions in relation to net
sales for the previous year adjusted by acquisitions.
Annual growth, rolling 12 months
% 12 months
Net sales January-December 2018 1,597,768
Net sales January-December 2017 1,299,419
Annual growth, rolling 12 months 23%
Average annual growth is calculated as the Group´s total net sales during the period
compared to the same period the year before.
Equity ratio
% 2018-12-31 2017-12-31
Equity 494,415 415,259
Balance sheet total 1,303,134 777,098
Equity ratio 38% 53%
Equity ratio is calculated as equity as a percentage of balance sheet total.
28Quick asset ratio
% 2018-12-31 2017-12-31
Current assets 708,405 564,268
Inventories -334,282 -236,925
Current assets-inventories 374,123 327,343
Current liabilities 394,347 255,936
Quick asset ratio 95% 128%
Quick asset ratio is calculated as current assets minus inventories divided by current
liabilities.
Core working capital
SEK thousand 2018-12-31 2017-12-31
Inventories 334,282 236,925
Accounts receivable 261,774 204,062
Accounts payable -173,772 -140,886
Core working capital 422,284 300,101
Core working capital is defined as inventories plus accounts receivable minus accounts
payable.
HEXATRONIC GROUP AB (PUBL)
SOFIEROGATAN 3A, SE-412 51 GOTHENBURG, SWEDEN
WWW.HEXATRONICGROUP.COM
29You can also read