Analysis of Differences in the Degree of Biomechanical Adaptation according to Habituation to Different Heel Heights
←
→
Page content transcription
If your browser does not render page correctly, please read the page content below
Hindawi
e Scientific World Journal
Volume 2020, Article ID 1854313, 11 pages
https://doi.org/10.1155/2020/1854313
Research Article
Analysis of Differences in the Degree of Biomechanical Adaptation
according to Habituation to Different Heel Heights
Yu-Jin Cha
Department of Occupational Therapy, Semyung University, Jecheon 27136, Republic of Korea
Correspondence should be addressed to Yu-Jin Cha; occujin@naver.com
Received 10 March 2020; Revised 4 May 2020; Accepted 7 May 2020; Published 1 June 2020
Academic Editor: Rocio Maceiras
Copyright © 2020 Yu-Jin Cha. This is an open access article distributed under the Creative Commons Attribution License, which
permits unrestricted use, distribution, and reproduction in any medium, provided the original work is properly cited.
This study aims to comprehensively investigate whether there are any differences in the degree of biomechanical adaptation
according to habituation to different heel heights. The biomechanical characteristics of 54 subjects in 3 groups habituated to three
heel heights (low, medium-high, and high heels) were evaluated by the measurement of surface EMG, myotonometer (e.g.,
measurement of muscle tension), foot pressure, and lumbosacral angle, and comparative analysis was carried out to find out
whether they showed differences in the comfort visual analog scale (comfort VAS). Wearers of high-heeled shoes (6 cm or more in
heel height), in foot pressure comparison, showed significantly high peak pressure in the mask of the hallux, high maximum peak
EMG in the gastrocnemius medius (GM), and a high percentage of maximum voluntary isometric contraction (%MVIC) in the
plantar flexor. Wearers of low-heeled shoes (3 cm and below in heel height) showed the highest plantar peak pressure in the lateral
forefoot and midfoot, the highest contact area in midfoot, the highest %MVIC in the plantar flexion and dorsiflexion of the tibialis
anterior (TA), and the highest stiffness in the TA, and they showed the lowest static balance ability with eyes open (EO) among the
three groups. It was found that there were significant differences between those habituated to high-heeled shoes and those not
habituated to high-heeled shoes and that longtime wearing of high-heeled shoes brings about biomechanical adaptive changes in
the human body.
1. Introduction trunk and lower extremities [4]. Foot deformation or mus-
culoskeletal abnormality leads to decreased body balance
High-heeled shoes have harmful effects on gait and lower ability, which makes a normal gait difficult [5].
extremity function and also cause changes in body align- As a result of analyzing the changes of load in the foot
ment as they affect the center of gravity (COG) of the body according to heel heights, a conclusion was drawn that high
[1]. It has been reported that they cause hallux valgus de- heels increased the load on the forefoot, while releasing some
formity, bring about changes in the lumbosacral angle, and load on the rearfoot, which could aggravate hallux valgus
also change pressure patterns leading to low back pain [2]. In deformity [6]. There were significant differences between
addition, changes in kinetic and kinematic characteristics as wearers of high-heeled shoes and those of low-heeled shoes,
well as biomechanical adaptation of the spine are required to and the long-term wearing of high-heeled shoes resulted in
absorb the increased vertical shock experienced while differences such as lowered sensory function in the foot [7]
walking in high-heeled shoes [3]. and changes in the line of gravity for the ankle and knee
Biomechanical changes caused by heel height also in- joints (the biomechanical adaptation of the spine) [4]. Also,
fluence balance ability; the medial arch of the foot is raised, the wearers of high-heeled shoes showed significantly higher
the body weight is shifted forward while walking, and there muscle activation of the biceps femoris and neurophysio-
are changes in balance ability due to improper body align- logical adaptation of the femoral muscles, whereas they felt
ment as well as the weakening of plantar flexion and muscular less instability in the ankles than the wearers of low-heeled
strength, along with changes in the muscle activation of the shoes [8].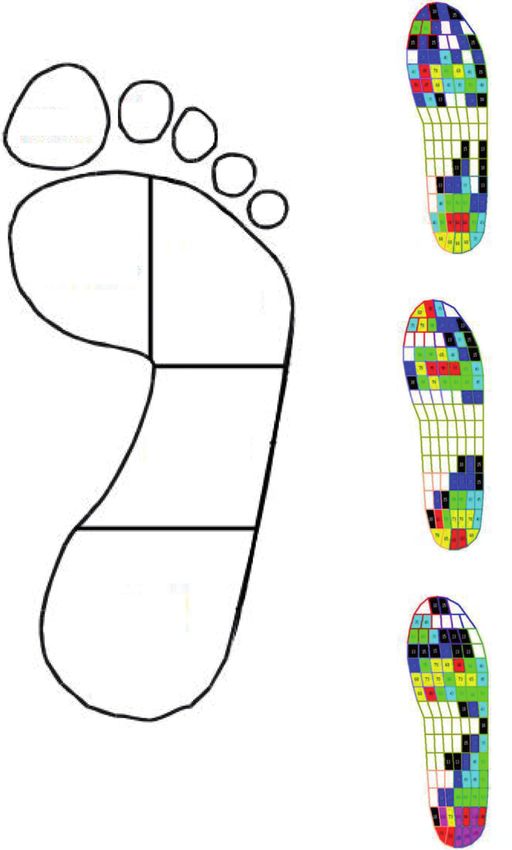
2 The Scientific World Journal
The insole was designed and developed to prevent influencing balance performance ability. The period of re-
muscle fatigue by dispersing body weight and protect the search was from April 29 to May 17, 2019.
ankle and knee joints through shock absorption in the The high-heeled shoes used for the experiment were
functional aspect [9]. As a result, the insole is a conservative identical products 7 cm in heel height and 1 cm2 in heel area,
means that can provide comfort and stability to users, fa- and shoes in standard sizes of 230, 235, 240, 245, and
cilitate walking, and prevent and treat musculoskeletal 250 mm were prepared in accordance with the foot sizes of
disorders that may occur in the feet [10]. The total contact the subjects (Product Name: Bonita 45764). The heel height
insole (TCI) reduced the heel pressure, decreased the impact means the height difference between the front and the back
force, redistributed the foot pressure, prevented the com- of the shoe, and the heel area was determined by measuring
pensation strategy of the joint, and was particularly effective the area of the heel touching the ground [15]. Measuring
in the energy efficiency of the hip joint and correcting instruments and variables used in this study are as follows
biomechanical alignment significantly more when it was (Figure 1).
applied to high-heeled shoes then it was applied to low-
heeled shoes [11, 12].
Previous studies have investigated bodily changes oc- 2.2. Data Collection
curring while wearing high-heeled shoes, but there are in-
2.2.1. In-Shoe Pressure Measuring System. The plantar
sufficient studies on body adaptation and biomechanical
pressure distribution data was collected using the Pedar-X
changes that may appear among those who wear high-heeled
System (Novel Gmbh, Germany). The plantar pressure
shoes for an extended period of time [8]. Wearers of low-
measuring system provides temporal and quantitative data
heeled shoes showed differences such as lowered muscle
about pressure on each part of the foot through a sensor
activation of the rectus femoris and enhanced activation of
attached to the insole and provides a wide range of data. It
the biceps femoris while standing in high-heeled shoes [13].
enables the analysis of the plantar center of pressure (COP)
This data, however, is somewhat insufficient for a clear
trajectory as well as peak force, peak pressure, impulse,
conclusion because only one kinetic aspect was investigated.
duration of stance phase, and loading rate, making it very
The purpose of this study is to comprehensively inves-
useful for diverse analysis [16]. To analyze the distribution of
tigate whether there are any differences in the degree of
plantar pressure measured under experiment conditions,
biomechanical adaptation caused by habituation to different
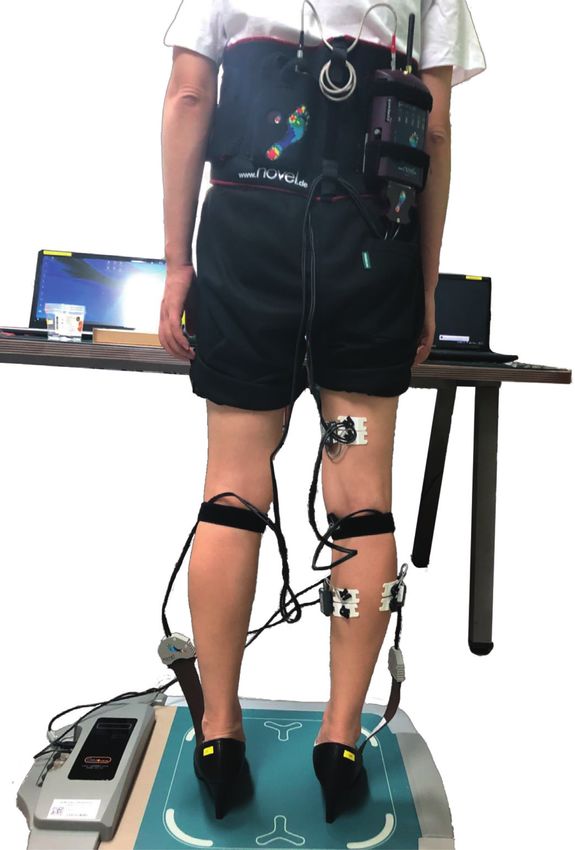
this study divided the foot into six anatomical regions
heel heights. For this, the measurements of surface EMG,
(masks) (hallux, toes, medial forefoot, lateral forefoot,
myotonometer, foot pressure, and lumbosacral angle were
midfoot, and heel) and measured peak pressure (PP) and
carried out, and comparative analysis was performed to find
contact area (CA) (Figure 2).
out whether there are any differences in the comfort visual
analog scale (comfort VAS) that can be attributed to changes
in heel height. 2.2.2. Surface EMG. To measure muscle activation, the
electromyograph of Noraxon EMG (Noraxon USA Inc.,
2. Methods Scottsdale AZ, USA) and electromyogram software MR-XP
Master Edition version 1.07 (Noraxon USA Inc., Scottsdale
2.1. Participants and Settings. The purpose and methods of AZ, USA) linked to a personal computer to store the col-
this study were explained to the subjects in advance, and lected data were used. Root mean square (RMS) processing
after informed consent to voluntarily participate in the was applied after the full-wave rectification of EMG signals
research was obtained from women between 19 and 36, the [17] (Figure 3).
experiments were conducted according to the procedure for Maximal voluntary isometric contraction (MVIC) was
the approval of the Institutional Review Board. There were a conducted in the position of the manual muscle test of the
total of 54 subjects organized into three groups: a group of 18 dorsiflexor and plantar flexor for the ankle of the dominant
women wearing high-heeled shoes 6 cm or more in heel lower extremity (LE), as suggested by Hislop and Mont-
height for 4 hours or more a day [14], a group of 17 women gomery [18], maintained for a period of five seconds, and
wearing medium high-heeled shoes 4-5 cm in heel height, repeated and measured three times. To determine each
and a group of 19 women wearing low-heeled shoes 3 cm or subject’s dominant leg, the subjects were asked to kick a ball,
less in heel height. In other words, wearing high-heeled and the leg used for kicking the ball was determined to be the
shoes (≥ 6 cm) was only applicable to Group A, not all dominant leg [19].
subjects.
Those who had neurological or orthopedic problems,
had experienced an orthopedic injury during the previous 2.2.3. Myotonometer. The MyotonPRO device (Myoton-
six months, had discomfort or complained of general pain PRO, Myoton Ltd., Estonia), a tactile soft-tissue measure-
throughout the body, had a deformed foot, or had psychi- ment system, is a digital palpation device that enables the
atric problems were excluded from the research. This study noninvasive assessment of mechanical properties, including
selected subjects of similar body indices who satisfied the tension, of soft tissues such as muscles and tendons [20–22].
WHO standard normal BMI of 18.5–24.9, in order to And it has been reported that their measurements have high
minimize the effects of stature, weight, foot size, etc. on objectivity and reliability, without depending on testers,
experiment results and to prevent these factors from even among patients with Parkinson’s disease or stroke as
The Scientific World Journal                                                                                                    3

                                                                   predicting balance owing to its high validity and reliability
                                                                   and it can be easily applied in daily life without using ex-
                                                                   pensive equipment. The subjects were asked to raise their
                                                                   arms to shoulder height in a standing position and reach as
                                                                   far forward as possible, and the maximal reach up to the end
                                                                   of the third finger was measured. In this study, the subjects
                                                                   in all three groups were asked to wear shoes for experiment
                                                                   7 cm in heel height, the measurements of the FRT were
                                                                   conducted three times, and the average of the measurements
                                                                   was obtained (Figure 5).

                                                                   2.2.6. Pelvic ROM. The lumbosacral angle was measured
                                                                   using BROM (Back Range of Motion) II. The subject was
                                                                   asked to relax and directed to stand erect. With the posture
                                                                   of ordinary people as a reference, subjects were asked to
                                                                   place their feet 15 cm apart and to put their arms in a
                                                                   comfortable position. The distance between the two feet was
                                                                   marked on the floor for consistency, so the possible influence
                                                                   of changes in the distance between the feet on the lumbo-
                                                    Noraxon EMG    sacral angle in each condition could be excluded [17]. A one-
                                                                   minute break was put between the measurements.

                                                PedarⓇ system
                                                                   2.2.7. Intrarater Reliability. For intrarater reliability, the
         7cm                                                       same rater obtained Cronbach’s alpha for the results of the
      high-heeled
                                                                   test-retest of the subjects’ lumbosacral angle as measured by
          shoe                                       Gaitview
                                                                   BROM II. It was found that ICC in the test-retest of BROM
                                                                   II was 0.939 and ICC for area 95% was 0.793, respectively
                    Figure 1: Experimental setup.                  [25]. In this study, Cronbach’s alpha was obtained to in-
                                                                   vestigate the intrarater reliability of the lumbosacral angle
                                                                   measured by BROM II, using the results of three mea-
well as healthy adults [23]. The present study measured the        surements, excluding the maximum value and the minimum
subjects’ muscular tension (F), stiffness (S), and elasticity (D)   value, among five measurements for a total of 30 subjects, 10
and selected four muscles to be measured, i.e., TA, RF, GM,        each from Groups A, B, and C.
and BF (Figure 4).

                                                                   2.2.8. Comfort Visual Analog Scale (Comfort VAS). The
2.2.4. Balance Assessment System (Gaitview System). The            comfort VAS was conducted to find a subjective comfort
Gaitview system can display on the monitor the COP and its         based on heel height and the duration that shoes were worn.
moving distance while weight is loaded on the measuring            The subjects were asked to specify the comfort levels of their
plate, and colors and relative numerical values are displayed      own shoes and the shoes for the experiment by indicating
according to loading degree, while training feedback is            positions along a continuous line between two endpoints.
possible by distributing weight applied to one leg. This study     The left endpoint was 0, which means “very uncomfortable,”
was performed using static balance tests where the subjects        and the right endpoint was 10, which means “very com-
stand on both feet in shoes 7 cm high, with eyes open and          fortable.” A questionnaire survey of the subjects was con-
closed. Three measurements were performed for 20 seconds           ducted to measure the comfort level of the 7 cm heeled shoes
per measurement, with a 10-second break between mea-               used in the experiment [26, 27].
surements, and then the average of the three measurements
was calculated [4]. The Gaitview pro 1.01 analytics program
was used, and the length of the path of the COP was                2.3. Research Procedure. To find out whether there are any
measured.                                                          differences in the degree of biomechanical adaptation (e.g.,
                                                                   structure, function, and motion of the mechanical aspects of
                                                                   biological systems, using the methods of mechanics)
2.2.5. Functional Reach Test. The functional reach test            according to habituation to different heel heights, the
(FRT), which was developed by Duncan et al., is a validated        subjects were divided into three groups of wearers of high-
test to measure dynamic balance ability. The FRT is a test         heeled shoes (6 cm or more in heel height), wearers of
that can measure the dynamic balance ability and flexibility        medium high-heeled shoes (3–5 cm in heel heights), and
while performing a functional task and it evaluates the limit      wearers of low-heeled shoes (3 cm and below in heel
of stability [24]. This study selected the FRT for measuring       heights). EMG electrodes were attached to the dominant leg
the dynamic balance ability because it is effective in
                                                                                               ®
                                                                   of each subject. A Pedar in-shoe pressure measuring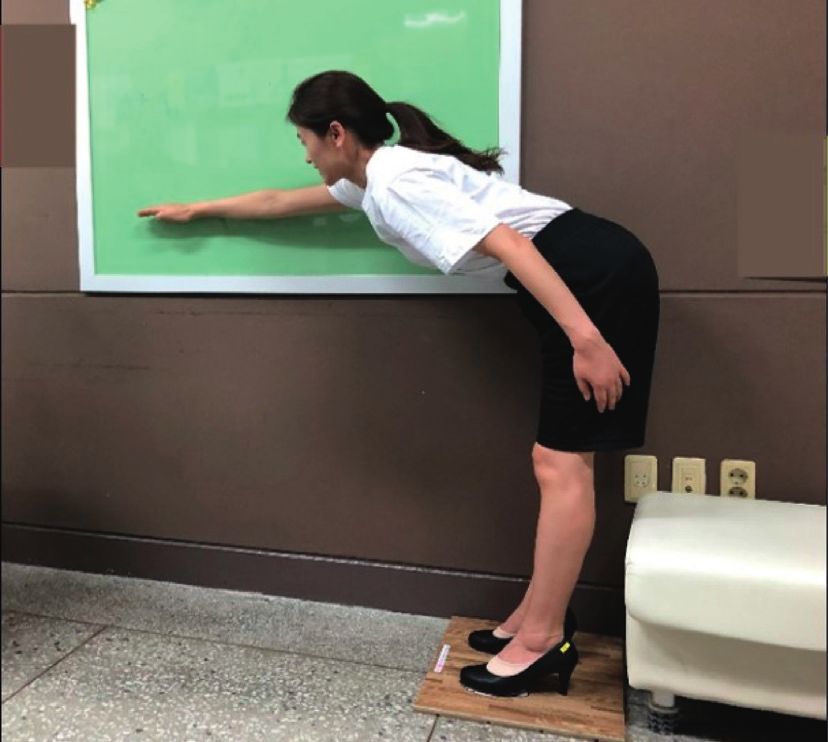
4                                                                                                                The Scientific World Journal

                                            Toes
                            Hallux
                                                      Toes

                                                             Toes

                                                                    Toes
                                                                                                   High-heeled
                                  Medial                                                              shoe
                                 forefoot
                                                        Lateral
                                                       forefoot

                                                     Midfoot

                                                                                                   Medium-high-heeled
                                                                                                         shoe

                                            Heel

                                                                                                   Low-heeled
                                                                                                      shoe

    Figure 2: Six masks of the Pedar-X in-shoe pressure measuring system and the distribution of pressure across sole regions.

           Item                                                   Action

           Tibialis anterior (TA)                    Dorsiflexion inversion, and
                                                          eversion of ankle
           Rectus femoris (RF)                      Knee extension and hip flexion
                                                                                                                               ES
           Gastrocnemius medius                    Plantar flexion of ankle and knee
           (GM)                                                  flexion
           Gastrocnemius lateralis                 Plantar flexion of ankle and knee   RF
           (GL)                                                  flexion                                                        BF

           Biceps femoris (BF)                      Knee flexion and hip extension
           Erector spinae (ES)                       Straighten and rotate the back     TA                       GM             GL

                                                                                             Anterior              Posterior
                                                   Figure 3: Surface electrodes attached points.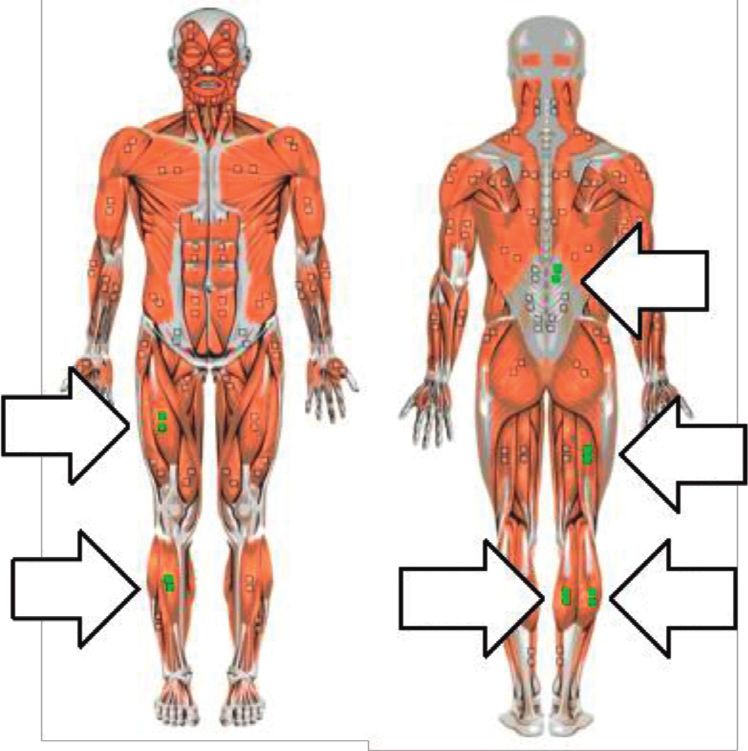
The Scientific World Journal                                                                                                5

Figure 4: Muscle stiffness was measured using the MyotonPro
device on muscle site.
                                                                               Figure 5: Functional reach test.
system insole was placed on the sole of the standard shoes
used in the experiment. The subject, wearing the 7 cm high      5 cm in heel height (Group B), and wearers of low-heeled
standard shoes, stood on the measurement plate of the           shoes 3 cm or below in heel height (Group C). As a result of
Gaitview system on both feet, three measurements were           homogeneity analysis among the three groups, it was found
performed for 20 seconds per measurement, with a 10-            that there were no significant differences in age, weight,
second break between measurements, and then the average         height, and shoes size among the groups, and so it may be
of the three measurements was calculated [4]. In this study,    said that they are homogeneous groups. On the other hand,
all subjects were standing on a plate while wearing high-       they showed differences in comfort VAS between their
heeled shoes (≥7 cm) because this study tried to find out if     habitual shoes and the 7 cm heeled shoes used for the ex-
biomechanical adaptation varied depending on three dif-         periment (p < 0.001). The group that answered that their
ferent heel heights. In other words, this study aimed to        habitual shoes were most comfortable was the wearers of
validate the assumption that body adaptation and biome-         low-heeled shoes (Group C), whereas the wearers of high-
chanical changes would be different according to the height      heeled shoes (Group A) indicated the highest level of
of commonly wearing shoes. After that, measurements were        comfort with the 7 cm heeled shoes used for the experiment
carried out in order for maximal voluntary isometric con-       (Figure 6).
traction (MVIC), functional reach test (FRT), myoton-
ometer, and comfort VAS.
                                                                3.1. Pressure Distribution. With regard to peak pressure, in
                                                                the mask of the hallux, it was significantly high among the
2.4. Statistical Analysis. The data for this study was pro-     wearers of high-heeled shoes (Group A) compared to
cessed and analyzed by using SPSS (version 22.0-Chicago,        Groups B and C, and in the mask of midfoot, it was sig-
IL, USA). The mean and standard deviation of the subjects’      nificantly high among the wearers of low-heeled shoes
general characteristics were obtained. For the analysis of      (Group C) compared to Groups A and B. As for the contact
homogeneity among the three groups, one-way ANOVA               area, in the mask of midfoot, it was significantly high among
was performed. As for the differences in surface EMG,            the wearers of low-heeled shoes (Group C) compared to
myotonometer, foot pressure, lumbosacral angle, and             Groups A and B (p < 0.05) (p < 0.001) (Table 2) (Figure 7).
comfort visual analog scale (comfort VAS), one-way
ANOVA was performed, and when it was judged that there
were differences in the results between groups, a post hoc       3.2. Surface EMG. The degree of EMG activity (RMS EMG)
test (Dunnett T3) was performed. The effect size (ES) is         showed significant differences in GM, GL, and ES among the
known as Cohen’s d [28], and the ES increases as the dif-       three groups; in GL and GS, it was the highest among
ference between the groups to be compared increases. To         wearers of medium-heeled shoes (Group B), followed by
investigate intrarater reliability from the results of three    Groups C and A. The maximum peak EMG showed sig-
measurements of the lumbar lordosis, Cronbach’s alpha was       nificant differences in RF, GM, BF, and ES; in RF and BF, it
obtained, using reliability analysis. The statistical signifi-   was the highest in the order of C, A, and B; in GM, in the
cance level was α � 0.05.                                       order of A, C, and B; and in ES, in the order of B, C, and A,
                                                                respectively (p < 0.05) (p < 0.001) (Table 3).

3. Results
                                                                3.3. Myotonometer. The groups showed significant differ-
The subjects of this study were 54 females in their 20 s, and   ences in the muscle tone (F) of TA, RF, and GM, the muscle
their characteristics are as shown in Table 1. They were        stiffness (S) of TA, and elasticity (D) of BF. The muscle
classified as those who had a past history of wearing high-      tone of RF and GM was the highest among the wearers of
heeled shoes 6 cm or more in heel height for 12 months or       high-heeled shoes (Group A), followed by Group C and
more (Group A), wearers of medium high-heeled shoes 4-          Group B. The muscle tone (F) of TA was the highest among
6 The Scientific World Journal
Table 1: General characteristics of subjects (N � 54).
Group Aa (N � 19) Group Bb (N � 17) Group Cc (N � 18) F p§
Age (years) 20.11 ± 1.59† 20.11 ± 1.59 19.66 ± 1.14 2.731 0.075
Weight (kg) 53.29 ± 4.06 55.00 ± 3.35 54.11 ± 5.09 1.216 0.305
Height (cm) 167.45 ± 3.13 166.02 ± 2.96 165.78 ± 3.87 1.353 0.268
Shoes size (mm) 240 ± 3.22 244.34 ± 2.21 246.23 ± 2.56 10.692 0.094
Habitual shoes 5.37 ± 1.46 6.65 ± 1.58 7.61 ± 2.20 7.448 0.001∗∗
Comfort rating
7 cm high-heeled shoe 6.78 ± 2.02 4.18 ± 1.78 5.48 ± 2.18 7.863 0.001∗∗
∗
p < 0.05 and ∗∗ p < 0.001. †Mean ± SD. §Statistical differences are the differences between all three groups. aOver 12 months, 4 times a week, and over 6 cm
heeled shoes group. bOver 12 months, 4 times a week, and 4-5 cm heeled shoes group. cOver 12 months, 4 times a week, and below 3 cm heeled shoes group.
Comfort rating high-heeled shoes (Group A), followed by Group B and
10 Group C. That is, it was Group A that showed the largest
∗∗ lumbosacral angle (p < 0.05) (Table 6).
8 ∗∗ ∗∗
6 4. Discussion
4 High-heeled shoes are considered one factor related to
musculoskeletal problems involving knees and legs because
2
they can cause changes in the static condition and dynamic
0 movement of the body. Therefore, this study was undertaken
Group A Group B Group C with the intent of comprehensively investigating whether
there are any differences in the degree of biomechanical
Habitual shoes
adaptation caused by habitation to different heel heights.
7cm high-heeled shoes
As a result of this study, it was found that, in the
Figure 6: Comparison of comfort rating between 3 groups. comparison of plantar pressure, while wearers of high-
∗∗
Significant difference between corresponding habitual shoes and heeled shoes showed significantly high peak pressure in the
7 cm high-heeled shoes (p < 0.001). mask of the hallux, wearers of low-heeled shoes showed
significantly high peak pressure in the masks of lateral
the wearers of low-heeled shoes (Group C), followed by forefoot and midfoot. And wearers of low-heeled shoes
Group A and Group B. The stiffness (S) of TA was the showed a significantly high contact area in the mask of
highest among the wearers of low-heeled shoes (Group C), midfoot. It is thought that this is due to the fact that wearers
followed by Group A and Group B. The elasticity of BF was of high-heeled shoes are habituated to a COG adapted to a
the highest among the wearers of medium high-heeled shoes forward shift. This supports the findings of previous studies
(Group B), followed by Group C and Group A (p < 0.05) that high-heeled shoes raise pressure on the forefoot [17, 29]
(p < 0.001) (Table 4). and increase shock force, pressure on the internal forefoot,
and discomfort [11].
In the comparison of EMG activation, the wearers of
3.4. Balance. The groups showed significant differences in medium high-heeled shoes showed the highest muscle ac-
static balance ability with open eyes, and the static balance tivation in GL and ES; the wearers of low-heeled shoes
ability was the highest among the wearers of low-heeled showed the highest maximum peak EMG in RF and BF, the
shoes (Group C), followed by Group B and Group A. It was wearers of high-heeled shoes in GM, and the wearers of
the wearers of high-heeled shoes (Group A) who showed the medium high-heeled shoes in ES, respectively. In the
most stable balance ability after putting on the 7 cm shoes for comparison of the %MVIC, the wearers of low-heeled shoes
the experiment (p < 0.05) (Table 5). showed the highest %MVIC in the plantar flexion and
dorsiflexion of TA and the wearers of medium-heeled shoes
3.5. Pelvic ROM in the plantar flexion of GL, respectively. These findings are
consistent with the findings of previous studies showing that
3.5.1. Intrarater Reliability. As for intrarater reliability, the habituation to high-heeled shoes resulted in neurophysio-
same rater obtained Cronbach’s alpha for the results of the logical adaptation in the rectus femoris (RF) and biceps
test-retest of the subjects’ lumbosacral angle measured by femoris (BF) [8, 30, 31] and increased the muscle activation
BROM II. Cronbach’s alpha for Groups A, B, and C was of plantar flexor [32]. They were also consistent with the
found to be 0.987, 0.906, and 0.996, respectively. In the case findings of a study showing that when males walked while
of Group B, the intrarater reliability showed 0.906, lower wearing high-heeled shoes, the maximal muscle activation of
than the other groups; however, all three groups showed their gastrocnemius decreased [33].
relatively high intrarater reliability. The groups showed In comparison using the myotonometer, the muscle tone
significant differences in the lumbosacral angle, and the of RF and GM was the highest among the wearers of high-
lumbosacral angle was the highest among the wearers of heeled shoes, and the muscle tone (F) of TA was the highestThe Scientific World Journal 7
Table 2: Comparison of mean pressure distribution by mask according to habituation to different heel heights.
Variables Group Aa Group Bb Group Cc F/p ES§ Post hoc
PP (kPa) 56.04 ± 13.13† 28.85 ± 14.20 54.04 ± 19.58 15.960/0.000∗∗ 3.09
Hallux A > C > B (Dunnett T3)
CA (cm2) 8.39 ± 1.52 7.71 ± 0.71 8.00 ± 1.77 1.035/0.363 0.24
PP (kPa) 24.78 ± 7.93 28.85 ± 14.20 26.94 ± 7.10 0.730/0.487 0.53
Toes
CA (cm2) 5.71 ± 1.93 6.27 ± 2.83 7.16 ± 2.09 1.903/0.160 0.40
PP (kPa) 75.77 ± 20.30 75.09 ± 24.88 81.75 ± 15.96 0.567/0.571 0.66
Medial forefoot
CA (cm2) 17.79 ± 1.73 17.93 ± 2.45 17.82 ± 2.27 0.037/0.964 0.04
PP (kPa) 62.35 ± 13.12 67.05 ± 18.75 77.39 ± 15.14 4.385/0.017∗ 2.11 C > B > A (Dunnett T3)
Lateral forefoot
CA (cm2) 16.01 ± 1.90 16.47 ± 1.80 16.69 ± 1.92 0.621/0.541 0.21
PP (kPa) 23.03 ± 9.36 24.29 ± 5.46 37.22 ± 14.00 10.580/0.000∗∗ 2.07 C > B > A (Dunnett T3)
Midfoot
CA (cm2) 5.60 ± 3.57 4.93 ± 3.78 8.70 ± 3.62 5.527/0.007∗ 0.85 C > A > B (Dunnett T3)
PP (kPa) 93.24 ± 18.11 82.75 ± 20.70 97.69 ± 17.94 2.862/0.066 1.42
Heel
CA (cm2) 27.43 ± 1.52 28.05 ± 0.44 28.26 ± 2.58 0.972/0.385 0.29
∗
p < 0.05 and ∗∗ p < 0.001. †Mean ± SD. §Effect size. aOver 12 months, 4 times a week, and over 6 cm heeled shoes group. bOver 12 months, 4 times a week, and
4-5 cm heeled shoes group. cOver 12 months, 4 times a week, and below 3 cm heeled shoes group. CA, contact area; PP, peak pressure.
Peak pressure Contact area
120 40
∗
100
∗∗ 30
80
∗∗
60 20
∗
40
10
20
0 0
Hallus Toes Medial Lateral Midfoot Heel Hallus Toes Medial Lateral Midfoot Heel
forefoot forefoot forefoot forefoot
Group A Group A
Group B Group B
Group C Group C
Figure 7: Comparison of mean pressure distribution by foot mask among the three groups.
among the wearers of low-heeled shoes. Stiffness (S) of TA put pressure on posterior ligament and facet joint, thereby
was the highest among the wearers of low-heeled shoes, and becoming a factor in causing lower back pain [35].
the elasticity of BF was the highest among the wearers of Differences in heel height also cause changes in balance
medium high-heeled shoes. This supported the findings of ability. A study showing significant changes in static balance
previous studies showing that high-heeled shoes increased ability suggests that balance ability was most stable among
the muscle activation of plantar flexor, inducing muscular the wearers of 3 cm heels [36], followed by barefoot and 7 cm
imbalance, and caused musculoskeletal problems such as heels, which is different from the findings of this study. It is
disc issues, degenerative arthritis, swollen and numb feet, difficult to compare the findings because the subjects and the
and changes in body shape [30, 32]. heel heights of shoes used for the experiments were different.
Finally, wearing high-heeled shoes for a long time causes Another study shows no significant difference in static
changes in the position of body segments and the center of balance ability according to heel heights both with eyes open
gravity, which results in compensatory kinematic and kinetic and with eyes closed, but its findings are consistent with the
changes [14]. High heels increase pelvic inclination due to the findings of this study in that the most stable balance ability
compensation of postural alignment control mechanisms due was found when the heel height was 7 cm in both groups [4].
to the biomechanical adaptive changes of the spine and lower At this time, good balance ability was found overall among
extremity joints and induce muscular fatigue, the decrease of women habituated to high heels, but significant differences
balance ability, and an increase in the risk of falling [34]. And in static balance ability were found according to whether
it has been reported that high-heeled shoes change spinal they were habituated to high heels or not [37]. This seems to
curvature according to the size of the lumbosacral angle and be because women habituated to high-heeled shoes showed
increase the shearing force to cause structural changes that physiological adaptation [33].8 The Scientific World Journal
Table 3: Comparison of muscle activation according to habituation to different heel heights.
Variables Group Aa Group Bb Group Cc F/p ES§ Post hoc
RMS EMG (μV) 6.07 ± 3.22† 8.20 ± 4.76 7.04 ± 3.23 1.431/0.249 0.45
TA Maximum peak EMG
329.84 ± 146.42 384.50 ± 189.32 339.76 ± 169.95 0.523/0.596 1.81
(μV)
2.163/
RMS EMG (μV) 8.10 ± 7.02 4.31 ± 2.89 6.87 ± 5.65 0.69
0.1260.69
RF
Maximum peak EMG C>A>B
260.80 ± 182.39 144.28 ± 61.45 274.99 ± 189.85 3.583/0.035∗ 4.79
(μV) (Dunnett T3)
B>A>C
RMS EMG (μV) 9.96 ± 3.21 14.98 ± 11.64 7.19 ± 4.99 4.824/0.012∗ 1.23
(Dunnett T3)
GM
Maximum peak EMG 19.424/ A>C>B
487.79 ± 194.26 197.95 ± 43.08 324.94 ± 130.18 10.73
Muscle (μV) 0.000∗∗ (Dunnett T3)
activation B>C>A
RMS EMG (μV) 5.66 ± 3.97 9.01 ± 4.23 6.38 ± 2.82 3.925/0.026∗ 0.74
(Dunnett T3)
GL
Maximum peak EMG
286.89 ± 207.10 406.34 ± 233.44 327.06 ± 141.82 1.667/0.199 3.54
(μV)
RMS EMG (μV) 2.69 ± 1.74 4.92 ± 6.95 3.70 ± 2.24 1.234/0.300 0.48
BF Maximum peak EMG C>A>B
148.56 ± 88.33 108.28 ± 31.39 202.81 ± 100.61 6.014/0.005∗ 4.46
(μV) (Dunnett T3)
9.617/ B>C>A
RMS EMG (μV) 2.98 ± 0.73 5.89 ± 2.99 3.54 ± 2.00 0.90
0.000∗∗ (Dunnett T3)
ES
Maximum peak EMG B>C>A
156.26 ± 38.95 288.26 ± 158.82 193.01 ± 92.77 7.206/0.002 5.60
(μV) (Dunnett T3)
C>A>B
Plantar flexion 2.98 ± 1.27† 2.94 ± 0.35 4.39 ± 2.93 3.507/0.038∗ 0.55
(Dunnett T3)
TA
C>B>A
Dorsiflexion 0.56 ± 0.48 0.82 ± 0.65 0.96 ± 5.20 1.450/0.003∗ 0.12
(Dunnett T3)
%MVIC Plantar flexion 12.57 ± 10.49 4.15 ± 2.62 6.92 ± 4.80 6.620/0.310 1.44
GM
Dorsiflexion 2.90 ± 2.11 5.90 ± 4.50 4.06 ± 0.99 3.654/0.244 0.77
B>C>A
Plantar flexion 2.86 ± 1.18 4.39 ± 3.15 4.27 ± 3.09 1.198/0.033∗ 0.45
GL (Dunnett T3)
Dorsiflexion 6.52 ± 4.63 8.07 ± 4.89 7.16 ± 4.90 0.471/0.627 0.29
∗
p < 0.05 and ∗∗ p < 0.001. †Mean ± SD. §Effect size. aOver 12 months, 4 times a week, and over 6 cm heeled shoes group. bOver 12 months, 4 times a week, and
4-5 cm heeled shoes group. cOver 12 months, 4 times a week, and below 3 cm heeled shoes group. TA, tibialis anterior; RF, rectus femoris; GM, medial
gastrocnemius; GL, lateral gastrocnemius; BF, biceps femoris; ES, thoracic erector spinae.
Table 4: Comparison of muscle tone (F), stiffness (S), and elasticity (D) according to habituation to different heel heights.
Variables Group Aa Group Bb Group Cc F/p ES§ Post hoc
F (Hz) 19.07 ± 1.00† 17.52 ± 1.44 19.34 ± 1.99 7.209/0.002∗ 0.65 C > A > B (Dunnett T3)
TA S (N/m) 385.26 ± 24.56 367.29 ± 55.48 411.83 ± 67.11 3.292/.045∗ 2.58 C > A > B (Dunnett T3)
D 1.24 ± 0.17 1.23 ± 0.23 1.15 ± 0.19 1.186/0.314 0.09
F (Hz) 14.52 ± 1.13 13.35 ± 0.44 14.13 ± 0.91 7.982/0.001∗∗ 0.52 A > C > B (Dunnett T3)
RF S (N/m) 232.95 ± 30.94 216.76 ± 11.80 226.78 ± 23.91 2.076/0.136 1.41
D 1.20 ± 0.22 1.28 ± 0.14 1.20 ± 0.26 0.832/0.441 0.08
F (Hz) 16.15 ± 1.67 14.71 ± 1.50 15.37 ± 1.54 3.756/0.030∗ 0.47 A > C > B (Dunnett T3)
GM S (N/m) 262.79 ± 35.64 238.82 ± 33.46 262.50 ± 31.17 2.943/0.062 1.91
D 1.40 ± 0.21 1.48 ± 0.09 1.40 ± 0.15 1.390/0.258 0.10
F (Hz) 13.82 ± 1.77 13.60 ± 1.22 14.40 ± 0.87 1.672/0.198 0.30
BF S (N/m) 207.32 ± 41.09 227.47 ± 26.41 221.06 ± 23.36 1.936/0.155 1.54
D 1.03 ± 0.15 1.22 ± 0.08 1.08 ± 0.23 6.086/0.004∗ 0.20 B > C > A (Dunnett T3)
∗ ∗∗ † § a b
p < 0.05 and p < 0.001. Mean ± SD. Effect size. Over 12 months, 4 times a week, and over 6 cm heeled shoes group. Over 12 months, 4 times a week, and
4-5 cm heeled shoes group. cOver 12 months, 4 times a week, and below 3 cm heeled shoes group. TA, tibialis anterior; RF, rectus femoris; GM, medial
gastrocnemius; BF, biceps femoris.
The greatest change in the lumbosacral angle in standing lumbosacral angle, and this shows that the increase in heel
position was in those who wore high-heeled shoes. This height acts as a factor that increases the muscle tone of a
result is consistent with the findings of previous studies particular region and induces fatigue [8]. Particularly, in-
suggesting that the higher the heel height, the greater the creased load on the lumbar vertebra is involved in the
muscle activation of the lower extremities and the formation of posture during walking and the movement ofThe Scientific World Journal 9
Table 5: Comparison of balance ability according to habituation to different heel heights.
Group Aa Group Bb Group Cc F/p ES§ Post hoc
EO 103.67 ± 13.15† 133.42 ± 64.66 162.47 ± 96.81 3.578/0.035∗ 3.19
Static balance (COP)
EC 141.74 ± 44.07 120.23 ± 41.69 157.79 ± 80.88 1.828/0.171 2.70 C > B > A (Dunnett T3)
FRT 31.14 ± 8.52 32.04 ± 6.65 27.42 ± 6.02 2.080/0.136 0.75
∗
p < 0.05. †Mean ± SD. §Effect size. aOver 12 months, 4 times a week, and over 6 cm heeled shoes group. bOver 12 months, 4 times a week, and 4-5 cm heeled
shoes group. cOver 12 months, 4 times a week, and below 3 cm heeled shoes group. EO, eye opening; EC, eye close; COP, center of pressure; FRT, functional
reach test.
Table 6: Difference in lumbosacral angle and Cronbach α according to habituation to different heel heights.
Group Aa Group Bb Group Cc F/p ES§ Post hoc
Pelvic ROM (° ) 94.02 ± 8.80† 91.56 ± 7.32 85.69 ± 11.66 3.756/0.030∗ 1.16 A > B > C (Dunnett T3)
Cronbach α 0.987∗∗ 0.906∗∗ 0.996∗∗
∗
p < 0.05. †Mean ± SD. §Effect size. aOver 12 months, 4 times a week, and over 6 cm heeled shoes group. bOver 12 months, 4 times a week, and 4-5 cm heeled
shoes group. cOver 12 months, 4 times a week, and below 3 cm heeled shoes group.
the central point of the human body and thus has effects on differences in the comfort VAS. The wearers of high-heeled
the stability of the human body and influences muscle ac- shoes (Group A) showed significantly high peak pressure in
tivation of every region accordingly. Wearing high-heeled the masks of hallux and midfoot, a significantly high contact
shoes increases the plantar flexion of the ankle joints and area in the mask of midfoot, high maximum peak EMG in
brings about changes in the relative position of bones within GM, and more active muscle activation in plantar flexor. In
the joint and the muscle origin [37]. addition, they showed the highest muscle tone of RF and GM,
It was found that there were significant differences be- the largest lumbosacral angle, and the most stable static
tween those habituated to high-heeled shoes and those not balance ability (COP) in 7 cm heels with eyes open.
habituated to high-heeled shoes and that longtime wearing The wearers of medium-heeled shoes (Group B) showed
of high-heeled shoes brings about biomechanical adaptive the highest muscle activation and maximum peak EMG in
changes in the human body. It is expected that foot pressure, ES, the highest %MVIC in the plantar flexion, and the
surface EMG, or proprioception will be different between the highest elasticity in BF. The wearers of low-heeled shoes
two conditions (eyes open and eyes close). However, this (Group C) showed the highest plantar peak pressure in the
study conducted the test only under the eyes open condition mask of the lateral forefoot, the highest %MVIC in the
because people live their lives and walk around with their plantar flexion and dorsiflexion of TA, and the highest
eyes open. Therefore, it is believed that future studies need to stiffness in TA.
compare the two conditions (eyes open and eyes close). A In conclusion, it was found that there were significant
secondary limitation of this study is that the subjects were differences between those habituated to high-heeled shoes
mostly those in their early twenties, and thus it is difficult to (Group A) and those not habituated to high-heeled shoes
generalize the findings across ages. And it is deemed that (Groups B and C) and that wearing of high-heeled shoes
future studies will need to conduct research on adult women brings about biomechanical adaptive changes in the human
of various age brackets. body. On the basis of these findings, this study intends to
Further studies will have to be conducted continuously provide basic data for developing customized insoles that
to link various changes in the sensory system to kinematic have aesthetic factors, convenience, and biocompatibility
analysis regarding the movement of COG and the efficiency and are also able to disperse pressure and absorb and release
of movement according to habituation to heel heights. In shocks from high-heeled shoes differentiated according to
addition, to prevent disorders caused by habituation to heel habituation by heel height.
heights, research should be continued regarding the mate-
rials and structure of insoles that can disperse pressure Data Availability
evenly in consideration of differentiated shock variables.
The data used to support the findings of this study are
available from the author upon request.
5. Conclusion
This study was conducted to investigate whether there are any
Ethical Approval
differences in the degree of biomechanical adaptation caused An exemption from the Institutional Review Board at
by habitation to different heel heights. For this, the subjects’ Semyung University (SMU-2018-09-004) was obtained.
biomechanical characteristics were evaluated by the mea-
surement of surface EMG, myotonometer, foot pressure, and Conflicts of Interest
lumbosacral angle, and comparative analysis was carried out
comprehensively to find out whether the subjects showed The author declares that he has no conflicts of interest.10 The Scientific World Journal
Acknowledgments [15] H. M. Jeong, “Effects of the differences in shoe heel-height on
balanced performances,” Journal of Korean Physical Therapy,
This paper is extracted from a part of the result of a research vol. 16, pp. 559–565, 2004.
project (No. NRF-2018RICIB5083000) supported by Na- [16] A. B. Putti, G. P. Arnold, L. Cochrane, and R. J. Abboud, “The
tional Research Foundation of Korea. Pedar in-shoe system: repeatability and normal pressure
values,” Gait & Posture, vol. 25, no. 3, pp. 401–405, 2007.
[17] D. J. Stefanyshyn, B. M. Nigg, V. Fisher, B. O’Flynn, and
References W. Liu, “The influence of high heeled shoes on kinematics,
kinetics, and muscle EMG of normal female gait,” Journal of
[1] G. S. Moon and T. H. Kim, “The effect of total contact inserts Applied Biomechanics, vol. 16, no. 3, pp. 309–319, 2000.
on the gait parameters during high-heeled shoes walking,” [18] H. Hislop and J. Montgomery, Muscle Testing and Function,
Korean Research Society of Physical Therapy, vol. 18, no. 2, WB Saunders, Philadelphia, PA, USA, 7th edition, 2002.
pp. 1–8, 2011. [19] L. Edwards, J. Dixon, J. R. Kent, D. Hodgson, and
[2] W. S. Chae, Y. T. Lim, M. H. Lee et al., “The effects of wearing V. J. Whittaker, “Effect of shoe heel height on vastus medialis
roller shoes on muscle activity in the lower extremity during and vastus lateralis electromyographic activity during sit to
walking,” Korean Journal of Sport Biomechanics, vol. 16, no. 3, stand,” Journal of Orthopaedic Surgery and Research, vol. 3,
pp. 137–148, 2006. no. 1, pp. 1–7, 2008.
[3] R. E. Snow, K. R. Williams, and G. B. Holmes, “The effects of [20] C. S. Kim and M. K. Kim, “Mechanical properties and physical
wearing high heeled shoes on pedal pressure in women,” Foot fitness of trunk muscles using Myoton,” Korean Journal of
& Ankle, vol. 13, no. 2, pp. 85–92, 1992. Sport Studies, vol. 55, no. 1, pp. 633–642, 2015.
[4] H. J. Lee, S. J. Lee, and K. S. Tae, “Comparison of balance [21] P. W. Kong, Y. H. Chua, M. Kawabata, S. F. Burns, and C. Cai,
ability on the heel height and the habituation to the high heel,” “Effect of post-exercise massage on passive muscle stiffness
Journal of Biomedical Engineering Research, vol. 31, no. 2, measured using myotonometry—a double-blind study,”
pp. 106–113, 2010. Journal of Sports Science & Medicine, vol. 17, no. 4,
[5] K. O. Yi, “The effect of shoe type on plantar pressure dis- pp. 599–606, 2018.
tributions,” Korean Association of Physical Education and [22] J. S. Son, H. S. Choi, S. J. Hwang, and Y. H. Kim, “Changes of
Sport for Girls and Women, vol. 20, no. 4, pp. 161–168, 2006. muscle length and roll-over characteristics during high-heel
[6] M. Nyska, C. McCabe, K. Linge, and L. Klenerman, “Plantar walking,” Journal of the Korean Society for Precision Engi-
foot pressures during treadmill walking with high-heel and neering, vol. 24, no. 12, pp. 29–35, 2007.
low-heel shoes,” Foot & Ankle International, vol. 17, no. 11, [23] M. Masaki, T. Aoyama, T. Murakami et al., “Association of
pp. 662–666, 1996. low back pain with muscle stiffness and muscle mass of the
[7] A. Kavounoudias, R. Roll, and J.-P. Roll, “The plantar sole is a lumbar back muscles, and sagittal spinal alignment in young
‘dynamometric map’ for human balance control,” Neuro- and middle-aged medical workers,” Clinical Biomechanics,
Report, vol. 9, no. 14, pp. 3247–3252, 1998. vol. 49, pp. 128–133, 2017.
[8] E. Y. Park, W. H. Kim, G. O. Kim, and S. H. Cho, “Effects of [24] P. W. Duncan, D. K. Weiner, J. Chandler, and S. Studenski,
high-heel shoes on EMG activities of rectus femoris and “Functional reach: a new clinical measure of balance,” Journal
biceps femoris,” Korean Research Society of Physical Therapy, of Gerontology, vol. 45, no. 6, pp. M192–M197, 1990.
vol. 6, no. 2, pp. 32–42, 1999. [25] D.-S. Park, D.-Y. Lee, S.-J. Choi, and W.-S. Shin, “Reliability
[9] J. H. Jung, J. Y. Kim, Y. I. Moon, H. J. Kim, and J. M. Shim, and validity of the balancia using wii balance board for as-
“The effect of height increase elevator shoes insole on whole sessment of balance with stroke patients,” Journal of the Korea
body functional changes -focused on adult male in their Academia-Industrial Cooperation Society, vol. 14, no. 6,
twenties-,” Korean Journal of Sports Science, vol. 18, no. 2, pp. 2767–2772, 2013.
pp. 1403–1418, 2009. [26] S. A. Shin, D. S. Choi, C. Y. Kim, B. R. Han, H. D. Lee, and
[10] B. Vicenzino, “Foot orthotics in the treatment of lower limb S. C. Lee, “The influence of raised heel insoles on lower ex-
conditions: a musculoskeletal physiotherapy perspective,” tremity joint kinematics of young male during walking,” Ko-
Manual Therapy, vol. 9, no. 4, pp. 185–196, 2004. rean Journal of Sport Science, vol. 23, no. 2, pp. 232–243, 2012.
[11] Y. H. Lee and W. H. Hong, “Effects of shoe inserts and heel [27] W.-H. Hong, Y.-H. Lee, H.-C. Chen, Y.-C. Pei, and C.-Y. Wu,
height on foot pressure, impact force, and perceived comfort “Influence of heel height and shoe insert on comfort per-
during walking,” Applied Ergonomics, vol. 36, no. 3, ception and biomechanical performance of young female
pp. 355–362, 2005. adults during walking,” Foot & Ankle International, vol. 26,
[12] E. H. Ko, H. S. Choi, T. H. Kim, H. S. Cynn, O. Y. Kwon, and no. 12, pp. 1042–1048, 2005.
K. H. Choi, “The effect of high-heeled shoes with total contact [28] Cohen, Statistical Power Analysis for the Social Sciences,
inserts in the gait characteristics of young female adults Erlbaum, Hillsdale, NJ, USA, 1988.
during lower extremity muscle fatigue,” Physical Therapy [29] B. H. Song and J. Y. Park, “The effect of heel-heights on
Korea, vol. 15, no. 1, pp. 38–45, 2008. lumbar lordosis for young ladies,” Journal of Korean Society of
[13] Y. S. Lee, S. S. Kim, and S. H. Yoo, “The effect of insole heights Physical Therapy, vol. 13, no. 3, pp. 613–624, 2001.
on lumbosacral angle and physical function in healthy male,” [30] A. Gefen, M. Megido-Ravid, Y. Itzchak, and M. Arcan,
in Proceedings of the Conference of the Ergonomics Society of “Analysis of muscular fatigue and foot stability during high-
Korea, pp. 601–606, Seoul, South Korea, 2015. heeled gait,” Gait & Posture, vol. 15, no. 1, pp. 56–63, 2002.
[14] R. E. Snow and K. R. Williams, “High heeled shoes: their effect [31] A. Gefen, M. Megido-Ravid, Y. Itzchak, and M. Arcan,
on center of mass position, posture, three-dimensional ki- “Biomechanical analysis of the three-dimensional foot
nematics, rearfoot motion, and ground reaction forces,” structure during gait: a basic tool for clinical applications,”
Archives of Physical Medicine and Rehabilitation, vol. 75, Journal of Biomechanical Engineering, vol. 122, no. 6,
no. 5, pp. 568–576, 1994. pp. 630–639, 2000.The Scientific World Journal 11
[32] E. J. Kim, S. B. Jeon, and K. Y. Jeong, “Influences of short-term
high-heeled walking on the activities of ankle-stabilizing
muscles in healthy young females,” Journal of Korean
Academy of Orthopedic Manual Therapy, vol. 21, no. 2,
pp. 39–46, 2015.
[33] K. H. Lee, J. C. Shieh, A. Matteliano, and T. Smiehorowski,
“Electromyographic changes of leg muscles with heel lifts in
women: therapeutic implications,” Archives of Physical
Medicine and Rehabilitation, vol. 71, no. 1, pp. 31–33, 1990.
[34] J. E. Seebergh and J. C. Berg, “A comparison of force and
optical techniques for the measurement of dynamic contact
angles,” Chemical Engineering Science, vol. 47, no. 17-18,
pp. 4468–4470, 1992.
[35] S. Y. Kim and I. H. Baek, “Effects of transversus abdominal
muscle stabilization exercise to spinal segment motion on
trunk flexion—extension,” Physical Therapy Korea, vol. 10,
no. 1, pp. 63–76, 2003.
[36] Y. J. Lee, M. H. Oh, G. Y. Kim, G. W. Nam, H. H. Paek, and
J. J. Kim, “The relationship of balance and walking with
prefered type of shoes in the elderly,” Journal of Occupational
Therapy for the Aged and Dementia, vol. 1, no. 1, pp. 30–37,
2007.
[37] W. H. Kim and E. Y. Park, “Effects of the high-heeled shoes on
the sensory system and balance in women,” Physical Therapy
Korea, vol. 4, no. 2, pp. 10–17, 1997.You can also read