D4.2 Regeneration and performance of reverse osmosis membranes from desalination plants - July 2018
←
→
Page content transcription
If your browser does not render page correctly, please read the page content below
Ref. Ares(2018)4035651 - 31/07/2018

D4.2 Regeneration and performance
of reverse osmosis membranes from
desalination plants

July 2018
Characterization of wastewater produced in the production
Deliverable D4.2
                                             process
                                             WP4 – Promoting circular economy in the chemical sector: an
Related Work Package                         innovative approach to recover resources from wastewater generated
                                             in the silica industry
Deliverable lead                             CTM
Author(s)                                    Anna Casadellà, Sandra Meca
Reviewer                                     LENNTECH
Contact(s)                                   sandra.meca@ctm.com.es
Grant Agreement Number                       730390
Funding body(ies)                            European Union’s Horizon 2020 Framework Program
Starting date                                1-June 2017
Project duration                             48 months
Type of Delivery (R, DEM, DEC,
       1                                     R = Report
Other)
                                 2
Dissemination Level (PU, CO, Cl)             PU=Public
Date last update                             31 July 2018
Approved by                                  Roelof Moll
Website                                      www.zerobrine.eu

Revision no            Date              Description                          Author(s)
                                                                              Anna Casadellà (CTM) (with support
0.1                    2.07.2018         First draft
                                                                              of TYPSA)
0.2                    6.07.2018         Revision                             Sandra Meca (CTM)
0.3                    30.07.2018        Final version                        Sandra Meca (CTM)
0.4

                                          The ZERO BRINE project has received funding from the European
                                          Commission under the Horizon 2020 programme, Grant
                                          Agreement no. 730390.

                                          The opinions expressed in this document reflect only the author’s
                                          view and in no way reflect the European Commission’s opinions.
                                          The European Commission is not responsible for any use that may
                                          be made of the information it contains.

1
    R=Document, report; DEM=Demonstrator, pilot prototype; DEC=website, patent fillings, videos, etc.; OTHER=other
2
    PU=Public; CO=Confidential, only for members of the consortium (including the Comission Services), Cl=Classified

                                                                                                                       1
Content

List of Tables ........................................................................................................... 3
List of Figures .......................................................................................................... 4
Glossary .................................................................................................................. 5
Executive summary ................................................................................................. 6
1.       Introduction ................................................................................................. 8
         a.        Membrane regeneration .......................................................................................................9
         b.        Tailor-made membranes properties ...................................................................................11
2.       Objective .................................................................................................... 13
3.       Regeneration methodology ........................................................................ 14
         c.     Membranes characterization ..................................................................................................14
         d.        Laboratory-scale regeneration ............................................................................................15
         i.     Testing set-up (Spanish BEC BP-2) ..................................................................................... 16
         ii.    Regeneration set-up (Spanish BEC-BP-12) ........................................................................ 18
         e.        Pilot plant-scale regeneration .............................................................................................19
         iii.      Equipment to carry out hydration ................................................................................. 19
         iv.       Pilot plant for testing and oxidizing ............................................................................... 20
         f.     Analytical determinations .......................................................................................................23
4.       Regeneration results ................................................................................... 23
         a.        End-of-life membranes characterization.............................................................................23
         b.        Lab-scale regeneration ........................................................................................................25
         i.     Effect of hydration ............................................................................................................. 25
         ii.    Effect of pH ........................................................................................................................ 27
         iii.      Effect of OA concentration ............................................................................................ 28
         iv.       Effect of dose ................................................................................................................. 29
         v.     Optimal conditions for tailor-made membranes .............................................................. 31
         c.     Pilot plant regeneration ..........................................................................................................33
         i.     Regenerated membranes: type I. ...................................................................................... 33
         ii.    Regenerated membranes: Type II. .................................................................................... 34

5.       Conclusions ................................................................................................ 36
6.       References .................................................................................................. 37

                                                                                                                                                      2
List of Tables
Table 1. Definition of targeted tailor-made membranes ........................................................................ 6
Table 2. Characterization of the target aqueous waste streams. (n/a = not applicable; SD =standard
            deviation; n=number of samples). ........................................................................................... 8
Table 3. Permeability and salt rejection of commercial membranes. .................................................. 12
Table 4. Target properties of the tailor-made membranes. ................................................................. 13
Table 5. Specifications of the commercial SW-RO and BW-RO membrane used for regeneration. ..... 14
Table 6. Standard test conditions and expected permeability and salt rejection. ............................... 14
Table 7. Operating conditions of pilot plant for standard tests of NF. ................................................. 15
Table 8. Operating conditions of the testing cell (flat-sheet membrane module) for standard tests of
            BW-RO. ................................................................................................................................... 18
Table 9. Description of the tested conditions during regeneration studies. ........................................ 18
Table 10. Relation of the equipment of the pilot plant to oxidize the membranes. ............................ 21
Table 11. Description of the used analytical methods. ......................................................................... 23
Table 12. Comparison of the performance of end-of-life SW-RO membranes with commercial
            membranes at pilot-scale. ..................................................................................................... 23
Table 13. Evaluation of end-of-life SW and BW coupons at lab-scale. ................................................. 24
Table 14. Performance of one H-1 hydrated membrane with synthetic solution. ............................... 32
Table 15. Removal of Cl and SO4 from the synthetic solution with oxidized membranes at different
            doses. ..................................................................................................................................... 32
Table 16. Effect of hydrating contact mode on end-of-life SW-RO elements....................................... 33
Table 17. Regenerated end-of-life SW-RO elements previously hydrated to Type I membranes. ....... 34
Table 18. Regenerated end-of-life SW-RO elements to Type II membranes. ....................................... 35
Table 19. Standard tests for regenerated end-of-life SW-RO elements Type II membranes at 10bar. 36

                                                                                                                                                         3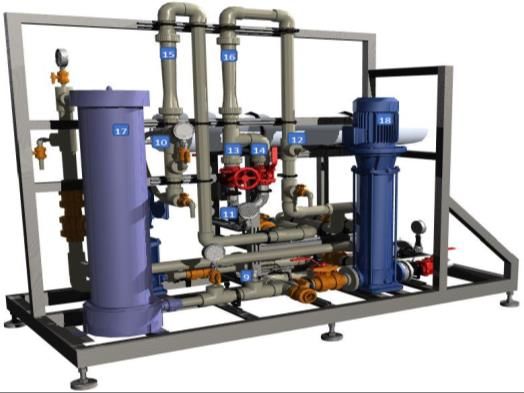
List of Figures
Figure 1. Water cycle in the production process at IQE. ......................................................................... 8
Figure 2. Effluents of a RO system........................................................................................................... 9
Figure 3. Water cycle in the production process together with reuses of regenerated RO effluents. . 12
Figure 4. General methodology to regenerate membranes. ................................................................ 16
Figure 5. BW-RO membrane element opened to access the membrane sheets. ................................. 16
Figure 6. Flat-sheet membrane module used for regenerated membrane tests. ................................ 17
Figure 7. Experimental set-up for membrane testing at lab-scale. ....................................................... 17
Figure 8. Experimental set-up for oxidizing the membrane at lab-scale. ............................................. 19
Figure 9. PVC case for membrane elements to be hydrated. ............................................................... 20
Figure 10. 3-D model of the pilot plant used for oxidation and tests on membrane performance. .... 20
Figure 11. Pictures of the regeneration pilot plant used for oxidation and tests on membrane
               performance. ....................................................................................................................... 22
Figure 12. Effect of the hydrating solvents on end-of-life BW-RO at lab-scale (n=1). .......................... 25
Figure 13. Effect of the hydrating solvents on end-of-life SW-RO at lab-scale (n=1). .......................... 26
Figure 14. Effect of hydrating solvents on oxidative process of end-of-life BW-RO coupons. ............. 27
Figure 15. Effect of pH on the regeneration process of BW-RO coupons at lab-scale (n=1). ............... 27
Figure 16. Effect of OA concentration on end-of-life BW-RO coupons (n=1) ....................................... 28
Figure 17. Effect of OA concentration on hydrated SW-RO membranes (n=3) using a dose of
               2,000ppm·h. ........................................................................................................................ 29
Figure 18. Effect of OA doses on BW-RO coupons with two different hydrating solvents, H-1 (n=3). . 30
Figure 19. Effect of OA doses on SW-RO coupons (n=2)                                 . ............................................................... 31
Figure 20. P vs Q curves for the SW-RO regenerated membranes at lab-scale with synthetic water. . 31
Figure 21. Effect of dose of OA on a hydrated SW-RO element. Results from NaCl standard tests. .... 34
Figure 22. Effect of the dose for the two regenerated elements ......................................................... 35

                                                                                                                                                       4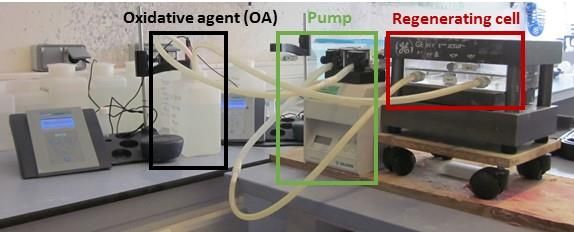
Glossary
BEC        brine excellence center
BW         brackish water
BW-RO      brackish water reverse osmosis membrane
EC         electrical conductivity
H-1        hydrating solvent 1
H-2        hydrating solvent 2
IQE        Industrias Químicas del Ebro, S.A.
LMH        L/m2·h
MF         microfiltration
NF         nanofiltration
OA         oxidative agent
PA         polyamide
ppm        part per million, mg/L
ppm·h      part per million per hour
RO         reverse osmosis
SD         standard deviation
SW         seawater
SW-RO      seawater reverse osmosis membrane
TFN        thin-film nanocomposite
TIC        total inorganic carbon
WP4        work package 4 of Zero Brine project

                                                     5
Executive summary
Zero Brine means to apply Circular Economy in various process industries by developing necessary
concepts, technological solutions and business models. The purpose is to redesign the value and
supply chains of minerals and water while dealing with present organic compounds in a way
that allows their subsequent recovery. This is achieved by demonstrating new configurations to
recover these resources from saline effluents generated by process industries, while eliminating
wastewater discharge and minimising environmental impact of industrial operations thorough
brines.

The objective of Task 4.1.4 of WP4 is to produce regenerated tailor-made membranes from end-of-
life reverse osmosis (RO) elements from desalination plants. These produced membranes will be
used at the silica factory IQE in Zaragoza to treat saline wastewater from the production line. As the
wastewater is treated with the regenerated membranes two effluents are going to derive: permeate
and concentrate. Permeate with high quality is going to be reused in the productive process and
concentrate with a high salinity is going to be fed into a crystallization process so to obtain high
quality water and solid salts.

To achieve the aimed tailor-made membranes, two types have been defined regarding permeability
and rejection of salts. Type I has permeability higher than commercial SW-RO membranes and a
rejection similar to BW-RO membranes. Type II has permeability higher than commercial NF
membranes and a rejection above 85% which is the lower limit for permeate to be reused at IQE
(Table 1). Tests carried out have been standard tests with NaCl and MgSO4 in order to compare with
commercial membranes.

                             Table 1. Definition of targeted tailor-made membranes

                                           Permeability       Salt rejection
                                           (L/m2·h·bar)             (%)
                                 Type I       > 1.98              > 99.0
                                 Type II       > 3.31              > 85.0

Regeneration has been divided in two steps: hydration and oxidation. To hydrate membranes, at lab-
scale, three different solvents have been studied - distilled water, H-1 and H-2 – being H-1 the
solvent that gave higher increases on permeability and rejection to the end-of-life membranes. At
pilot-scale, immersion and recirculation were studied as contact mode for hydration. Both
methodologies gave similar results although time frame required for immersion is superior to the
one for recirculation.

Relevant parameters have also been used to study the optimal conditions for oxidize the membrane,
such as: pH, concentration of oxidative agent (OA), doses of OA and performance with synthetic
solution. Oxidation of the membrane elements and thus higher permeability and lower rejection
(within the set limits) were achieved under basic pH and a concentration C2 of OA. Regarding doses,

                                                                                                     6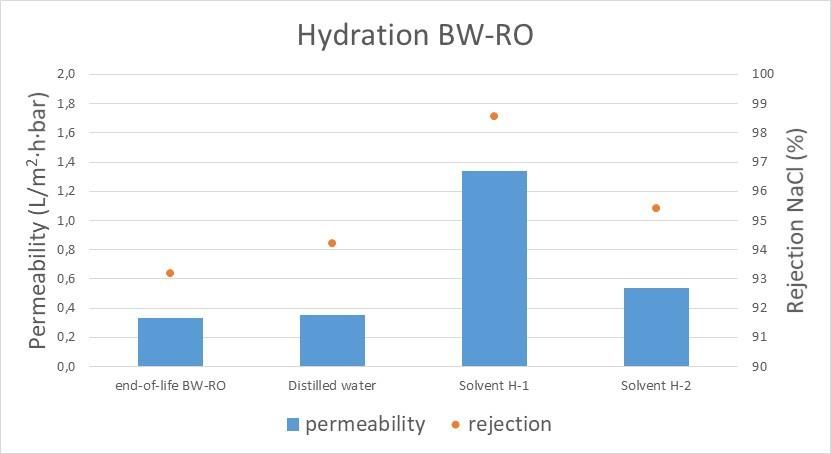
results differed from the lab and the pilot plant which can be explained considering the difference on
surface area between both cases. For example, to achieve a membrane Type II, in the lab it was
required a dose of 6,000ppm·h whilst in the pilot plant around 20,000 ppm·h. Tests with synthetic
solution and standard tests with sulphate gave satisfactory results on the membrane performance. In
both cases, permeability and rejection comply with the limits established for their proper operation
at IQE.

Both types of regenerated membranes, I and II, are suitable to be operated at the pilot plant that is
going to be installed at the silica factory IQE. There, the type of membrane with the best
performance for real effluents is going to be evaluated.

                                                                                                     7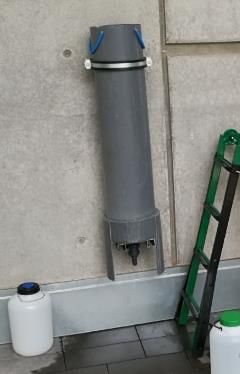
1. Introduction
ZERO BRINE project aims to facilitate the implementation of the Circular Economy package and the
SPIRE roadmap in various process industries. To do so, it is focused on developing necessary
concepts, technological solutions and business models to redesign the value and supply chains of
minerals and water while dealing with present organic compounds in a way that allows their
subsequent recovery. This is achieved by demonstrating new configurations to recover these
resources from saline effluents generated by process industries, while eliminating wastewater
discharge and minimising environmental impact of industrial operational brines.

One of the four demonstration sites of the project will be located at Industrias Químicas del Ebro S.A.
(IQE) in Spain. Due to IQE productive activity, high amounts of waste streams with high salinity are
produced. Figure 1 presents the water cycle at IQE.

                          Figure 1. Water cycle in the production process at IQE.

Firstly, well water is extracted and pre-treated to be brought into a reverse osmosis (RO) system.
Osmotic water produced is then used into the production process where saline wastewater streams
are generated. Deliverable 4.1 from ZERO BRINE includes a deep characterization of the different
waste streams generated at IQE. Table 2 shows the composition of the main wastewater stream
generated at IQE.

Table 2. Characterization of the target aqueous waste streams. (n/a = not applicable; SD =standard
deviation; n=number of samples).

                                             Filtration + Washing wastewater (n=6)
              Parameter      Units       Value                      SD
              pH              upH         4.8                      1.3
              EC             mS/cm        27.3                     5.9
              Turbidity       NTU         67.4                     133
              Cl             mg/L        1,760                     498
              NO3            mg/L         11.8                     0.61
              SO4            mg/L        16,470                   4,450
              K              mg/L         434                       11
              Na             mg/L        7,320                    2,060
              Ca             mg/L         38.5                     35.3
              Mg             mg/L         213                      235

                                                                                                      8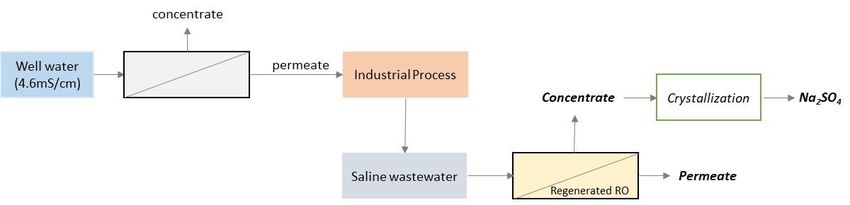
Filtration + Washing wastewater (n=6)
              TIC             mg/L
polyester. The membrane performance is determined by selectivity which is often calculated by the rejection coefficients and by the permeation rate given by the volume filtered by the membrane per area and time [2]. The performance of RO desalination membranes is dependent on the composition of the membrane, which determines main salt rejection, fouling susceptibility and water permeability [2]. RO membranes are roughly divided in seawater (SW-RO) and brackish water (BW-RO) membranes regarding their permeability and their salt rejection. SW-RO membranes present higher salt rejections than BW-RO but lower permeability. For both sorts of membranes, besides physical damage and compression during performance, the main reason that sets their lifespan is fouling, causing membranes to become waste. Membranes are replaced at the end-of-life stage, which is when their performance is not suitable for a specific task anymore, regarding permeability (
flowrate. Some of the methods that manufacturers recommend to hydrate membranes include
pressurization to 10bar with permeate valve closed, immersion in a solution of ethanol or propanol
in water at 50% or immersion in HCl at 1% [7]. Several authors indicated that the method with best
results, in terms of permeability, in the later regeneration is pre-soaking the dry aromatic polyamide
membranes in short-chain aliphatic alcohols [9] [10] [8].

Research on membrane regeneration started with removing the polyamide (PA) layer to achieve a
microfiltration membrane (MF). It is worth mentioning that membranes under study were previously
washed with bisulphite solution in recirculation for 18h, so membranes should be hydrated.
Conditions assessed involved different OA, concentration, exposure time and different methods of
contact. Oxidizing agents that gave best results were sodium hypochlorite (NaClO) and potassium
permanganate (KMnO4) when they were recirculated for 1-2 at 5-10bar. Newly obtained membranes
presented similar properties regarding MF membranes, with salt rejection almost zero and rejection
of suspended solids around 97% [11] [12]. Other authors have tested the same OA further. For
example, these three OA were tested at different doses (in ppm·h), so the concentration of OA
remained constant whilst the exposure time varied. A higher concentration can contribute to reduce
the amount of time required for the degradation but most importantly it is crucial for controlling the
degrading process. According to the state-of-art, NaOCl gave the best results in terms of an increase
of permeability (4-175 L/m2·h·bar) and decrease of rejection (>4%) in all studied cases [13] [14] [8].
Besides the three presented OA, other reagents such as acetone or N-methyl-2-pyrrolidone (NMP)
have been tested but did not give better results [15]. The parameter of pH also needs to be
considered as chemical modifications is dependent on the pH. Studies show that when comparing
different pH conditions (pH 3, 7 and 10.5), alkaline conditions give the highest increase in
permeability [13] [15]. Acid pH could lead to hydrolysis of the PA active layer and therefore oxidation
processes not be favorable.

Thus, the choice of the best operation conditions relies on the targeted properties of the recycled
membrane which is, actually, tailor-made.

    b. Tailor-made membranes properties
In ZERO BRINE project, regenerated membranes will be used to treat wastewater from a silica
industry (IQE) which has a high conductivity. The properties of the regenerated membranes will be
set in order to produce a permeate with a suitable quality to be reused and reducing the working
pressure of the RO process.

Permeate obtained from the RO treatment using these membranes will be reused at IQE. Depending
on the permeate composition (conductivity), different reuse strategies within the production process
can be considered as it can be seen in Figure 3 :

    -   Low conductivity, similar to permeate from RO used to treat well water: direct reuse.

                                                                                                     11
- Conductivity around 4.6 mS/cm, which is the conductivity of well water. In that case water
could be mixed with well water to be treated in the RO and/or used as washing water in the
production process.
concentrate
Well water Permeate
(4.6mS/cm) (osmotic water) Industrial Process
Concentrate Crystallization Na2SO4
Saline Permeate
wastewater (Water for reuse)
EC » osmotic water
EC » 4.6 mS/cm : mixed with
well water and/or washing water
Figure 3. Water cycle in the production process together with reuses of regenerated RO effluents.
Properties of the tailor-made membrane are given by the permeability and the rejection defined. An
increase of permeability will allow to reduce working pressure, and consequently the energy
consumption. On the other hand, rejection is defined taking into account the conductivity of the
wastewater used as feed for the regeneration membrane and the permeate conductivity. As already
stated in Deliverable D4.1, the wastewater from IQE has a conductivity around 27 mS/cm. Therefore,
to obtain a permeate with a conductivity lower than 4.0 mS/cm (well water), the minimum total salt
rejection measured in conductivity should be around 85%.
According the previous requirements, the targeted regenerated membrane should present the
following properties:
- Higher permeability than SW-RO membranes: its increase will allow to reduce working
pressure and energy consumption.
- Permeate quality adapted to the water uses at IQE. For that, a minimum rejection of 85% has
been defined.
Based in these properties two different tailor-made membranes will be produced in ZERO BRINE
project. In Table 3, rejection coefficients for these membranes and of commercial membranes of SW,
BW-RO and NF are showed. These values are based on sodium chloride (NaCl) rejection for SW and
BW membranes and on magnesium sulphate (MgSO4) for NF membranes. The rejection coefficients
described for commercial membranes will serve as guidance to compare properties of regenerated
membranes with the commercial.
Table 3. Permeability and salt rejection of commercial membranes.
Permeability (L/m2·h·bar) Rejection (%)
12Permeability (L/m2·h·bar) Rejection (%)
Commercial SW-ROa 1.98 > 99.7b
Commercial BW-ROa 2.81 > 99.0b
Commercial NFa 3.31 > 97.0c
Tailor-made membrane Type I >1.98 > 99.0
Tailor-made membrane Type II >3.31 > 85.0
a b c
commercial specifications for LG SW 440 GR, BW30-400 and NF270-400/34i; Rejection of NaCl; Rejection of MgSO4
As a result of the set properties of the tailor-made membrane, end-of-life SW-RO and BW-RO
membranes from desalination plants (little biofouling) are proper starting membranes to achieve our
target membrane. In this project, we aim to achieve two types of membranes to later evaluate their
performance with real effluent from IQE. Type I of these membranes is based on a permeability
between SW and RO membranes and a rejection similar to BW RO membranes. Type II is based on a
permeability above NF membranes with a rejection above 85%.
2. Objective
WP4 from ZERO BRINE project aims to demonstrate the technical and economic feasibility of
implementing a circular economy scheme in the silica industry (IQE) to recover water, sodium
sulphate, waste heat, acids and alkalis. In particular, in subtask 4.1.4 the regeneration process of
reverse osmosis membranes from desalination plants will be investigated in order to define the
regeneration conditions to obtain a tailor-made membrane which allows the recovery of water
(permeate) with a suitable quality to be reused at IQE production process.
In this context, the main objective of this report is to evaluate the regeneration process and to
optimize it to obtain specific membranes with tailor-made properties. These properties are defined
based on a reduction of energy consumption by requiring lower working pressure and on the
production of an effluent that can be reused in the production process (permeate).
Table 4 shows the target properties of the aimed tailor-made membranes. Type I membranes have a
permeability higher than commercial SW RO membranes and a rejection similar to BW RO
membranes (Table 3). Type II have a permeability higher than commercial NF membranes (Table 3)
and the rejection corresponds to the minimum rejection stablished by the possible water reuses at
IQE.
Table 4. Target properties of the tailor-made membranes.
Permeability Salt rejection
(L/m2·h·bar) (%)
Type I > 1.98 > 99.0
13Permeability Salt rejection
(L/m2·h·bar) (%)
Type II > 3.31 > 85.0
3. Regeneration methodology
To recover water with a quality suitable for its reuse in the production process of IQE (permeate),
regeneration process for SW and BW membranes has been investigated. It was also relevant to
achieve high permeability and lower pressure requirements so to save energy and time. Thus, the
aimed membranes had properties corresponding to membranes of Type I or II.
End-of-life SW-RO and BW-RO membranes were provided by two desalination plants located in Spain.
These membranes correspond to commercial SW-RO membranes fabricated by LG Chem and to
commercial BW-RO membranes fabricated by Dow Filmtec (Table 5).
Table 5. Specifications of the commercial SW-RO and BW-RO membrane used for regeneration.
Element model LG SW 440 GR BW30-400
Configuration 8-inch spiral wound 8-inch spiral wound
Thin-film nanocomposite (TFN) Thin-film nanocomposite (TFN)
Membrane polymer
polyamide polyamide
Permeate flow rate (m3/dia) 31.2 40.0
NaCl rejection (%) > 99.7 > 99.0
Active membrane area (m2) 41 37
c. Membranes characterization
Six end-of-life membranes were used for this task: one BW-RO and five SW-RO. The BW-RO
membrane was used at lab-scale and the SW-RO membranes: one at lab-scale and four at pilot plant
scale.
For each membrane a standard test was performed to assess its performance, allowing to compare
initial properties of delivered membranes with the properties of regenerated membranes. The
standard test used is showed in (Table 6). This test consisted in assessing and comparing the
permeability and the rejection of NaCl at the standard conditions.
Table 6. Standard test conditions and expected permeability and salt rejection.
Standard conditions for membrane evaluation
NaCl solution (ppm) 1500
Pressure (bar) 16
Recovery (%) 15
Temperature (ºC) 25
14Standard conditions for membrane evaluation
Commercial BWa membrane permeability (L/m2.bar.h) 2.81
a
Commercial BW membrane NaCl rejection (%) > 99.0
Commercial SWb membrane permeability (L/m2.bar.h) 1.94
b
Commercial SW membrane NaCl rejection (%) > 99.7
a b
BW30-400, DOW Filmtec; LG SW 440 GR, LG Chem
This test was performed recirculating a dissolution containing 1500 ppm of NaCl, returning the
permeate and the concentrate to the feed tank. However, a modification of the standard test was
performed during pilot plant operation. Instead of setting a given recovery, a performance time was
established: 30min. Standard tests would run for 30 min and then membrane performance in terms
of recovery, permeability and rejection were measured.
Besides this test, a test to evaluate the rejection of sulphates was as well conducted The standard
method based on magnesium sulphate (MgSO4) which is the standard test for NF membranes is
presented in Table 7. The same methodology than NaCl test is used.
Table 7. Operating conditions of pilot plant for standard tests of NF.
Operating conditions – NF standard test
Mg2SO4 solution (ppm) 2,000
Pressure (bar) 16
Recovery (%) variable
Temperature (ºC) 25
Feed flux (m3/h) 8-10
Finally, in order to evaluate the membrane performance treating the wastewater from IQE, tests
using synthetic solution with similar composition of real wastewater were performed at laboratory
scale. The synthetic solution was composed of Na2SO4 at 24.4g/L and NaCl at 2.97g/L. pH was
adjusted with sodium hydroxide to pH 9 accordingly the pre-treatment conditions before reaching
the regenerated RO system, and that had been stablished to reduce scaling problems during RO
process. To evaluate the full performance of the produced membranes, first of all a P vs Q curve was
performed. Permeability (Q) is measured for each of the membranes at given pressures. Via this plot,
a starting working pressure to achieve 20 LMH (1.25 L/m2·bar·h) can be decided. During the full
experiment, this pressure was increased in time in order to maintain the permeate flux constant as
the feed got more concentrated due to recirculation of the concentrate.
d. Laboratory-scale regeneration
The overall methodology followed to obtain tailor-made membranes is presented in Figure 4.
15Figure 4. General methodology to regenerate membranes.
After assessing end-of-life membranes properties with the standard NaCl test, regeneration was
carried out. The process of regeneration was conducted in two steps: hydration and oxidation. Firstly,
the regeneration process was conducted in the lab with membrane coupons to evaluate the optimal
conditions to achieve a membrane that fulfils the aimed requirements by the silica factory. The effect
of each of the regenerating steps on the membranes was measured with the NaCl standard test for,
so permeability and rejection for NaCl were measured.
For experiments in a lab-scale, coupons of a membrane element are required to test membranes as
flat sheets. These coupons were achieved by cutting open one of each of the RO membranes so the
inner sheets of the element that form the spiral wound are accessible (Figure 5). Once opened,
coupons of membrane and carriers cut of the middle sheets (140 cm2) were cut to fit the testing cell
(Figure 7). The middle sheets were considered so to have representative coupons of the fouling of
the membrane, which is more abundant in the inner sheets and very little in the outer sheets.
Figure 5. BW-RO membrane element opened to access the membrane sheets.
i. Testing set-up (Spanish BEC BP-2)
The testing set-up for the evaluation of membrane performance is shown in Figure 7 and consisted of
a: testing cell (Figure 6), a thermostatic bath (DIGIT-COOL, HAAKE (EK20)) and a pump (Hydra-cell,
G03X).
The testing cell was made of stainless steel so it could resist pressure, which was regulated using a
needle valve at the concentrate, and it was continuously monitored by a pressure meter. To monitor
the flow of the feed a flowmeter was used. The set-up was all connected with a series of tubes,
16gauges and valves. This set-up was used for standard tests with NaCl and also for tests with synthetic
wastewater at higher recoveries.
Figure 6. Flat-sheet membrane module used for regenerated membrane tests.
Figure 7. Experimental set-up for membrane testing at lab-scale.
Standard tests (Table 6) were carried out at a working pressure of 16 bar for 30 minutes, permeate
was collected until a 15% of recovery. Recovery was monitored by a scale and the concentrate was
recirculated. The overall operating conditions are detailed in Table 8.
17Table 8. Operating conditions of the testing cell (flat-sheet membrane module) for standard tests of BW-RO.
Operating conditions – testing
cell
NaCl solution (ppm) 1500
Pressure (bar) 16
Recovery (%) 15
Temperature (ºC) 25
Feed flux (L/min) 1.0
Cross-flow velocity (m/s) 0.27
Besides, standard NaCl tests, tests with synthetic solution, based on assessing the membrane
performance at maximum recovery, were conducted.
For all tests, permeability was calculated by the time needed to reach the set recovery and it was
expressed as L/m2·h·bar. Salt rejection was determined by conductivity differences between the feed
and the permeate and it was expressed as a percentage.
ii. Regeneration set-up (Spanish BEC-BP-12)
The process of membrane regeneration consisted in two different steps: hydration and oxidation.
Regeneration study involved the evaluation of the membrane performance under the effect of:
different hydrating solvents, different concentrations of the OA, different oxidative doses and pH
(Table 9).
Table 9. Description of the tested conditions during regeneration studies.
Parameters tested Conditions
Hydrating solvents Distilled water, H-1 and H-2
Concentration of OA (ppm) C1, C2, C3
Doses of OA (ppm·h) 1,000, 2,000, 4,000, 6,000, 7,000, 10,000
pH (upH) 5.0, 6.5, 9.0, 12
Three different solvents were assessed for their hydrating properties of end-of-life RO membranes.
One of the solvents was distilled water and due to confidentiality matters, hereafter we will name
the other two hydrating solvents H-1 and H-2. The hydrating process was passive, so the membrane
coupon was immersed in the corresponding solvent: 24 hours in distilled water, 15 minutes in H-1
and 48 hours in H-2. After each hydrating process, a standard test was conducted to evaluate its
effect on permeability and rejection of the membrane coupon.
After the hydrating process, membranes were oxidized by an oxidative agent (OA) to increase their
permeability and obtain the desired salt rejection. The oxidizing process involved a decrease on the
salt rejection which was the limiting parameter that set the end of oxidizing doses. To oxidize, a
similar cell as the testing cell was used (Figure 8) although this one was made of methacrylate to
18prevent its degradation by the OA. This process consisted in recirculating with a peristaltic pump the
oxidative solution on the active layer of the membrane, so the layer made of polyamide. The
recirculation was carried out during set periods of times which were given by the dose (ppm·h) under
study and the used concentration of oxidative agent. As well as for hydration, after each oxidative
step, a standard test was carried out on the coupon to evaluate the effect of oxidation on its
performance.
Figure 8. Experimental set-up for oxidizing the membrane at lab-scale.
e. Pilot plant-scale regeneration
As mentioned above, the sub-objective of experimentation by pilot plant is to obtain membranes
with properties of Type I and Type II. The pilot plant is meant to provide elements with the suitable
properties that can be transported to the silica factory for further use in this project.
Once the optimal lab-scale conditions to produce Type I and II membranes were defined,
regeneration at pilot scale was evaluated (Figure 4). At pilot plant scale, as in lab-scale, hydration was
combined with oxidation of the membrane elements in a sequential way in order to find the most
optimal regeneration conditions. For other two elements, the effect of no hydration was assessed.
The used methodology is the same as at lab-scale (Figure 4). Tests on regenerated membrane
performance with real effluent are going to be carried out at the site.
To evaluate membrane regeneration process at pilot scale two equipment have been used: one for
hydrating and one to carry out the oxidation of the membrane.
iii. Equipment to carry out hydration
To hydrate membrane elements, two different methodologies were followed. One consisted on
immersing the element in H-1 during 48h and the other one to recirculate H-1 during 4h with a
peristaltic pump. For both methodologies, elements were placed into a PVC case (Figure 9) with an
exit valve on the bottom.
19Figure 9. PVC case for membrane elements to be hydrated.
iv. Pilot plant for testing and oxidizing
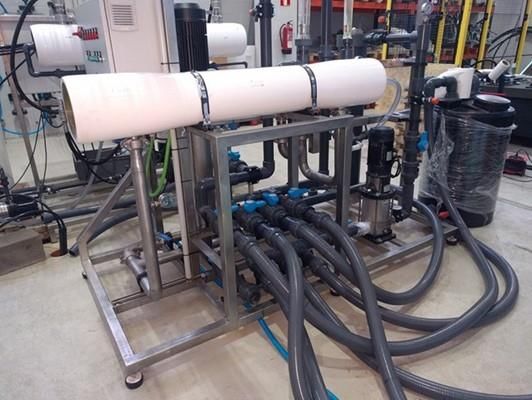
A pilot plant has been constructed (BEC-BP-10) to produce regenerated membrane modules. It
consisted mainly of a pressure tube for reverse osmosis membranes type 8040, a low pressure pump
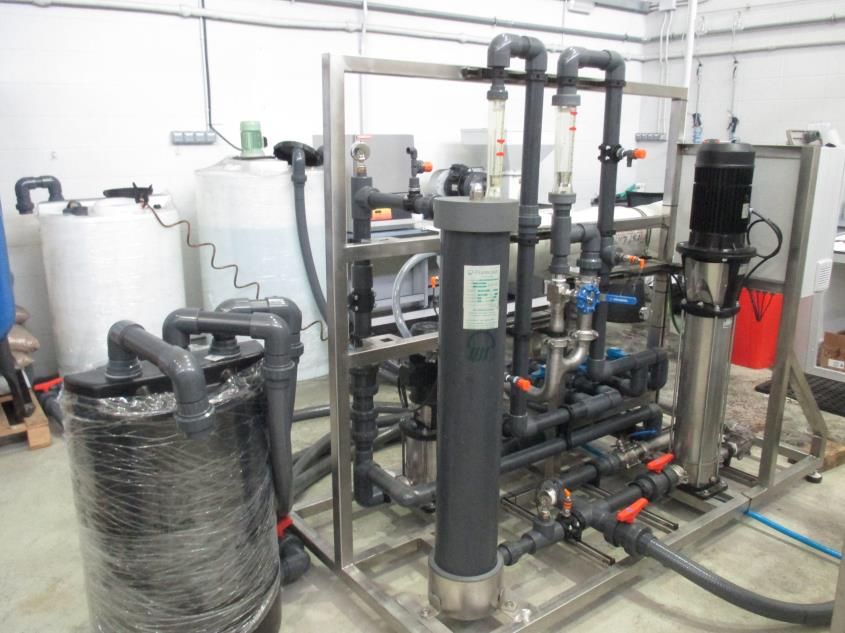
and a high pressure pump. Figure 10 presents a 3-D model of the pilot plant, Figure 11 shows pictures
of the pilot plant in reality and in Table 10 the different components are summarized.
Figure 10. 3-D model of the pilot plant used for oxidation and tests on membrane performance.
The constructed pilot plant can be used to test membranes and to regenerate membranes by
recirculation the oxidizing solution. As it can be seen in Table 10, the pilot plant has 3 feed tanks: one
tank of 1,000L, which contains the solution to make the different brine test; another one tank of
500L, which contains water to perform the different flushing operations and the last one of 250L,
which contains the oxidizing solution. Once the feed has been selected (opening/closing the different
valves) the effluent enters the system by first passing through the low pressure pump, then by the
20safety filter (to avoid that possible external agents could damage the membrane), then by the high
pressure pump and finally by the reverse osmosis module. The evaluation of the membrane
performance can be regulated by the manometers installed as well as by monitoring flux of the feed,
permeate and concentrate together with their conductivity.
Table 10. Relation of the equipment of the pilot plant to oxidize the membranes.
Element Description Element Description
1 First concentrate 11 Maximum concentrate pressure sensor 1
2 Second concentrate 12 Maximum concentrate pressure sensor 2
3 First permeate 13 Valve
4 Second permeate 14 Bypass valve high pressure pump
5 Recirculation 15 Permeate flowmeter
6 First feed 16 Concentrate flowmeter
7 Second feed 17 Filter
8 Third feed 18 High pressure pump
9 Minimum feed pressure sensor 19 Pressure tub for reverse osmosis
10 Maximum permeate pressure sensor 20 Low pressure pump
21Figure 11. Pictures of the regeneration pilot plant used for oxidation and tests on membrane performance.
Oxidation procedure
In the same way that in the experimentation at laboratory scale, to perform an oxidation or a
standard test, a flushing with water is performed to drag possible precipitated agents and to clean
the membrane.
Regeneration was carried out by the low pressure pump (4 bar) whereas the high pressure pump was
dodged to avoid possible corrosion damage within the pump. However, when a NaCl or MgSO4
standard test was being carried out, the plant was operated at 16 bars using the high pressure pump.
To oxidize, OA at C2 was recirculated continuously with the low pressure pump and dodging the high
pressure pump for a certain time. In the first 15 minutes of each regeneration was taken a sample of
the solution to verify that the concentration continues to be established initially. In case a
22concentration decrease, the concentration is readjusted to maintain the concentration fixed (if the
concentration was less than 75% of the established past the first 15 minutes, within 30 minutes of
starting the test the concentration was re-checked and readjusted if necessary). At the end of each
regeneration, the OA concentration was re-measured to ensure proper oxidation in the specified
conditions.
f. Analytical determinations
To evaluate the membrane performance, the analytical methods described in Table 11 were used.
Table 11. Description of the used analytical methods.
Parameter Equipment Standard/Method
pH pHmeter, Crison GLP 22 ISO10523:2008
Conductivity Conductimeter, Crison MM41 UNE EN 27888:1994
Cations (K, Na, Ca, Mg) Aquion, Dionex Ionic Chromatography
Anions (Cl, NO3, SO4) ICS 2100, Dionex Ionic Chromatography
4. Regeneration results
a. End-of-life membranes characterization
End-of-life received membrane elements of SW-RO and BW-RO were tested with the NaCl standard
test to evaluate its performance. Tests were performed using an existing pilot plant property of CTM
(BEC-BP3) as when membranes were received the regeneration plant was not constructed yet.
In Table 12, results from the tests performed to end-of-life SW-RO membranes modules are
presented as well as a test with a brand new membrane of the same model. In addition,
specifications from commercial membranes are showed also for its comparison. BW-RO elements
were not tested at pilot scale.
Table 12. Comparison of the performance of end-of-life SW-RO membranes with commercial membranes at
pilot-scale.
Permeability Rejection
(L/m2·h·bar) NaCl (%)
SW-E1a 0.64 99.8
SW-E2a 0.71 99.7
SW-E3a 0.73 99.7
23Permeability Rejection
(L/m2·h·bar) NaCl (%)
SW-E4a 0.82 99.7
SW-E5a 0.75 99.8
New SW-ROa 1.60 99.7
Commercial SW-ROb 1.98 > 99.7
a b
used in pilot plant test, n=1; commercial specifications for LG SW 440 GR
As it can be seen, the tested end-of-life elements (coded as SW-EX) presented a lower performance
comparing to the one of their corresponding commercial membranes. The acquired new SW-RO
element and the commercial specifications differ slightly although rejection remains the same.
Elements of end-of-life SW-RO tested have more than 50% difference in permeability from
commercial membranes but rejection is similar.
An end-of-life BW-RO membrane together with the SW-E1 module were cut open in order to obtain
membrane coupons. Two different sorts of coupons were then tested in order to evaluate the effect
of regeneration for each sort. Standard tests with NaCl were conducted to several coupons of each
sort to assess the membrane properties. Results are shown in Table 13.
Table 13. Evaluation of end-of-life SW and BW coupons at lab-scale.
Permeability Rejection
2
(L/m ·h·bar) NaCl (%)
End-of-life BW-ROa 0.33 ± 0.06 93 ± 1
End-of-life SW-E1a 0.99 ± 0.14 93 ± 4
Commercial SW-ROb 1.98 > 99.7
Commercial BW-ROb 2.81 > 99.0
Commercial NFb 3.31 > 97.0
a b
used at lab-scale, n=3; commercial specifications for LG SW 440 GR, BW30-400 and NF270-400/34i.
End-of-life BW-RO coupon presents 80% difference in permeability from a commercial membrane
and around 6% difference in rejection. This fact indicates a relevant effect of the fouling on the
membrane performance.
Regarding end-of-life SW-RO membranes tested in the lab and in the pilot plant present different
rejections of NaCl although permeability is the same. The difference in rejection can be explained by
distribution of the fouling in the element. The coupon tested in the lab corresponds to a fraction of a
sheet of the element and the membrane tested in the pilot plant is the whole element.
24b. Lab-scale regeneration
Regeneration at lab-scale was based on researching the optimal conditions in terms of hydration and
oxidation to apply to the end-of-life membranes (BW and SW) to obtain a membrane with the
properties defined in Table 4, suitable for IQE’s production.
Parameters assessed were hydration agents, pH, OA concentrations and OA doses. The coupon
obtained with the optimal regeneration conditions was used to treat synthetic wastewater with a
composition similar to the real effluent.
i. Effect of hydration
One of the causes of the low permeability obtained for end-of-life membranes is a low membrane
hydration. This hydration is based on making the polyamide chains (polymeric active layer) swallow
by creating van der Waals forces in-between these chains. End-of-life membranes, should be stored
maintaining hydration, but sometimes it is difficult. So, the first step to recover the permeability is
membrane hydration.
Effect of hydrating solvent
Three different solvents were used to hydrate the membrane: distilled water, H-1 and H-2. The
hydration solvent effect was tested for both BW and SW membranes.
Figure 12 shows the effect of the hydrating solvents on the end-of-life BW-RO membrane.
Figure 12. Effect of the hydrating solvents on end-of-life BW-RO at lab-scale (n=1).
In terms of increase of permeability and rejection, solvent H-1 gave the best results, increasing the
permeability of end-of-life membrane more than 4-fold. Solvent H-2 also increase the permeability
but only a 20% more, while rejection is increased 2%. Distilled water had not significant effect on
25permeability and rejection. In any case, permeability is lower than the corresponding to commercial
BW-RO (2.81 L/m2·h·bar).
Figure 13 shows the effect of the hydrating agent on performance of SW-RO membranes. As in the
case of BW-RO membranes, H-1 is the solvent that provides the highest hydration to the membrane
whereas distilled water and H-2 present similar hydration efficiency. Regarding these results,
hydrating solvent H-1 was chosen for later tests involving an oxidative agent.
Figure 13. Effect of the hydrating solvents on end-of-life SW-RO at lab-scale (n=1).
However, hydrated SW-RO coupons with H-1 did give similar results to commercial SW-RO (1.98
L/m2·h·bar). From the previous results it can be concluded that H-1 showed the best results for both
type of membranes. But the effect of water and H-2 is different depending on the membrane. This
could mean that the efficiency of water and H-2 will depend of the fouling and scaling in the
membranes.
Effect of hydration on the oxidative process
Once effect of different hydrating solvents was evaluated, the effect of hydration on the oxidation
was studied on BW-RO coupons. Figure 14 shows the resulting permeability and rejection of several
BW-RO coupons hydrated with two solvents H-1 and H-2 and oxidized at C2 of OA.
The tested solvents presented relevant differences in terms hydration, as detailed previously. During
oxidation, the difference still persisted and the effect of degrading the active layer is proportional to
the difference in hydration. Both types of coupons (H-1 and H-2) increased their permeability 2-fold.
Therefore, hydrating assisted on removing fouling and thus H-1 solvent was more efficient for the
tested membranes.
26Figure 14. Effect of hydrating solvents on oxidative process of end-of-life BW-RO coupons.
ii. Effect of pH
The effect of the pH was tested using coupons of a BW-RO element. The objective of the study was
to validate the information from state of the art that indicates basic pH favors the regeneration of
membranes over neutral or acid pH [15].
Four different pH (12, 9, 6.5 and 5) were tested during the oxidation of four coupons at the same OA
conditions (C1, 2000ppm·h). All the BW-RO coupons used for this test were first hydrated with H-1
before testing. Figure 15 presents the effect of the different pH on the regeneration process.
Figure 15. Effect of pH on the regeneration process of BW-RO coupons at lab-scale (n=1).
27As it was expected, basic pH gave the best results in terms of permeability and rejection increase of
the hydrated coupons, in particular pH 12. It can be observed, as well, that at pH 12 already Type II
membrane has been achieved. Acid pH resulted in lower permeability and rejection than hydrated
coupons. These could be explained by the chemical modification that acid conditions could bring to
the polyamide active layer which can make the polymer blocked to diffusion.
According the obtained results, all the other experiments where performed at pH 12 so to achieve
the best regenerating conditions.
iii. Effect of OA concentration
Concentration of OA renders effect on the kinetics of the oxidative process, therefore, two different
studies were conducted using BW-RO and SW-RO membranes respectively. For BW-RO coupons, 3
different OA concentrations (C1, C2 and C3) at the same dose, 2000ppm·h were tested. For SW-RO,
the study was focused on two concentrations of OA (C1 and C2).
Effect of OA concentration on end-of-life BW-RO coupons
Three concentrations C1, C2 and C3 were tested at the same dose, 2000ppm·h, to evaluate if the
kinetics of the oxidative process were affected. This study was carried out for BW-RO coupons and
performance of the modified coupons was conducted by NaCl standard test.
Figure 16 presents the effect of the three concentrations tested as well as the membrane
performance at its end-of-life and after hydration with H-1.
Figure 16. Effect of OA concentration on end-of-life BW-RO coupons (n=1)
For the three different OA concentrations, no effect on the rejection is observed, as it is the same
than the hydrated membrane. However, permeability is affected. The oxidative process increases
more than 2-fold permeability of membranes compared to hydrated membranes. Among
concentrations, and increase on OA concentration has a positive effect comparing C1 and C2,
permeability increases as the concentration increases. However, the difference between C2 and C3 is
28not relevant as the increase is around 0.3 L/m2·bar·h which could be with the error. Therefore, C2
was the chosen concentration in further experiments as it gives the maximum kinetic effect and the
minimum reagent consumption.
Effect of OA concentration on end-of-life SW-RO coupons
Coupons of end-of-life membrane SW-RO hydrated with H-1 (n=3) were thus put in contact with an
oxidizer so to chemically modify the active polymeric surface. Two different concentrations (C1 and
C2) of the oxidative agent (OA) were used at the same dose (2000ppm·h) to evaluate, with the
standard NaCl test, the effect of the OA concentration (kinetics). Figure 17 shows the properties of
SW membranes after regeneration at 2,000 ppm·h using different concentration of OA.
Figure 17. Effect of OA concentration on hydrated SW-RO membranes (n=3) using a dose of 2,000ppm·h.
It can be observed that oxidation resulted in an increase on permeability and in a decrease on
rejection on the two membranes tested at C1 and C2. The two different concentrations, they both
give similar results thus kinetics, in principle, is not influenced by the difference of these two
solutions. This fact is consistent with results obtained for BW-RO coupons, as there is a maximum
concentration that is kinetically more suitable as it consumes less reagent. In the case of BW, effect
of AO concentration is observed in arrange of concentration (C1 and C2). This fact is most likely
fouling-related as BW-RO membranes presented more fouling that implies also AO consumption.
Once membrane fouling is removed, no effect of the concentration is observed as in the case of SW-
RO becasuse the active layer to oxidize is the same organic polymer.
iv. Effect of dose
Concentration C2 was chosen for BW-RO and SW-RO to further oxidize the polyamide active layer of
the end-of-life membrane coupons. The effect of the dose was studied for the hydrating solvent H-1
at C2. Figure 18 presents the effect of doses on BW-RO coupons.
29Figure 18. Effect of OA doses on BW-RO coupons with two different hydrating solvents, H-1 (n=3).
After regeneration, these coupons achieve similar properties of Type II (3.31 L/m2·bar·h, > 97.0%) at
2,000ppm·h. The higher the dose of OA applied, the lower the rejection of NaCl is and the higher the
permeability. Thus, for our target, membranes hydrated BW-RO coupons with H-1 at 2,000ppm·h
with C2 are already suitable, moreover, this study provides data on how to develop other tailor-made
membranes with different targets than the production at IQE.
Effect of OA doses on SW-RO
To further optimize the regeneration process, SW-RO coupons were tested with three different doses
(2,000 ppm·h, 4,000 ppm·h and 6,000ppm·h) to membranes already hydrated with H-1. Figure 19
gives the results of the standard tests on the oxidized membranes. It is noticeable that doses of
2,000ppm·h and of 4,000ppm·h give membranes of Type I. Their permeability is close to the one of a
BW-RO (2.81 L/m2·bar·h) membrane although their rejection is lower (< 99.0%). The oxidizing dose of
6,000ppm·h leads to a membrane of Type II with a higher permeability than a NF membrane and very
similar rejection (3.31 L/m2·bar·h, >97.0%). For this project, membrane regenerated with a dose of
6,000ppm·h is optimal for the purpose at IQE regarding a high permeability and a sufficient rejection.
However, rejection is only measured with NaCl thus performance with synthetic water was
conducted.
30Figure 19. Effect of OA doses on SW-RO coupons (n=2) .
v. Optimal conditions for tailor-made membranes
To further produce tailor-made membranes, even though BW-RO coupons gave good performances,
end-of-life SW-RO were used due to their broader availability in the region. SW-RO coupons were
assessed with synthetic solution that is similar to the one at the silica factory IQE.
The hydrated coupon with H-1 was tested using synthetic wastewater to assess the performance in
terms of operational conditions and the resulting quality of both permeate and concentrate and
therefore conclude if the end-of-life membrane required further treatment. First of all, a P vs Q curve
was performed in order to select the working pressure. In Figure 20 curves performed with the
different coupons are presented.
Figure 20. P vs Q curves for the SW-RO regenerated membranes at lab-scale with synthetic water.
31Working pressure was selected in order to achieve a permeate flux of 20 LMH. For example, for
coupons regenerated at 6,000 ppm·h, the starting working pressure was 24 bar. This pressure
increased during time in order to maintain the permeate flux constant as the feed gets more
concentrated due to recirculation of the concentrate. Table 14 shows the results obtained by testing
the hydrated membrane and the oxidized membranes with the synthetic solution. At 71% of
recovery, the hydrated membrane provides a permeate with a conductivity of 0.75mS/cm, which is
lower than the maximum limit to be used in the silica factory (4.6 mS/cm). Therefore, the
performance of the membrane in terms of quality is satisfactory. However, as it has been explained it
is desirable reduce the working pressure to reduce the cost in terms of energy. Thus, an oxidative
treatment was assessed to achieve a membrane with satisfactory rejection, high permeability and
lower working pressure.
Thus, fully regenerated end-of-life SW-RO coupons were then assessed with the synthetic solution at
also 20LMH to evaluate the quality of the effluents as well as the pressure required (Table 14). All
three tests were performed at a recovery of around 75%, the maximum the system could afford.
Rejection decreased when membranes were more oxidized, however, the final conductivity of the
permeate was acceptable in all three cases as it is below 4.6mS/cm. Another tendency of the degree
of oxidation was the pressure requirement. The more oxidised the membrane was, lower are the
pressure requirements.
Table 14. Performance of one H-1 hydrated membrane with synthetic solution.
H-1 hydrated 2,000 4,000 6,000
membrane ppm·h ppm·h ppm·h
Feed flux (L/min) 1.0 1.0 1.0 1.0
Temperature (ºC) 25 25 25 25
2
Permeability (L/m ·h·bar) 1.25 1.25 1.25 1.25
Working pressure (bar) 38 38 24 20
Recovery (%) 71.0 75.1 75.9 74.6
Rejection in conductivity (%) 97.6 94.1 90.8 86.4
Final permeate conductivity (mS/cm) 0.75 1.80 2.82 4.18
Besides conductivity to evaluate rejection, it was important to assess the specific rejection for
chloride and sulphate (Table 15). Rejection of both anions decreases as the membrane oxidized status
increases. Chloride is smaller than sulphate; therefore, rejection is lower compared to the one of
sulphate.
Table 15. Removal of Cl and SO4 from the synthetic solution with oxidized membranes at different doses.
H-1 2000 ppm·h 4000 ppm·h 6000 ppm·h
n=1 SO4 Cl SO4 Cl SO4 Cl SO4
Cl (ppm)
(ppm) (ppm) (ppm) (ppm) (ppm) (ppm) (ppm)
Feed 1,768 16,435 1,768 16,435 1,768 16,435 1,768 16,435
32H-1 2000 ppm·h 4000 ppm·h 6000 ppm·h
n=1 SO4 Cl SO4 Cl SO4 Cl SO4
Cl (ppm)
(ppm) (ppm) (ppm) (ppm) (ppm) (ppm) (ppm)
Permeate 56.4 278.4 134.8 764.5 174.1 1,095 347.6 1,502
Concentrate 477 60,170 5,050 60,880 4,550 60,260 4,330 61,450
Rejection (%) 96.8 98.3 92.4 95.3 90.2 93.3 80.3 90.9
Therefore, lab-scale optimal conditions that produce a membrane that fulfil the requirements
established of permeability and rejection Type II were the oxidation of end-of-life SW-RO membrane
at a dose of 6,000ppm·h with a solution of OA at C2.
c. Pilot plant regeneration
Based on the results obtained in the laboratory, it was decided to regenerate SW-RO membrane
elements because of the availability to obtain SW-RO membranes in the region. The target was to
obtain 2 membranes with the properties defined for membranes Type I and Type II (Table 4).
i. Regenerated membranes: type I.
First, the hydration process was performed using the equipment showed in Figure 9. Two different
methodologies were conducted to evaluate the effect of the contact mode: immersion and
recirculation of H-1. In Table 16, test results from hydrated elements are showed.
Table 16. Effect of hydrating contact mode on end-of-life SW-RO elements
End-of-life Hyrated
Contact mode Permeability Rejection Permeability Rejection
(L/m2·h·bar) NaCl (%) (L/m2·h·bar) NaCl (%)
SW-RO-E2 Immersion 48h 0.6 99.8 1.3 99.8
SW-RO-E3 Recirculating 4h 0.9 99.8 1.1 99.8
As it was demonstrated at laboratory scale, hydrating the membrane elements improved the
membrane performance compared to end-of-life membranes in terms of permeability, while
hydration process has no effect on rejection. Regarding the hydration methodology, it can be
concluded that both methodologies gave the same results. Thus, the most efficient method is to
recirculate H-1 as it is less time consuming.
After hydrating, both membrane elements were oxidized with OA at C2 concentration. Different
doses were applied and NaCl standard test conducted until the regenerated membranes gave
permeability and rejection similar to Type I. Results from standard tests with NaCl for SW-RO-E2 are
shown in Figure 21. It can be observed that the increase on permeability from the element hydrated
to the element oxidized at 2,000ppm·h is negligible. However, for the rest of doses, as dose
increased, permeability increased although rejection remained constant. A Type I membrane was
considered to be achieved at 16,000 ppm·h.
33You can also read