Effect of Mean Velocity to Critical Velocity Ratios on Bed Topography and Incipient Motion in a Meandering Channel: Experimental Investigation ...
←
→
Page content transcription
If your browser does not render page correctly, please read the page content below

Preprints (www.preprints.org) | NOT PEER-REVIEWED | Posted: 8 February 2021                             doi:10.20944/preprints202102.0198.v1

     Article

          Effect of Mean Velocity to Critical Velocity Ratios on Bed
          Topography and Incipient Motion in a Meandering
          Channel: Experimental Investigation
     Nargess Moghaddassi 1, Seyed Habib Musavi-Jahromi 2,*, Mohammad Vaghefi 3 and Amir Khosrojerdi 4

                                       1 Ph.D. Student, Department of Water Engineering, Science and Research Branch, Islamic Azad University,
                                         Tehran, Iran; Email: nargess.moghaddassi@srbiau.ac.ir. ORCID: 0000-0002-6442-6380
                                       2 Emeritus Professor of Hydraulic Structures, Faculty of Water Sciences Engineering, Shahid Chamran Uni-

                                         versity of Ahwaz, Ahwaz, Iran; Email: h-mousavi@srbiau.ac.ir. ORCID: 0000-0002-9450-460X
                                       3 Associate Professor of Hydraulic Structures, Department of Civil Engineering, Persian Gulf University,

                                         Bushehr, Iran; Email: vaghefi@pgu.ac.ir. ORCID: 0000-0001-5862-915X
                                       4 Assistant Professor of Hydraulic Engineering, Department of Water Engineering, Science and Research

                                         Branch, Islamic Azad University, Tehran, Iran; Email: khosrojerdi@srbiau.ac.ir.
                                       * Correspondence: h-mousavi@srbiau.ac.ir; Tel.: +989127126513

                                       Abstract: As 180-degree meanders are observed in abundance in nature, a meandering channel with
                                       two consecutive 180-degree bends was designed and constructed to investigate bed topography
                                       variations. These two 180-degree mild bends are located between two upstream and downstream
                                       straight paths. In this study, different mean velocity to critical velocity ratios have been tested at the
                                       upstream straight path to determine the meander's incipient motion. To this end, bed topography
                                       variations along the meander and the downstream straight path were addressed for different mean
                                       velocity to critical velocity ratios. In addition, the upstream bend's effect on the downstream bend
                                       has been investigated. Results indicated that the maximum scour depth at the downstream bend
                                       has increased as a result of changing the mean velocity to critical velocity ratio from 0.8 to 0.84, 0.86,
                                       0.89, 0.92, 0.95, and 0.98 by respectively 1.5, 2.5, 5, 10, 12, and 26 times. Moreover, increasing the
                                       ratio increased the maximum sedimentary height by 3, 10, 23, 48, 49, and 56 times. The upstream
                                       bend's incipient motion was observed for the mean velocity to critical velocity ratio of 0.89, while
                                       the downstream bend was equal to 0.78.

                                       Keywords: 180-degree bend, Sediment transport, Clear water, Open-channels, Scour

                                       1. Introduction
                                            Seldom can rivers in nature be observed to be following a straight path, and they
                                       tend to flow in meandrous or braided patterns. The presence of meanders [1,2] in river
                                       paths is a factor involved in creating scour or sedimentation. On the other hand, hydro-
                                       dynamic forces are applied onto sediment particles on the river bed through the river
                                       path. An increase in flow velocity augments the hydrodynamic forces. Thus, if the flow
                                       force can overcome bed sediments' weight force, this process will result in sediment
                                       transport [3] and bed topography variations. As a result of the interaction between the
                                       longitudinal and secondary flows in bent paths and the generation of helical flows [4], the
                                       flow's force becomes more complex. This leads to more sediment transport than that oc-
                                       curring in upstream straight paths. Hence, studying and understanding sediment
                                       transport and sediment incipient motion mechanisms in bends require more investigation
                                       than straight channels.
                                            A great number of research studies have so far been conducted with regards to in-
                                       cipient motion in rivers due to its importance, and the following research works may be
                                       referred to as instances:

               © 2021 by the author(s). Distributed under a Creative Commons CC BY license.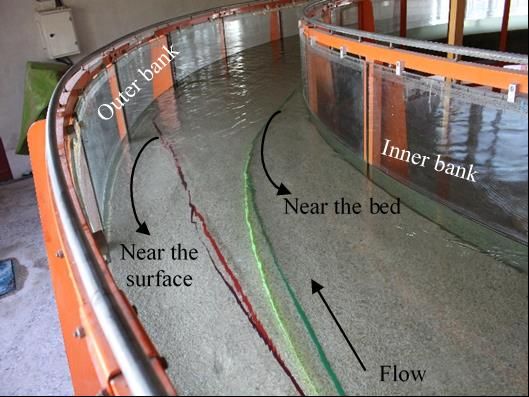
Preprints (www.preprints.org) | NOT PEER-REVIEWED | Posted: 8 February 2021                doi:10.20944/preprints202102.0198.v1

                                                                                                                        2 of 17

                                       Shields [5] defined the incipient motion based on the sediment transport rate. In-
                                 spired by the studies conducted by Shields, Dey and Papanicolaou [6] carried out ad-
                                 vanced studies to determine the incipient motion under the influence of a steady flow.
                                 Kramer [7] discussed the sediment incipient motion particles based on the apparent con-
                                 dition of particle motion. Bagnold [8] described the incipient motion based on the uplift
                                 force. Neill [9] defined the incipient motion based on the critical velocity. Lavelle and
                                 Mofjeld [10] examined the concept of critical stress under incipient motion conditions in
                                 a turbulent flow. The results obtained from their studies suggest that there is no specific
                                 definition of a process that leads to scouring because the researcher discerns the time and
                                 the extent of sediment transport as both effective and important, which can be enough to
                                 bring about much uncertainty about this phenomenon. Yen and Lee [11] investigated bed
                                 topography variations in a 180-degree mild bend under unsteady flow conditions. Their
                                 research refers to the significant effect of the secondary flow and velocity at the outer bend
                                 on bed topography variations. Dey and Debnath [12] evaluated the effect of bed slope on
                                 sediment particle motion. After analytical and experimental investigations and the appli-
                                 cation of different static angles for sediments, they concluded that the critical shear stress
                                 decreased with an increase in bed slope. Xu and Bai [13] conducted an empirical study on
                                 bed topography formation in alluvial and meandering rivers with different radii. To study
                                 the role of different sinusoidal shapes of the channels on the flow variations and the bed
                                 morphology in meandering rivers, they carried out their experiments in curved channels
                                 with fixed walls and movable bed. Mohtar [14] studied the effect of turbulent fluctuations
                                 and vortices on the sediment incipient motion. Their results implied a constant Shields
                                 parameter in the flow region having a rigid bed. Having addressed the flow velocity di-
                                 rection in meandering channels, Liu et al. [15] developed a model for calculating the mean
                                 2D flow velocity. Qin et al. [16] investigated the secondary flow effect on bed topography
                                 variations and cohesive sediment transport in Yangtze's meandering path. Azarisamani
                                 et al. [17] worked on the effect of rigid vegetation on bed topography variations and flow
                                 velocity in a meandering channel.
                                       Most studies on the incipient motion have so far been conducted in totally straight
                                 or single-bended paths, as noted above. Hence, the present work has addressed the effect
                                 of variations in the mean velocity (U) to critical velocity (Uc) ratios (U/Uc) [18] at the up-
                                 stream straight path on bed topography along the meandering channel (with two consec-
                                 utive 180-degree bends connecting two straight paths). Furthermore, the effect of the up-
                                 stream bend geometry on bed topography variations in the downstream bend and the
                                 influence of the downstream straight path on the upstream bend have been analyzed. De-
                                 termining the sediment incipient motion conditions in both bends were among the other
                                 highlights in this study.

                                 2. Materials and Methods
                                      In order to carry out the intended experiments in the laboratory, the meandering
                                 channel with two consecutive bends, as shown in Figure 1, was designed, implemented,
                                 and constructed for the first time in Iran [19]. This channel is composed of an 8-meter-long
                                 path upstream and one downstream, connected by two consecutive 180-degree bends
                                 with inner and outer radii of 3 and 4 meters. The channel wall is 80 cm high and 100 cm
                                 wide, and the ratio of the bend radius (R) to channel width (B) is equal to R/B=3.5. Accord-
                                 ing to the categorization developed by Leschziner and Rodi [20], this bend qualifies as a
                                 mild bend.
                                      As Raudkivi and Ettema [21] recommended, the mean particle diameter (d50) must
                                 be larger than 0.7 mm to prevent dunes formation [22]. Hence, the channel bed is covered
                                 with a 30-cm-thick layer of silica sand with d50=1.85 mm and a standard deviation of 1.2.
                                 Given the criterion suggested by Chiew [23], the tests were considered to run for 4 hours.
                                 To supply the required water to the channel, side reservoir tanks with a capacity of 30
                                 m^3 have been used. The discharge capacity produced by the pump system has been con-
                                 stantly 70 Lit/s when running the tests. The ultrasonic Aktek (Type: TFM3100-F1)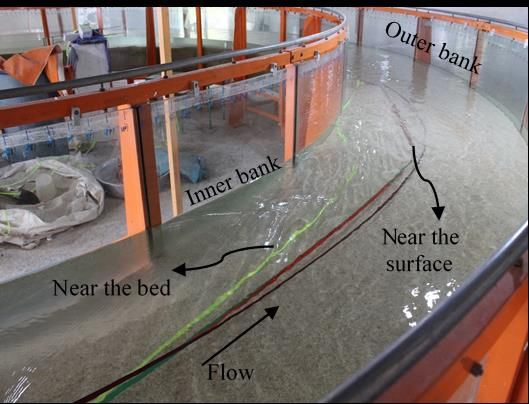
Preprints (www.preprints.org) | NOT PEER-REVIEWED | Posted: 8 February 2021                 doi:10.20944/preprints202102.0198.v1

                                                                                                                         3 of 17

                                    flowmeter with a precision of ±1% was utilized for determining the discharge. The flow
                                    depth at the upstream straight path was considered to range from 17 to 21.8 cm to provide
                                    flow velocity variations under incipient motion conditions. Mean velocity to critical ve-
                                    locity ratios (U/Uc) were determined from 0.75 to 0.98 at the upstream straight path, con-
                                    sidering the formula proposed in Neill [9] and a constant discharge. Therefore, the Froude
                                    number falls within the range of 0.22 to 0.31 and is subcritical in different tests.

          Figure 1. Schematic 3D view of the meandering channel.

                                          In these tests, the Leica laser bathometer (DISTO-D510) with a precision of 1 mm in
                                    200 meters has been used for bed topography data collection. The mesh grid for data col-
                                    lection covered the area from the beginning of the first bend to the end of the second bend
                                    at 1-cm intervals at the width and specific angles. Given the importance of data collection
                                    in the range of the connection between the two bends and their downstream area, smaller
                                    angles than the upstream path have been used for the mesh grid.

                                    3. Results

                                    3.1. Bed Topography Variations
                                         This section aims to provide the incipient motion for upstream and downstream
                                    bends regarding variations in U/Uc at the upstream straight path. Bed topography varia-
                                    tions in tests with U/Uc ranging from 0.75 to 0.86 have been presented in Figure 2. One
                                    important note considered here is the effect of the upstream bend geometry and the flow
                                    passing through it on bed topography variations at the downstream bend. As it may be
                                    observed in Figure 2-a (U/Uc=0.75), bed topography has remained unchanged from the
                                    beginning of the upstream bend to the end of the downstream bend. Neither of the bends
                                    has reached the incipient motion condition yet. In Figure 2-b, the onset of bed topography
                                    variations occurs at the downstream bend after changing U/Uc from 0.75 to 0.8. These
                                    variations reach a maximum within the range of 200 to 300 degrees, and sediment
                                    transport has been observed in groups of 5 to 20 particles. Moreover, the incipient motion
                                    at the downstream bend happened as U/Uc=0.78 at the straight path upstream. As shown
                                    in this figure, the maximum scour depth, equivalent to 0.32d 50 (0.6 cm), occurs at the 275-
                                    degree angle.
Preprints (www.preprints.org) | NOT PEER-REVIEWED | Posted: 8 February 2021                        doi:10.20944/preprints202102.0198.v1

                                                                                                                              4 of 17

                                       (a)                                                           (b)

                                       (c)                                                          (d)

          Figure 2. Bed topography variations for different U/Uc values: (a) 0.75, (b) 0.8, (c) 0.84, and (d) 0.86.

                                          The maximum sedimentation height has also been developed insignificantly at the
                                     200-degree angle. In Figure 2-c, the region with the maximum bed topography variations
                                     is observable from approximately the 195 to 300-degree angles following an increase in
                                     U/Uc from 0.8 to 0.84. The maximum scour depth and sedimentation height have occurred
                                     at 0.48d50 (0.9 cm) at the 275-degree angle and 0.32d50 (0.6 cm) at the 195-degree angle.
                                     With the increase in U/Uc from 0.8 to 0.84, there has been no significant change in bed
                                     topography at the upstream bend; however, the maximum scour depth and sedimentation
                                     height at the downstream bend have respectively increased by 1.5 and 3 times. The max-
                                     imum scour occurs at mid-channel in the 275-degree cross-section, and the maximum sed-
                                     imentation is observed at a distance of 5% of the inner bend around the 195-degree angle.
                                     As it may be observed in Figure 2-d (U/Uc=0.86), the secondary flow strength at the up-
                                     stream bend is not high enough to alter bed topography, yet bed topography variations
                                     are evident from 200 to 300 degrees. The maximum scour and sedimentation have also
                                     occurred for 0.8d50 at 275 degrees and 1.14d50 at 200 degrees. In fact, by increasing the
                                     U/Uc range of 0.84-0.86, there has been an increase of 1.5 and 3.5 times in the maximum
                                     scour and sedimentation, respectively. The flow velocity has grown at the downstream
                                     bend given the decline in the water height under the downstream straight path's effect.
                                     Hence, bed topography undergoes some changes. The flow at the upstream bend is di-
                                     rected towards the inner bank in the first half. When the flow reaches the second half of
                                     the bend, it is diverted first towards mid-channel and then towards the outer bank. With
                                     the augmentation of the secondary flow strength at the sections towards the end of the
                                     upstream bend, the scour onset also spreads to the beginning of the downstream bend for
                                     this U/Uc. There has been a conversion at the junction between the two bends. Therefore,
                                     the outer bank at the upstream bend has become the inner bank at the downstream bend,
                                     which causes a change of directions in the secondary flows.
                                          A comparison between different conditions illustrated in Figure 2 suggests that the
                                     maximum sedimentation height for each of these cases has occurred from 195 to 200 de-
                                     grees at a distance equal to 5% of the inner bank's channel width. This may be attributed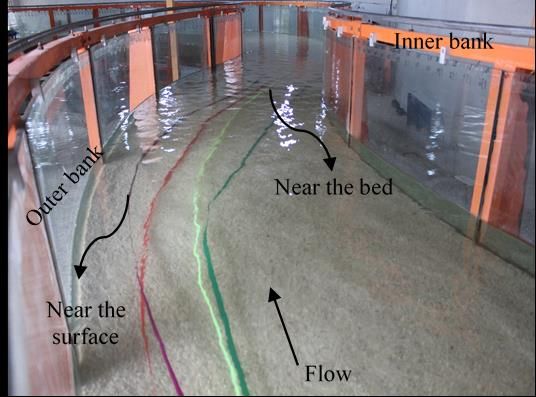
Preprints (www.preprints.org) | NOT PEER-REVIEWED | Posted: 8 February 2021               doi:10.20944/preprints202102.0198.v1

                                                                                                                       5 of 17

                                 to the sediment transport's direction towards the inner bank under the secondary flow
                                 pattern's influence. Furthermore, considering the secondary flow direction, the flow’s
                                 shedding over the sediments, and the generation of a downflow, the maximum scour has
                                 occurred in the second half of the downstream bend around the 275-degree angle and
                                 mid-channel in every test.
                                       Bed topography variations have been shown in Figure 3 in tests with U/Uc values
                                 ranging from 0.89 to 0.98. As shown in Figure 3-a (U/Uc=0.89), the secondary flow strength
                                 in the first half of the upstream bend is not high enough to cause a change in bed topog-
                                 raphy. On the other hand, the variations occur trivially in the second half of the bend from
                                 170 to 180 degrees at the outer bank so that the maximum scour depth, 0.8 cm, has oc-
                                 curred at the 180-degree angle. This can be taken as the incipient motion condition de-
                                 scribed at the upstream bend in the meandering channel. In other words, when U/Uc is
                                 0.89 at the upstream straight path, the first bend hosts the incipient motion condition. The
                                 upstream bend's effect on the downstream bend is mainly due to an increase in the sec-
                                 ondary flow strength, which breeds variations in topography, clearly observable at the
                                 downstream bend. Hence, bed topography variations at the downstream bend have
                                 reached a maximum from 200 to 300 degrees, and the maximum scour depth, equivalent
                                 to 1.62d50 (3 cm), has occurred at the 275-degree angle. The maximum sedimentation
                                 height, equivalent to 2.5d50 (4.6 cm), has also been realized at the 200-degree angle. More-
                                 over, increasing U/Uc from 0.86 to 0.89 has doubled the maximum scour depth and sedi-
                                 mentation height. In Figure 3-b, the bed topography remains unchanged at the first half
                                 of the upstream bend, but more changes are observed in the second half at the outer bank
                                 from 170 to 180 degrees. The flow and scour patterns hitherto described suggest a resem-
                                 blance between the results of this work and those of other researchers [13,24] in a small-
                                 scale laboratory model of a meandering channel. As shown in this figure, the maximum
                                 scour depth, equivalent to 1.84d50 (3.4 cm), has occurred at the 180-degree angle. Further,
                                 a 3.4% increase in U/Uc has also raised the maximum scour depth at the end of the outer
                                 bend at the upstream bend by approximately a factor of 4. In addition, the largest bed
                                 topography variations at the downstream bend have occurred within the range of 200 to
                                 300 degrees, where the maximum scour depth, equal to 3.24d50 (6 cm), has been developed
                                 at the 190-degree angle. In this case, the maximum sedimentation height, equal to 5.2d50
                                 (9.6 cm), was observed at the 220-degree angle. On the other hand, an increase in U/Uc at
                                 the upstream straight path resulted in doubled values of the maximum scour depth and
                                 sedimentation height reported. In Figure 3-c (U/Uc=0.95), the entrance of the flow into the
                                 first bend has led to insignificant variations in bed topography at the first half of the up-
                                 stream bend, while it has created scour at the second half of the bend from 170 to 180
                                 degrees at the outer bank. The maximum scour depth, equal to 1.9d 50 (3.5 cm), has oc-
                                 curred at the 180-degree angle. As with the previous cases, the maximum bed topography
                                 variations at the downstream bend have occurred from 200 to 300 degrees. This region
                                 hosts the greatest secondary flow strength and the influence of the helical flow in the bend.
                                 Such a strong flow stems from the helical flow present inside the downstream bend itself,
                                 and its excessive increase is a consequence of the upstream bend geometry’s affecting the
                                 downstream bend. Here, the maximum scour depth and sedimentation height, respec-
                                 tively equal to 3.9d50 and 5.3d50 (corresponding to 7.2 cm and 9.8 cm), have occurred at 195
                                 and 225 degrees. Considering the explanations provided in this figure, it can be concluded
                                 that increasing U/Uc has not increased the maximum scour depth at the upstream bend
                                 and the maximum sedimentation height at the downstream bend. On the other hand, the
                                 maximum scour depth at the downstream bend has been developed by 1.2 times at a dis-
                                 tance of 5 to 10 degrees from the beginning of the bend under the influence of the shift in
                                 the flow direction at the junction of the two bends.
                                       A comparison of bed topography variations in a single 180-degree sharp bend for
                                 R/B=2 and U/Uc=0.96 in an experimental study by Vaghefi et al. [25] and a numerical study
                                 by Asadollahi et al. [26] with the results observed at the downstream bend in Figure 3-c
                                 was made.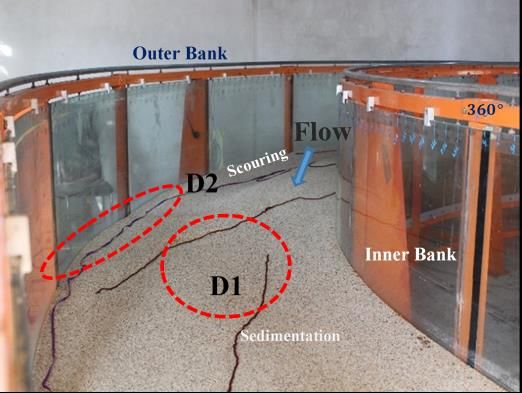
Preprints (www.preprints.org) | NOT PEER-REVIEWED | Posted: 8 February 2021                        doi:10.20944/preprints202102.0198.v1

                                                                                                                              6 of 17

                                      (a)                                                           (b)

                                       (c)                                                          (d)

          Figure 3. Bed topography variations for different U/Uc values: (a) 0.89, (b) 0.92, (c) 0.95, and (d) 0.98.

                                          The results of this comparison indicate that in both channels, whether with sharp or
                                     with mild bends, sedimentation begins at the inner bends from approximately 30 degrees.
                                     In the present study, given the use of mild bends, there are trivial variations of sedimen-
                                     tation observed at the upstream bend's inner wall. Still, the intensity of sedimentation is
                                     greater in a sharp bend. Besides, an investigation of the scour pattern at the downstream
                                     meandering bend in comparison with the 180-degree sharp bend refers to the resemblance
                                     of the scour pattern in the middle of the bend in both cases; however, the maximum scour
                                     at the 180-degree sharp bend occurs from 40 to 80 degrees, whereas that in the meandering
                                     channel has occurred at the 190-degree angle in the vicinity of the inner wall under the
                                     influence of the flows approaching from the upstream bend. These observations are also
                                     in line with investigations of Termini [24] in a meandering channel with consecutive
                                     bends on the maximum scour, which occurred at the second inner bend downstream.
                                          In Figure 3-d (U/Uc=0.98), illustrating the bed materials incipient motion at the up-
                                     stream straight path, it may be observed that the flow velocity and strength have risen.
                                     Moreover, given the streamlines at the bed, extended from the outer bank towards the
                                     inner bank, the inner bank at the first half of the bend first undergoes sedimentation, but
                                     the sedimentation variations in the first half are trivial since the bend is mild. As the sec-
                                     ondary flow in the second half of the upstream bend is directed towards the outer bank,
                                     as with the previous cases, the maximum scour has occurred at the outer bank between
                                     170 and 180 degrees. The maximum scour depth, equal to 6.5d 50 (12.1 cm), was found at
                                     the 178-degree angle. Bed topography variations at the downstream bend also reached the
                                     maximum between 200 and 300 degrees; the maximum scour depth and sedimentation
                                     height, separately equal to 8.5d50 and 6.05d50 (15.8 and 11.2 cm), have respectively occurred
                                     at 195 and 240 degrees. A comparison between Figures 3-c and 3-d indicates that for a
                                     change in U/Uc from 0.95 to 0.98, the maximum scour depth at the upstream bend has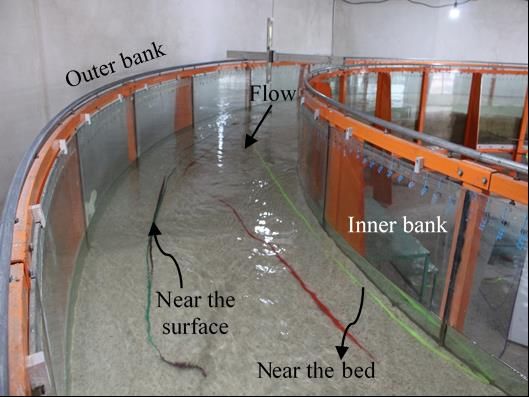
Preprints (www.preprints.org) | NOT PEER-REVIEWED | Posted: 8 February 2021              doi:10.20944/preprints202102.0198.v1

                                                                                                                     7 of 17

                                 increased by 3.5 times. Also, at the downstream bend, the maximum scour depth and sed-
                                 imentation height have respectively increased by 2.2 and 1.1 times.
                                       In general, a comparison made between different cases presented in Figure 3 suggests
                                 that a decline in the water level and an increase in velocity have happened given the
                                 straight downstream path's effect and its effect on the meander (particularly on the second
                                 half of it). This has entailed further bed topography variations at the downstream bend,
                                 more specifically at the second half. Also, the downstream bend functioned as an obstacle
                                 against the flow present at the upstream bend. Such behavior has resulted in fewer bed
                                 topography variations observed at the upstream bend than those at the downstream bend.
                                 A review of the general bed topography variations illustrated in Figures 2 and 3 explains
                                 why the maximum scour occurred at a distance of 5% from the outer bank between 178
                                 and 180 degrees for every U/Uc value at the upstream bend. The maximum scour location
                                 at the downstream bend has changed due to the influence of the upstream bend on the
                                 downstream bend and the increase in its velocity. As observed, from U/Uc=0.8 to
                                 U/Uc=0.89, the maximum scour has occurred at distances of 30 to 40% of the channel width
                                 between 270 and 275-degree angles, whereas from U/Uc=0.92 to U/Uc=0.98, the maximum
                                 scour has occurred at a distance of 5% from the inner bank between 185 and 195-degree
                                 angles. Furthermore, since the flow in the first half of the downstream bend is directed
                                 towards the inner bank, the maximum sedimentation volume has also occurred at a dis-
                                 tance from 0 to 5% of channel width from the inner bank for all cases. Increasing U/Uc
                                 from 0.8 to 0.98 has changed the location of the maximum sedimentation volume from 195
                                 to 245-degree angles.
                                       Figure 4 has illustrated camera photos of bed topography variations in the laboratory
                                 for U/Uc=0.98. Figure 4-a depicts the tail area of the first upstream bend and the second
                                 downstream bend entrance up to the 235-degree angle. As it can be observed here, the
                                 scouring has occurred from the 165-degree angle at the tail area of the upstream bend to
                                 the junction between the two bends (area A1). It has continued to the 200-degree angle at
                                 the downstream inner bend entrance in area A2 (similar to the trend described in Figure
                                 3-d). The scour has oriented towards the middle of the bend from the 195-degree angle.
                                 The scour at the downstream inner bend has continued to the 210-degree angle, after
                                 which sedimentation is observed (A3). There are also no variations observed in the vicin-
                                 ity of the downstream outer bend (A4). In Figure 4-b, bed topography variations in the
                                 first half of the downstream inner bend indicate sedimentation in area B1 from 217 to 280
                                 degrees, while there is scour observed at mid-channel (B2). Area B3, near the outer bend,
                                 is still unchanged. Figure 4-c has illustrated topography variations from 250 to 310 de-
                                 grees. Area C1, near the downstream inner bank, has undergone sedimentation, while
                                 area C2 in the middle of the bend is scoured. Sedimentation near the inner bend has ori-
                                 ented towards mid-channel from the 255-degree angle. In area C3, there are no identifiable
                                 variations in topography to the 290-degree angle; however, the shift in the flow direction
                                 at the 300-degree angle towards the outer bend entails scouring in this area. Figure 4-d
                                 depicts bed variations from 300 to 360-degree angles of the downstream bend. In area D1,
                                 near the inner bank, there are sedimentary stacks observed with an orientation towards
                                 the middle of the bend, and in area D2, scouring is found at the outer bend. As shown in
                                 these figures, the observations recorded about bed topography variations in the meander-
                                 ing channel in the laboratory are completely in line with the descriptions provided in Fig-
                                 ure 3, particularly for U/Uc=0.98 in Figure 3-d.
                                       Table 1 has presented the amount of increase in the maximum scour and sedimenta-
                                 tion values and the increase in the volume of sediment output at upstream and down-
                                 stream bends for different ratios of U/Uc. There are various methods for calculating the
                                 sediment output volume, among which hydrography datasets and bathymetry data may
                                 be mentioned. Moreover, the application of different software programs, such as HEC-
                                 RAS, GSTARS3, Mike21, and Tecplot 360 [27], is one of the prevalent methods of calculat-
                                 ing sediment volume. In this study, Tecplot 360 has been used for calculating the volume
                                 of sediment output. To this end, the collected data have been inserted into the software,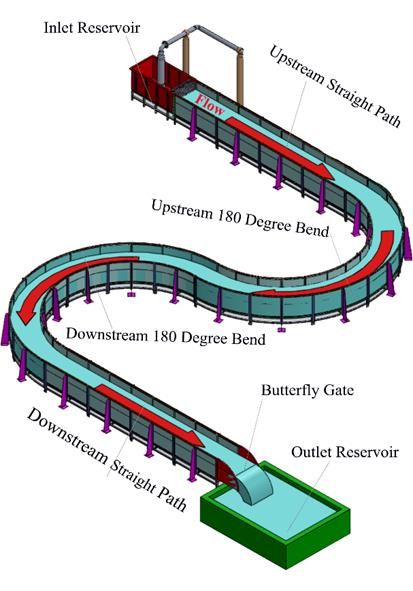
Preprints (www.preprints.org) | NOT PEER-REVIEWED | Posted: 8 February 2021                    doi:10.20944/preprints202102.0198.v1

                                                                                                                             8 of 17

                                    and after drawing bed topography, the volume of the sediments has been calculated using
                                    the integration command.
                                          With this table taken into consideration, with an increase in U/Uc value from 0.89 to
                                    0.92, 0.95, and 0.98, the volume of sediment output from the bend has increased by 38, 46,
                                    and 75 times respectively at the upstream bend. As shown here, the greatest variations
                                    related to the increased volume of the sediment output in both upstream and downstream
                                    bends occurs in the last case, where U/Uc=0.98 (which is the incipient motion of sediments
                                    on the upstream straight path). This can be attributed to the increase in the strength of
                                    eddies in this case.

                                      (a)                                                          (b)

                                    (c)                                                           (d)

          Figure 4. Instances of bed topography variations in the laboratory for U/Uc=0.98 between (a) 165 and 235, (b) 217 and
          280, (c) 250 and 310, and (d) 300 and 360 degrees.

                                    3.2. Lateral Bed Profiles Variations
                                         Figure 5 has illustrated variations in different lateral bed profiles from the beginning
                                    to the end of the upstream bend at 45, 90, 135, and 180-degree angles. A comparison be-
                                    tween Figures 5-a, 5-b, and 5-c indicates that variations at the upstream bend have been
                                    highly insignificant, and only scour hole formation has been observed at the outer bend
                                    area, as in Figure 5-d. In Figure 5-d, approaching the end of the bend, the flow is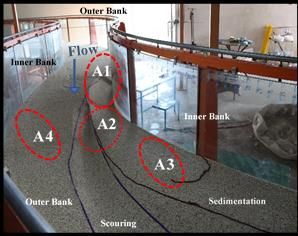
Preprints (www.preprints.org) | NOT PEER-REVIEWED | Posted: 8 February 2021              doi:10.20944/preprints202102.0198.v1

                                                                                                                      9 of 17

                                 influenced by the downstream bend, and the bed topography variations have decreased
                                 at mid-channel. An increase in U/Uc from 0.75 to 0.86 has entailed trivial changes in bed
                                 topography at the upstream bend. As the flow is oriented towards the outer bank in the
                                 second half of the bend, increasing U/Uc from 0.89 to 0.98 causes scour hole formation
                                 from 0 to 40% of the channel width from the outer bend. The variations from mid-channel
                                 to the inner bank are insignificant.

          Table 1. Comparison between variations in the maximum scour and sedimentation values for different U/Uc
          values in the meandering channel.

                                         Percentage of increase
                                                                    Percentage of increase     Percentage of increase
                  Bend        U/Uc          in the maximum
                                                                    in the maximum scour          in the volume of
                 location   variations    sedimentation height
                                                                           depth (%)            sediment output (%)
                                                   (%)
                             0.75-0.8                -                          -                         -
                             0.8-0.84                -                          -                         -
                             0.84-0.86               -                          -                         -
                Upstream
                             0.86-0.89               -                          -                         -
                  bend
                             0.89-0.92               -                        325                       3693
                             0.92-0.95               -                        2.94                      21.65
                             0.95-0.98               -                       245.7                      62.95
                             0.75-0.8                -                          -                         -
                             0.8-0.84              200                         50                       33.5
                             0.84-0.86             250                        66.7                      18.3
                Downstre
                             0.86-0.89             119                        100                       30.1
                am bend
                             0.89-0.92            108.7                       100                       66.84
                             0.92-0.95             2.08                        20                       90.65
                             0.95-0.98            14.29                      119.5                      172.8

                                      Instances of variations in lateral bed profiles from the beginning to the end of the
                                 downstream bend have been shown in Figure 6 at 225, 270, 315, and 360-degree angles.
                                 As shown in Figure 6-a, given the flow direction towards the inner bank in the first half
                                 of the bend, sedimentation has occurred at the inner bank. It has continued to a distance
                                 of approximately 20% of the channel width from the inner bank. The secondary flows also
                                 cause separation of sediments from the outer bank and mid-channel, whose result is scour
                                 hole generation at a distance of 20 to 60% from the outer bank. There are no variations
                                 found in bed topography in the rest of the channel width. At this angle, increasing U/Uc
                                 from 0.8 to 0.84, 0.86, 0.89, 0.92, and 0.98 has respectively increased the maximum sedi-
                                 mentation height by 2.5, 3, 6, 48, 47, and 41 times. With the same amount of increase in
                                 U/Uc, the maximum scour depth also increased by 1.5, 2, 3, 8, 16, and 22. In Figure 6-b,
                                 given the mid-channel flow orientation at the 270-degree angle, the sediments are gradu-
                                 ally carried away from the inner bank. It can be observed that the maximum sedimenta-
                                 tion has occurred within the range of 10 to 20% of the channel width from the inner bank.
                                 On account of this figure, sedimentation has continued to 30% of the channel width from
                                 the inner bank, and scour hole generation is observed at the distance of 35 to 75% from
                                 the inner bank. By increasing U/Uc from 0.8 to 0.84, and 0.86, the maximum sedimentation
                                 height remained unchanged at this angle, but increasing it to 0.89, 0.92, 0.95, and 0.98 in-
                                 creased the maximum sedimentation height by factors of 4, 7, 7.5, and 13, respectively.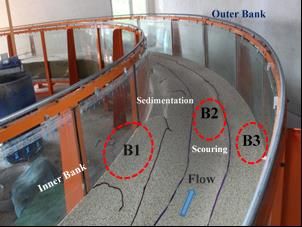
Preprints (www.preprints.org) | NOT PEER-REVIEWED | Posted: 8 February 2021                        doi:10.20944/preprints202102.0198.v1

                                                                                                                                 10 of 17

                                     Moreover, the maximum scour depth increased by 1.5, 2, 3, 4, 5, and 4.5 times respectively
                                     because of increasing U/Uc. In Figure 6-c, when the flow enters the second half of the
                                     downstream bend at the 315-degree angle and the helical flows decline, bed topography
                                     depends on the sediments carried downstream from the upstream bend. In the second
                                     half of the bend, the sediments have gradually been carried away from the inner bank and
                                     towards mid-channel. With the flow's orienting towards mid-channel and then towards
                                     the outer bank, scour hole generation has occurred from the mid-channel to the outer
                                     bend.

                                         (a)                                                         (b)

                                         (c)                                                         (d)

          Figure 5. Instances of variations in the lateral bed profiles at (a) 45, (b) 90, (c) 135, and (d) 180-degree angles of the
          upstream bend.

                                           A comparison between Figures 6-a to 6-c indicates that at the 225-degree cross-sec-
                                     tion, the maximum sedimentation has occurred at the inner bank, but at 270 and 315-de-
                                     gree cross-sections, with the shift in the flow orientation towards mid-channel and the
Preprints (www.preprints.org) | NOT PEER-REVIEWED | Posted: 8 February 2021 doi:10.20944/preprints202102.0198.v1
11 of 17
outer bank, the maximum sedimentation height has been observed from 10 to 20% of the
channel width from the inner bank. The maximum sedimentation height has remained
unchanged at the 315-degree cross-section with an increase in U/Uc value from 0.8 to 0.84
and 0.86, as was also the case with the 225-degree section. However, with an increase in
U/Uc from 0.8 to 0.89, 0.92, 0.95, and 0.98, the maximum sedimentation height increased
by 2, 4, 8, and 26 times. The maximum scour depth analysis indicates that increasing U/Uc
from 0.8 to 0.84, 0.86, 0.89, and 0.92 did not change the value, but increasing it from 0.8 to
0.95 and 0.98 has increased the maximum scour depth by factors of 3 and 15.
(a) (b)
(c) (d)
Figure 6. Instances of variations in the lateral bed profiles at (a) 225, (b) 270, (c) 315, and (d) 360-degree angles of the
downstream bend.
In Figure 6-d, in experiments with U/Uc=0.95 and 0.98, the sediments washed by the
flow recede from the inner bank, are deviated towards mid-channel under the influence
of the straight downstream path, and are deposited at the end of the bend, resulting inPreprints (www.preprints.org) | NOT PEER-REVIEWED | Posted: 8 February 2021 doi:10.20944/preprints202102.0198.v1
12 of 17
accumulation of sedimentary stacks at the inner bend to mid-channel. There was insignif-
icant sedimentation observed in the vicinity of the inner bank to mid-channel in other
tests. In every test, bed topography variations at mid-channel have decreased closer and
closer to the bend's tail area under the downstream straight path's effect on the flow. With
the flow deviated towards the outer bank, the scour hole occurs at the mid-channel range
to the outer bend. As shown in this figure, increasing U/Uc from 0.8 to 0.84, 0.86, and 0.89
does not change the maximum scour and sedimentation. Increasing U/Uc from 0.8 to 0.92,
0.95, and 0.98 has increased the maximum sedimentation height by 2, 2.5, and 20, while
the maximum scour depth increased by respectively 5, 14, and 33 times.
3.3. Longitudinal Bed Profiles Variations
Figure 7 illustrates instances of different longitudinal bed profiles from the beginning
to the tail area of the channel at distances of 10, 50, and 90% of the channel width from the
inner bank for different cases. According to this figure, most bed topography variations
have occurred from the tail area of the upstream bend to the end of the downstream bend.
As shown in Figure 7-a, bed topography had trivial variations at the upstream bend's
outer bank. As the flow is oriented towards the outer bank in the second half of the up-
stream bend, the maximum scour hole has been created within the range of 180 to 200
degrees. In this figure, sedimentation occurred from a range of 10% of the channel width
from the inner bank at the 220-degree angle to the end of the downstream bend. It is in-
tensified in the first half of the bend, where the maximum value has occurred within the
range of 240 to 260 degrees. These sedimentary stacks have been carried downstream
gradually away from the inner bank and towards mid-channel.
Figure 7-b illustrates how insignificant bed topography variations are from mid-
channel to the area short of the downstream bend. The flow is oriented towards the inner
bank at the beginning of the downstream bend. The sediments washed out of the scour
hole created in that area join the sediments deposited from the upstream sections and
head downstream. With the bend geometry taken into consideration, the flow orientation
has gradually shifted away from the inner bank and directed towards mid-channel and
then towards the outer bank in the second half of the bend. Shifted towards mid-channel
in the second half of the bend, the flow sheds over the sedimentary stacks, creating a scour
hole at mid-channel within the range of 220 to 300 degrees. The sediments washed out of
the scour hole have joined the sediments deposited from upstream, and they have been
observed headed downstream. In time, these stacks and holes move towards the outer
bank and then through the downstream straight path, leading to the discharge of sedi-
ments from the bend.
As shown in Figure 7-c, the scour is intensified at the outer bank and the second half
of the bend, and its maximum has occurred within the range of 300 to 360 degrees. The
whole trend described in Figure 7 is also visible in Figure 3 (bed topography variations)
and Figure 5 (variations in the lateral profile) within the same ranges as those in this case.
An overall review of the results of bed topography variations along the meandering
channel indicated that increasing U/Uc from 0.89 to 0.92, 0.95, and 0.98 has increased the
maximum scour depth at the upstream bend by factors of 4.3, 4.4, and 15, respectively.
Increasing U/Uc from 0.8 to 0.84, 0.86, 0.89, 0.92, 0.95, and 0.98 at the downstream bend
has increased the maximum scour depth by respectively 1.5, 2.5, 5, 10, 12, and 26 times.
Moreover, the maximum sedimentation also increased by factors of 3, 10, 23, 48, 49, and
56 due to the increase in this ratio.Preprints (www.preprints.org) | NOT PEER-REVIEWED | Posted: 8 February 2021 doi:10.20944/preprints202102.0198.v1
13 of 17
(a)
(b)
(c)
Figure 7. Instances of variations in the longitudinal bed profile at distances of (a) 10% of the channel width from the first
outer bend and the second inner bend, (b) 50% of the channel width, and (c) 90% of the channel width from the first inner
bend and the second outer bend.
3.4. Qualitative Flow Pattern
Figure 8 illustrates instances of the flow's qualitative behavior at the upstream and
downstream bends in the meandering channel using colored ribbons (a purple ribbon atPreprints (www.preprints.org) | NOT PEER-REVIEWED | Posted: 8 February 2021 doi:10.20944/preprints202102.0198.v1
14 of 17
the layer near the water surface and a yellow ribbon at the layer near the bed). Figures 8-
a and 8-b respectively depict sections from the first and the second halves of the upstream
bend. Flow orientations towards the inner bend at the layers near the bed and towards
the outer bend at the upper layers are evident in these figures. Figure 8-c illustrates the
beginning of the downstream bend. As shown in this figure, since the inner and outer
bends swap positions compared to the upstream bend at the downstream bend inlet, the
streamlines are again oriented towards the outer bank at the water surface. Figure 8-d has
depicted the flow at the end of the downstream bend. According to this figure, from ap-
proximately the 190-degree angle, the upper layers' flow is oriented from the outer bend
towards mid-channel. After the 300-degree angle, it is mostly influenced by the straight
downstream path. This flow variations trend is in line with the descriptions provided in
Figure 3 with respect to bed topography variations.
(a) (b)
(c) (d)
Figure 8. Instances of the qualitative flow behavior at the upstream and downstream bends of the meandering channel
for U/Uc=0.98 at (a) the upstream bend inlet, (b) the upstream bend outlet, (c) the downstream bend inlet, and (d) the
downstream bend outlet.
3D view of the streamlines at the layers near the bed and those near the water surface
along the meandering channel, as well as the helical flows [28] created along the path, are
schematically shown in Figure 9. As shown in this figure, the flow orientation near the
water surface is shifted towards the outer bend, and that at the layer near the bed is shiftedPreprints (www.preprints.org) | NOT PEER-REVIEWED | Posted: 8 February 2021 doi:10.20944/preprints202102.0198.v1
15 of 17
towards the inner bend. Also, the presence of helical flows in the bend has created scour
in the vicinity of the outer bend and sedimentation near the inner bend. These bed topog-
raphy variations, which are affected by the presence of helical flows at the downstream
bend for U/Uc=0.98, have been described in Figure 3-d. Analysis of the qualitative flow
pattern in Figure 8, the schematic illustration of the flow pattern in Figure 9, and the scour
and sedimentation patterns in Figure 3 refer to the correspondence between the scour
changes imposed on the meandering channel bends and the flow pattern. Moreover, the
vector is drawn in the figure also matches the streamlines presented by Vaghefi et al. [29]
and Akbari and Vaghefi [30] at the layers near the bed (towards the inner bend) and the
layer near the water surface (towards the outer bend) in a 180-degree sharp bend with
R/B=2. In addition, flow pattern variation in the meandering channel and its relationship
with the camera photo of bed scour pattern variation in the laboratory under incipient
motion condition in the first bend for U/Uc=0.98 are well illustrated in Figure 4.
Figure 9. A schematic illustration of the 3D flow pattern at the layers near the bed and the water surface in the meandering
channel.
4. Conclusions
This paper presented the experiments conducted for different mean velocity to criti-
cal velocity ratios (U/Uc) at the straight upstream path to determine the incipient motion
conditions in a meandering channel with two consecutive 180-degree mild bends. A study
of bed topography variations along the meander, the effect of the upstream bend geome-
try on downstream bend bed topography variations, and the effect of the downstream
straight path on the upstream bend are among the points addressed in this study. The
following is a summary of the results obtained from this study:
• Bed topography variations at the upstream bend suggest the effectiveness of the
downstream bend in altering the incipient motion conditions along this bend. In ad-
dition to the downstream straight path's role in altering the incipient motion condi-
tions, the upstream bend's geometry has also affected bed topography variations at
the downstream bend.
• For U/Uc=0.89 to 0.98 in both bends, bed topography changed under the bend geom-
etry's influence. The reduction of water level at the upstream bend resulted in an
increase in the flow velocity compared to that at the upstream straight path. The
downstream bend also showed more bed topography variations than the upstream
bend, given its greater water level reduction than the first bend. For U/Uc=0.89 to 0.95
at the first bend, however, no sedimentation occurred.Preprints (www.preprints.org) | NOT PEER-REVIEWED | Posted: 8 February 2021 doi:10.20944/preprints202102.0198.v1
16 of 17
• Since the flow at the first half of the downstream bend is oriented towards the inner
bank, the maximum sedimentation height for every U/Uc value also occurred at a
distance from 0 to 5% from the inner bank. Increasing U/Uc= 0.8 to 0.98 changed the
location of the maximum sedimentation from the 195-degree angle to the 245-degree
angle.
• For every U/Uc at the upstream bend, the maximum scour occurred at a distance of
5% of the channel width from the outer bank and within the range of 178 to 180 de-
grees. Increasing U/Uc from 0.89 to 0.92, 0.95, and 0.98 at this bend respectively in-
creased the maximum scour depth by factors of 4.3, 4.4, and 15.
• Increasing U/Uc from 0.8 to 0.84, 0.86, 0.89, 0.92, 0.95, and 0.98 at the downstream
bend respectively increased the maximum scour depth by factors of 1.5, 2.5, 5, 10, 12,
and 26, and the maximum sedimentation height by factors of 3, 10, 23, 48, 49, and 56.
• For U/Uc values ranging from 0.8 to 0.89 at the downstream bend, the maximum
scour occurred at the distance of 30 to 40% of the channel width within the range of
270 to 275 degrees. However, for U/Uc values ranging from 0.92 to 0.98, the maxi-
mum scour was relocated to a distance equal to 5% of the channel width from the
inner bank within the range of 185 to 195 degrees.
Author Contributions
N. M.
Designing and constructing the laboratory setup; Data Collection; Methodology; Visualization;
Writing-Original Draft; Resources; Formal analysis; Software; Investigation
S. H. M.
Supervision; Conceptualization; Project administration; Formal analysis; Validation; Writing-Re-
viewing, and Editing
M. V.
Supervision; Designing the laboratory setup; Conceptualization; Methodology; Project administra-
tion; Formal analysis; Validation; Writing-Reviewing, and Editing
A. K.
Advising, Formal analysis; Conceptualization; Investigation; Validation; Writing-Reviewing, and
Editing
All authors participated in final review and editing of the paper.
Funding
This research received no external funding.
Conflicts of Interest
The authors declare no conflict of interest.
References
1. Randle, T.J. Use of Multidimensional Models to Investigate Boundary Shear Stress through Meandering River Channels.
Water 2020, 12, 3506.
2. Bertalan, L.; Novák, T.J.; Németh, Z.; Rodrigo-Comino, J.; Kertész, Á.; Szabó, S. Issues of meander development: land deg-
radation or ecological value? The example of the Sajó River, Hungary. Water 2018, 10, 1613.Preprints (www.preprints.org) | NOT PEER-REVIEWED | Posted: 8 February 2021 doi:10.20944/preprints202102.0198.v1
17 of 17
3. Garcia, J.T.; Castillo, L.G.; Haro, P.L.; Carrillo, J.M. Occlusion in Bottom Intakes with Circular Bars by Flow with Gravel-
Sized Sediment. An Experimental Study. Water 2018, 10, 1699.
4. Das, V.K.; Barman, K.; Roy, S.; Chaudhuri, S.; Debnath, K. Near bank turbulence of a river bend with self similar morpho-
logical structures. Catena 2020, 191, 104582.
5. Shields, A. Application of the Theory of Similarity and Turbulence Research to the Bedload Movement. Transl. QM Saleh. Mitt.
Preuss. Vers. Wasserbau Schiffbau: Berlin, Germany, 1936.
6. Dey, S.; Papanicolaou, A. Sediment threshold under stream flow: A state-of-the-art review. KSCE. J. Civ. Eng. 2008, 12, 45-
60.
7. Kramer, H. Sand mixtures and sand movement in fluvial model. Trans. Am. Soc. Civ Eng. 1935, 100, 798-838.
8. Bagnold, R.A. The nature of saltation and of ‘bed-load’transport in water. Proceedings of the Royal Society of London. A.
Math. Phys. Sci. 1973, 332, 473-504.
9. Neill, C.R. Note on initial movement of coarse uniform bed-material. J. Hydraul. Res. 1968, 6, 173-176.
10. Lavelle, J.W.; Mofjeld, H.O. Do critical stresses for incipient motion and erosion really exist?. J. Hydraul. Eng. 1987, 113, 370-
385.
11. Yen, C.L.; Lee, K.T. Bed topography and sediment sorting in channel bend with unsteady flow. J. Hydraul. Eng. 1995, 121,
591-599.
12. Dey, S.; Debnath, K. Influence of streamwise bed slope on sediment threshold under stream flow. J. Irrig. Drain. E. 2000,
126, 255-263.
13. Xu, D.; Bai, Y. Experimental study on the bed topography evolution in alluvial meandering rivers with various sinuous-
nesses. J. Hydro-Env. Res. 2013, 7, 92-102.
14. Mohtar, W. Threshold criteria for incipient grain motion with turbulent fluctuations on a horizontal bed. Sains. Malay. 2015,
44, 147-153.
15. Liu, X.; Zhou, Q.; Huang, S.; Guo, Y.; Liu, C. Estimation of flow direction in meandering compound channels. J. Hydrol.
2018, 556, 143-153.
16. Qin, C.; Shao, X.; Xiao, Y. Secondary Flow Effects on Deposition of Cohesive Sediment in a Meandering Reach of Yangtze
River. Water 2019, 11, 1444.
17. Azarisamani, A.; Keshavarzi, A.; Hamidifar, H.; Javan, M. Effect of Rigid Vegetation on Velocity Distribution and Bed
Topography in a Meandering River with a Sloping Bank. Arab. J. Sci. Eng. 2020, 45, 8633-8653.
18. Akbari, M.; Vaghefi, M.; Chiew, Y.M. Effect of T-shaped spur dike length on mean flow characteristics along a 180-degree
sharp bend. J. Hydrol. Hydromech. 2021, 69, 98-107.
19. Moghaddassi, N. Experimental study of scour pattern around bridge piers in meander. Ph.D. dissertation, Islamic Azad Univer-
sity, Science and Research Branch: Tehran, Iran, 2021.
20. Leschziner, M.A.; Rodi, W. Calculation of strongly curved open channel flow. J. Hydraul. Div. 1979, 105, 1297-1314.
21. Raudkivi, A.J.; Ettema, R. Clear-water scour at cylindrical piers. J. Hydraul. Eng. 1983, 109, 338-350.
22. Ben Mohammad Khajeh, S.; Vaghefi, M.; Mahmoudi, A. The scour pattern around an inclined cylindrical pier in a sharp
180-degree bend: an experimental study. Int. J. River. Basin. Manag. 2017, 15, 207-218.
23. Chiew, Y.M. Scour protection at bridge piers. J. Hydraul. Eng. 1992, 118, 1260-1269.
24. Termini, D. Experimental observations of flow and bed processes in large-amplitude meandering flume. J. Hydraul. Eng.
2009, 135, 575-587.
25. Vaghefi, M.; Motlagh, M.J.T.N.; Hashemi, S.S.; Moradi, S. Experimental study of bed topography variations due to place-
ment of a triad series of vertical piers at different positions in a 180 bend. Arab. J. Geosci. 2018, 11, 102-115.
26. Asadollahi, M.; Vaghefi, M.; Akbari, M. Effect of the position of perpendicular pier groups in a sharp bend on flow and
scour patterns: numerical simulation. J. Braz. Soc. Mech. Sci. 2020, 42, 422-437.
27. Solati, S.; Vaghefi, M.; Behroozi, A.M. Effect of Duration and Pattern of Hydrographs on Scour Around Pier in Sharp Bend
Under Incipient Motion and Live Bed Conditions. Int. J. Civ. Eng. 2021, 19, 51-65.
28. Ben Meftah, M.; De Padova, D.; De Serio, F.; Mossa, M. Secondary Currents with Scour Hole at Grade Control Structures.
Water 2021, 13, 319.
29. Vaghefi, M.; Akbari, M.; Fiouz, A.R. An experimental study of mean and turbulent flow in a 180 degree sharp open channel
bend: Secondary flow and bed shear stress. KSCE. J. Civ. Eng. 2016, 20, 1582-1593.
30. Akbari, M.; Vaghefi, M. Experimental investigation on streamlines in a 180˚ sharp bend. Acta. Sci-Technol. 2017, 39, 425-432.You can also read