Influence of Ocean Topography on Tsunami Propagation in Western Australia - MDPI
←
→
Page content transcription
If your browser does not render page correctly, please read the page content below
Journal of
           Marine Science
           and Engineering

Article
Influence of Ocean Topography on Tsunami
Propagation in Western Australia
Charitha Pattiaratchi
 Oceans Graduate School and the UWA Oceans Institute, The University of Western Australia, 35 Stirling
 Highway, Perth WA 6009, Australia; chari.pattiaratchi@uwa.edu.au; Tel.: +618-6488-3179

 Received: 10 July 2020; Accepted: 14 August 2020; Published: 19 August 2020

 Abstract: Western Australia is susceptible to tsunamis from seismic sources that originate from distant
 sources including the Sunda Arc. Many surface and subsurface topographic ocean features are located
 between the Australian continent and locations where tsunamigenic earthquakes occur. These include
 the Venin Meinesz Seamounts (including Christmas Island) and Horizon Ridge, Exmouth, Zenith and
 Cuvier Plateaus. Numerical simulations of idealised tsunamigenic earthquakes along the Sunda Arc
 revealed that these topographic features have a large influence on the distribution of tsunami heights,
 propagating speeds and energy distribution. The interaction between tsunami waves and Venin
 Meinesz Seamounts and Horizon Ridge, located close to the earthquake locations, scatter the tsunami
 energy into several beams. Exmouth Plateau acts as a focusing feature to increase wave heights
 between North West Cape and Barrow Island whilst Cuvier Plateau deflects energy towards Shark
 Bay. Although Zenith Plateau has a local effect, it does not influence tsunami waves along the coast.
 Southwest Australia is “sheltered” from the direct effect of tsunami waves from Sunda Arc due
 to the combined effects of the Seamounts and Cuvier Plateau in the scattering and refraction of
 tsunami waves.

 Keywords: tsunami; numerical simulation; offshore topography; Western Australia

1. Introduction
      Devastation (loss of lives and coastal infrastructure) due to tsunami impacts along coastal
regions have been highlighted by recent mega-tsunamis in the Indian and Pacific Oceans. The region has
also been impacted by tsunamis over the past two to three centuries (Figure 1; [1]). The Indian Ocean
tsunami (“Boxing Day” tsunami) revealed the destructive effects of tsunamis across the Indian Ocean
with a maximum run-up exceeding 30 m in Banda Aceh (Indonesia) [2]. In Western Australia, the
impact was greatly reduced with a maximum total water level of 2.6 m recorded at Geraldton (Figure 2).
The December 2004 tsunami was followed by much smaller basin-wide tsunamis in 2005, 2006 and
2007 [2]. Although these tsunamis caused a loss of lives and damage to property in the immediate
vicinity of the tsunami generation region in Indonesia, regions located far from the earthquake epicentre
(e.g., Western Australia) did not experience the tsunami’s damaging impacts; however, local sea level
recording stations documented the characteristics of each tsunami [2].

J. Mar. Sci. Eng. 2020, 8, 629; doi:10.3390/jmse8090629                           www.mdpi.com/journal/jmse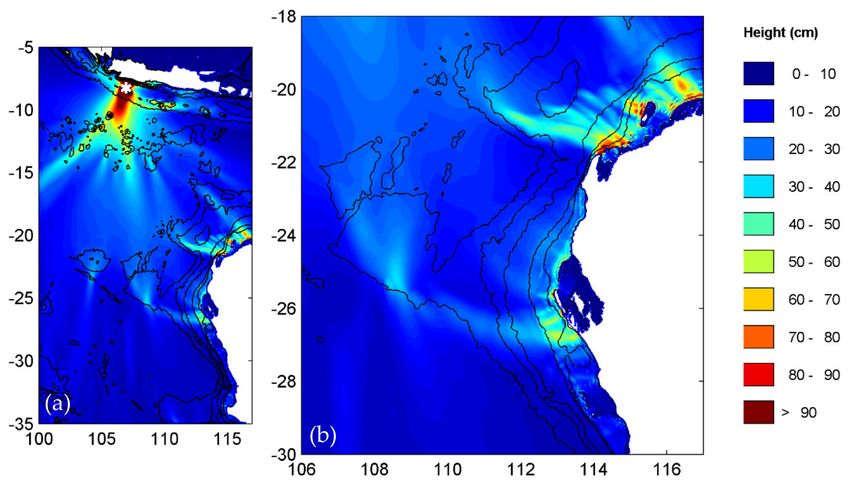
J. Mar. Sci. Eng. 2020, 8, 629                                                                            2 of 16

      Figure 1. Location of earthquakes generating tsunami in the northwest of Australia (from Pattiaratchi
      and Woo [1]). The red underlined events created a tsunami that was recorded in Australia.

     A tsunami is a wave train consisting of a series of waves of long wavelength (>100 km) and
period (order of hours) generated in a body of water by an impulsive disturbance, which vertically
displaces the water. Tsunamis are primarily associated with earthquakes in oceanic and coastal regions.
Landslides, volcanic eruptions, nuclear explosions and even impacts of objects from outer space (such
as meteorites, asteroids and comets) can also generate tsunamis. Tsunamis may also be generated
through atmospheric disturbances that are known as meteorological or meteotsunamis [3,4]. Globally,
the most common tsunamis are those associated with tectonic earthquakes associated with the earth’s
crustal deformation. Although, there are regions, including southwest Australia, where meteotsunamis
are a common occurrence [3,4]. An earthquake that produces a tsunami is known as a tsunamigenic
earthquake. When a tsunamigenic earthquake occurs beneath the sea, the water above the deformed
area is displaced from its equilibrium position. Waves are formed as the displaced water mass, which
acts under the influence of gravity, attempts to regain its equilibrium. This displacement of the
sea surface initiates a series of waves radiating outwards from the initial disturbance. When large
areas of the seafloor elevate or subside, a tsunami can be created. The main factor that determines
the initial size of a tsunami is the degree of vertical seafloor deformation that is controlled by the
earthquake’s magnitude, focal depth (the depth below the seabed at which the earthquake occurs),
fault characteristics and coincident slumping of sediments or secondary faulting. Generally, for a
tsunami to be generated, the earthquake should have a moment magnitude (Mw) > 6.5 to be relatively
shallow—between 20 and 100 km below the seafloor. A shallower depth provides the strongest
“impulse” but a deeper earthquake distributes the “impulse” over a larger area [5].
J. Mar. Sci. Eng. 2020, 8, 629                                                                           3 of 16

      Figure 2. Location of the study region showing the locations mentioned in the text. Bathymetry is
      in meters. The locations of the simulated tsunamigenic earthquakes are also shown as numbered black
      boxes. The vertical dashed lines at 105◦ E, 106.5◦ E and 109◦ E represent cross-sections along where
      water levels were extracted.

      Tsunamis are classified as shallow-water waves where the wavelength is larger compared to
the water depth. As the tsunami crosses the deep ocean, its wavelength from crest to crest may be
                                                                     p will be only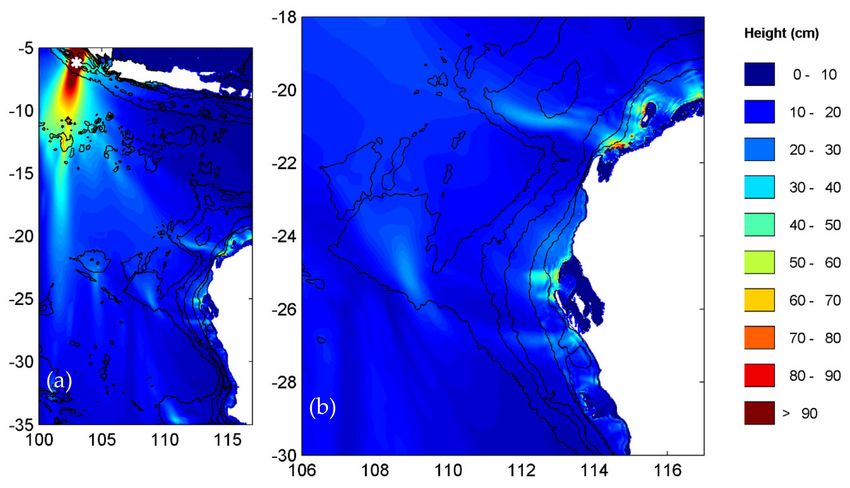
J. Mar. Sci. Eng. 2020, 8, 629                                                                     4 of 16

The tsunami waves extend through the whole water column even in the deep ocean where water
depths are >5000 m. Changes in bottom topography due to underwater plateaus, mid-ocean ridges
and seamounts have a significant effect on tsunami propagation. For example, a decrease in water
depth from 5000 to 2000 m will decrease the celerity of the wave from 220 to 140 ms−1 , a decrease
of 37%. Changes in wave celerity also result in wave refraction that will change the direction of
wave propagation.
     For Australia in general, the historical threat of tsunamis from seismic sources originates from
distant sources [6,7]. Tsunamis in the Indian Ocean are rare, with ~24 tsunamis reported over a
2000-year period prior to 2004 [8]. Western Australia (WA) is susceptible to the action of tsunamis
generated by earthquakes in the Sunda Arc region (Figure 1). Although there have been many
earthquakes in the region, only seven earthquakes have resulted in tsunamis which have been observed
(either through visual records or tide gages) in Australia. Evidence of mega-tsunamis affecting Barrow
Island and Shark Bay (Figure 2) some 2500 to 5500 years ago have been reported [9]. A feature of
the tsunamigenic earthquakes affecting WA is that either they have been located immediately to
Australia’s northern coastline (e.g., earthquakes in 1977 and 1994, Figure 1) or have been large events
recorded throughout the Indian Ocean (e.g., in 1883, 2004, 2005, 2006 and 2007 [2]). The maximum
run-up height of 7.9 m was recorded at Steep Point (Figure 2) during the Pangandaran earthquake
and tsunami that occurred on 17 July 2006. This is considered as the largest tsunami run-up recorded
in mainland Australia [10]. However, the wave heights recorded in southwest Australia, south of
Geraldton due to seismic tsunamis are relatively small. For example, at Fremantle, the maximum
wave height recorded during the 2004 Indian Ocean tsunami was 0.6 m that is frequently exceeded
by meteorological tsunamis on an annual basis [3]. In addition, the maximum tsunami waves that were
recorded at the two southern stations (Bunbury and Busselton) were postulated to be waves reflected
from the Mascarene Plateau as these waves were recorded more than 15 h after the earthquake and
10 h after the arrival of the initial wave [2].
     It has been documented that ocean topography plays a major role in tsunami wave propagation
through wave refraction changing the wave directions in deep water before affecting particular sections
of the coastline [11,12]. There are a number of bathymetric features between the Sunda Trench where
tsunamigenic earthquakes occur and the Australian mainland (Figure 2) and thus provide an ideal
ocean basin to examine the ocean topography on tsunami propagation. The aim of this paper is to use
numerical simulations of tsunami propagation, using idealized tsunamigenic earthquakes, to examine
the role of these bathymetric features on tsunami impacts along the West Australian coastline.

2. Study Region
      The aim of this study is to examine the role of surface and subsurface ocean topography that
influence the propagation of tsunami waves to southwest Australia. In particular, the region between
Geraldton and Busselton (Figure 2) where >90% of the West Australian (WA) population live is
the focus. Studies have shown that in comparison to other regions of Australia, the WA coastline
experiences a relatively high frequency of tsunami occurrence through the tsunamigenic earthquakes
along the Sunda Arc, south of Indonesia [7,12]. Large tsunamigenic earthquakes offshore of Java
and Sumba are likely to be a greater threat to WA than those offshore of Sumatra or elsewhere in
Indonesia [7,12]. Many topographic features are located between the Sunda Arc and southwest
Australia that could influence tsunami wave propagation and include (Figure 2): Christmas Island,
Venin Meinesz Seamounts, Horizon Ridge and several plateaus (Zenith, Cuvier, Exmouth).
      The abyssal plain in the northern section of Wharton Basin (Figure 2) lies at 5000 to 6000 m and is
cut by volcanic seamounts and ridges that include the Venin Meinesz Seamounts and the Horizon
ridge [13]. Venin Meinesz Seamounts is a chain of seamounts trending broadly east to west along
latitude 12◦ S that are located in a volcanic province [14]. It covers an area of ~1,000,000 km2 and
comprises the Vening Meinesz chain, Cocos and Christmas Rises and numerous unnamed large and
small volcanic cones formed on eroded guyot platforms and frequent uneroded seamounts [15]. In this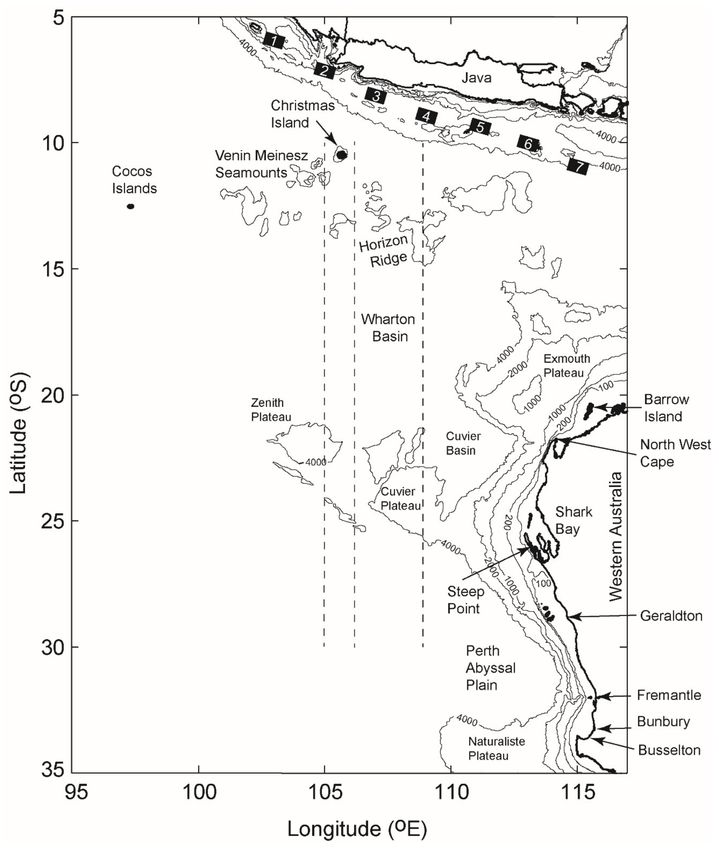
J. Mar. Sci. Eng. 2020, 8, 629                                                                             5 of 16

region, the seafloor is at ~5500 water depth with the large seamounts rising up to 3000 m from the
seafloor and the morphology of the seamounts indicating their volcanic origin with very steep slopes
and almost circular conical shapes [16]. Here, the seamount summits are frequently above 2000 m
below sea level, usually being 40 to 50 km in diameter [16].
     An expansive bathymetric high is located to the south of Wharton Basin and offshore Shark Bay
extending 1000 km offshore in an NW direction and includes the Cuvier Plateau (also known as Wallaby
Plateau) and the Zenith Plateau (Figure 2). The bathymetric high is bordered to the north by the Cuvier
Abyssal Plain and in the south by the Perth Abyssal Plain. The Cuvier Plateau lies in water depths
of 5000 m rising to 2200 m at the shallowest region and covers an area of ~100,000 km2 (Figure 2).
The Zenith Plateau is separated from the Cuvier Plateau by a 100 to 150 km wide bathymetric trough.
The shallowest region of the Zenith Plateau lies 1960 m below sea level with its base at ~5000 m water
depth. It is ~300 km long and ~200 km wide.

3. Methodology
     For this study, the MOST (Method of Splitting Tsunami) model [17–20] was used. MOST is a suite
of numerical simulation codes capable of simulating three processes of tsunami evolution: earthquake,
transoceanic propagation and inundation of dry land. As the aim of this paper is to examine the role of
offshore topography on tsunami wave propagation, the inundation of dry land was not implemented.
The tsunami generation model assumes a fault plane model of the earthquake source based on an
elastic half-space overlaid with an incompressible liquid layer representing the earth’s crust and
ocean, respectively [20]. Linear models are used to study the generation process of the model because
the gravity wave formation due to the initial water disturbance is generally a slow process driven
by hydrostatic forces with negligible non-linear effects [21]. The propagation algorithm of the model
is extremely flexible and can simulate tsunami movement over basin scales. The MOST model has
been validated and verified substantially through analytical solutions, experimental results and
field measurements as outlined in Synolakis et al. [22,23]. The MOST model is implemented in the
ComMIT model [24] but in this study, the original code was used.
     The MOST model was run on the Pawsey Centre supercomputing facilities. The model domain
is shown in Figure 1 and consisted of an 1801 (latitude) and 1021 (longitude) grid at 60-arc-second
(~1.852 km or 1 nm) resolution. Bathymetry was sourced through the GEBCO database. Seven different
tsunamigenic earthquake locations were defined along the Sunda Arc (Table 1; Figure 2). Characteristics
of each tsunamigenic earthquake were identical with each having a moment magnitude of 8.2 with
both the focal depth and slip being 10 m (Table 2). The model time step was 5 s and each scenario was
simulated over a period of 360 min (6 h) and took several hours to complete even on a supercomputer.
The simulation period ensured that the tsunami waves had propagated through the entire domain and
exited the southern boundary. The model output was used to create a series of snapshots of water levels
both as spatial differences and as time series, as well as the maximum wave heights for each scenario.

            Table 1. Location of the tsunamigenic earthquakes offshore of Java used for the simulations.

                                               1     2     3        4       5       6        7
                        Latitude   (◦   S)     6     7     8        9       9       10      11
                      Longitude     (◦   E)   103   105   107      109     111     113      115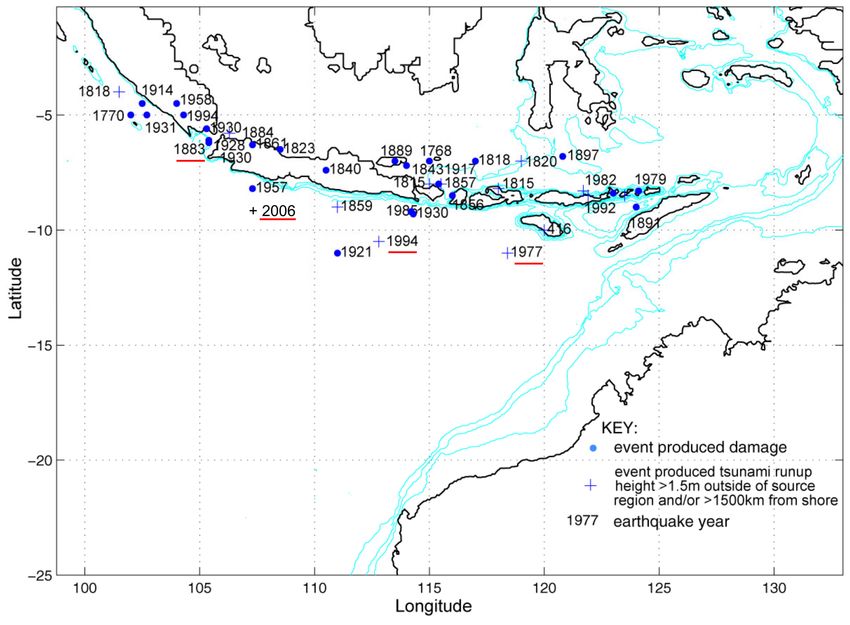
J. Mar. Sci. Eng. 2020, 8, 629                                                                         6 of 16

                  Table 2. Characteristics of the tsunamigenic earthquakes used for the simulations.

                                           Length (km)                100
                                           Width (km)                 50
                                           Dip   (◦ )                 25
                                           Rake   (◦ )                90
                                           Strike   (◦ )              300
                                           Slip (m)                   10
                                           Depth (km)                 10
                                           Moment magnitude           8.2

     In the linear shallow water wave theory, wave energy is proportional to the square of the
wave height. Therefore, the distribution of maximum wave heights over the model domain provides a
useful indication of the characteristics of tsunami propagation. These maps, termed “energy maps”
represent the maximum wave heights the open ocean caused by the tsunami and indicate that the kinetic
energy of the tsunami was not distributed evenly across oceans but instead form directional “beams”
where tsunami wave energy is concentrated. Energy maps for each of the tsunamigenic earthquake
scenarios were constructed to identify the directional beams due to the offshore topographic features.

4. Results

4.1. Time Series
     The time series of tsunami wave propagation from the tsunamigenic earthquake scenario
four highlights the influence of ocean topography (Figure 3). Twenty minutes after the earthquake
the leading crest of the tsunami wave was symmetric and approaching the Venin Meinesz Seamounts
(Figure 3a). After 40 min, the leading crest of the tsunami wave had passed Christmas Island, Venin
Meinesz Seamounts and the Horizon Ridge and had made landfall in Java (Figure 3b). At 60 min,
the leading waves had progressed to the Wharton Basin with many local oscillations present in the
region of seamounts (Figure 3c). Over the period of 80 to 120 min, the wave transited across Wharton
Basin and approached the three main plateaus (Figure 2): Zenith, Cuvier and Exmouth (Figure 3d–f).
The Exmouth Plateau slowed the propagation due to reduced depth (Figure 3f). The interaction
between the tsunami waves with Zenith and Cuvier Plateaus occurred between 100 and 120 min
with the propagation speed of the wave crest decreasing over the summits of the plateau. This was
noticeable as the wave propagated over the deeper water between the Zenith and Cuvier Plateaus;
the wave crest is advanced to the south compared to that over the plateaus (Figure 3f). At 140 min,
the tsunami waves had made landfall at North West Cape (Figure 2) on the Australian mainland
(Figure 3g). Along 25◦ S, the single tsunami wave crest had decomposed to three separate crests
downstream of the plateaus (c.f. Figure 3d,g) and secondary wave crests were visible downstream of
the plateaus (Figure 3g). Over the subsequent 40 min, the waves propagated southward but with two
clear leading wave crests (Figure 3h,i).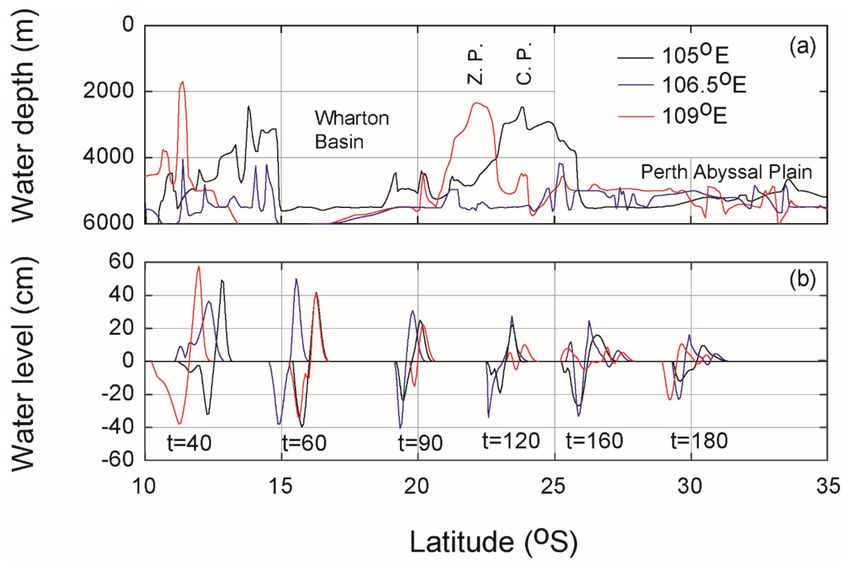
J. Mar. Sci. Eng. 2020, 8, 629                                                                           7 of 16

      Figure 3. (a–i): Snapshots of tsunami wave propagation from tsunamigenic earthquake scenario 4.
      Yellow and blue colours represent positive and negative water levels, respectively. The elapsed time
      from the occurrence of the earthquake is shown. The 200, 1000 and 4000 m depth contours are shown.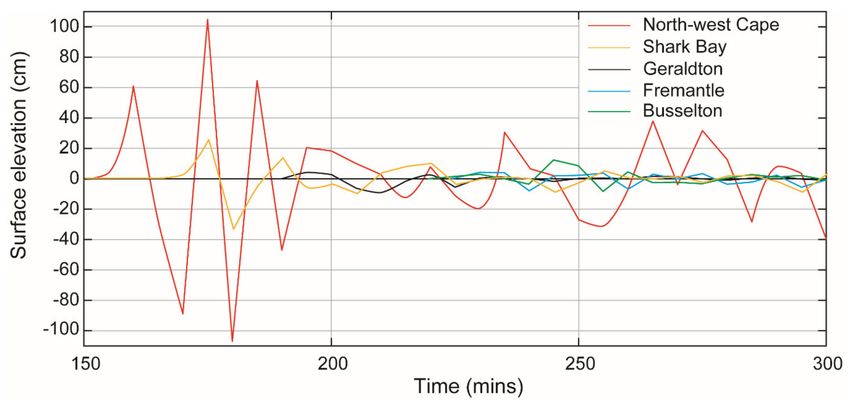
J. Mar. Sci. Eng. 2020, 8, 629                                                                                  8 of 16

      The propagation of the tsunami waves indicated a general decrease in wave height with distance
travelled (Figure 4). Initially, the maximum wave heights were ~100 cm at ~12◦ S (along 109◦ E) prior
to interaction with the topography. There was a slight decrease in wave heights (80 to 90 cm) when the
waves arrived at Wharton Basin and further decreased (40 to 70 cm) when approaching the plateaus
(Figure 4b). There was a significant reduction in the wave heights as the tsunami crossed the plateaus:
there was a reduction of 60% and 48% in wave height as the waves passed over the Zenith and Cuvier
Plateaus (red and black lines), respectively. There was only a 15% reduction in wave heights as they
crossed the bathymetric trough between the two plateaus (Figure 4b).

      Figure 4. (a) Bathymetry cross-sections in the north–south direction at 105◦ E, 106.5◦ E and 109◦ E
      representing sections across Zenith Plateau (red lines), bathymetric trough (blue lines) and Cuvier
      Plateau (black lines), respectively; (b) leading tsunami wave profiles from tsunamigenic earthquake
      scenario 4 at different elapsed time (in minutes) after the earthquake. The locations of the cross-sections
      are shown in Figure 2. Note that only the leading waves of the tsunami are shown.

     The time series of surface elevation along the 100 m contour offshore at five different locations
along the coastline was extracted from the model output for the tsunamigenic earthquake 4 scenario.
This is the centre point of the seven scenarios and was located close to the 2006 tsunami (Figures 1
and 2). Note that for scenarios located to the east (6, 7), the Australian continental landmass acts as a
shelter to locations south of Shark Bay (Figure 2). The results for scenario 4 indicated significant spatial
changes in the tsunami wave heights along the coast (Figure 5). Maximum wave heights (>210 cm)
were predicted at North West Cape due to the proximity of the location to the earthquake source and
due to focusing from Exmouth Plateau (Figure 2)—this is discussed below. The maximum wave height
at Shark Bay was ~56 cm whilst it was 12 cm at Geraldton and Fremantle. A slightly higher maximum
wave height (17 cm) was predicted at Busselton (Figure 5).
J. Mar. Sci. Eng. 2020, 8, 629 9 of 16
Figure 5. Time series of water levels at the 100 m contour at North West Cape, Shark Bay, Geraldton,
Fremantle and Busselton for tsunamigenic earthquake 4. Locations are given in Figure 2. Time
represents elapsed time in minutes since the earthquake.
4.2. Energy Maps
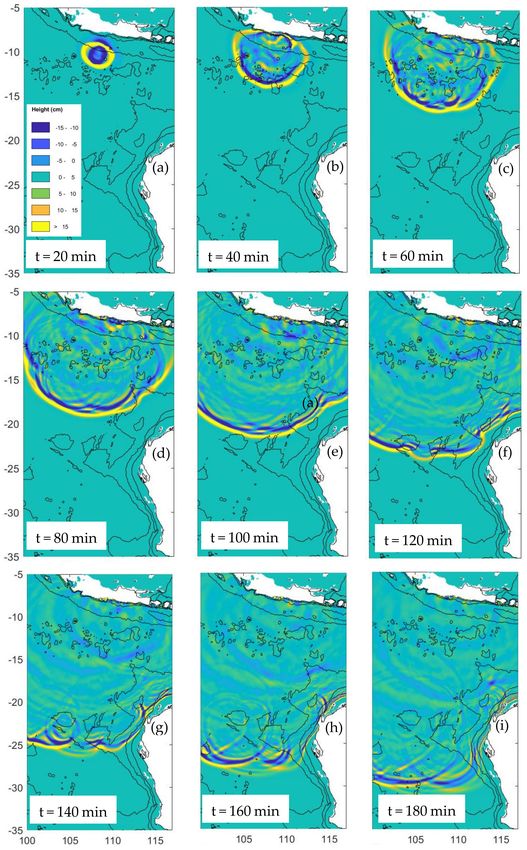
The distribution of maximum wave heights (“energy map”) for tsunamigenic earthquake scenario
one (easternmost location) indicated that the main energy beam impacted the Vening Meinesz
seamounts with it moving southward to the west of the Zenith Plateau (Figure 6a). There was an
amplification of wave heights at all the plateaus (Exmouth, Zenith, Cuvier and Naturaliste, Figure 2).
As the secondary beam was directed to the southeast that interacted with both Exmouth and Cuvier
Plateaus that resulted in higher wave heights at North West Cape and Shark Bay (Figure 6b with
locations in Figure 2). Scenario two was very similar to 1 except that as the earthquake location was
shifted to the east, the main beam interacted directly with Zenith Plateau, increasing the wave heights
at the summit (Figure 7a) and along Shark Bay (Figure 7b).
Figure 6. Maximum tsunami wave heights for tsunamigenic earthquake scenario 1. (a) Whole model
domain and, (b) a zoomed version around northwest Australia.J. Mar. Sci. Eng. 2020, 8, 629 10 of 16
Figure 7. Maximum tsunami wave heights for tsunamigenic earthquake scenario 2. (a) Whole model
domain and, (b) a zoomed version around northwest Australia.
Scenario 3 indicated almost a direct impact on Christmas Island and the tsunami interaction with
Vening Meinesz seamounts and Horizon ridge resulted in 4 energy beams (Figure 8a). The western
beam exited the domain at ~16◦ S. The second beam from the west was directed at Zenith Plateau but
the presence of a seamount directly upstream reduced the wave heights at Zenith Plateau compared to
scenario 2 (cf. Figures 7a and 8a). The eastern beams interacted with Cuvier and Exmouth Plateaus to
create enhanced wave heights at Barrow Island, North West Cape and Shark Bay (Figure 8b).
Figure 8. Maximum tsunami wave heights for tsunamigenic earthquake scenario 3. (a) Whole model
domain and, (b) a zoomed version around northwest Australia.
Scenario 4 was close to the location of the Pangandaran earthquake (Mw 7.7) and tsunami that
occurred on 17 July 2006 [2,10]. There were two major beams (Figure 9a) with the eastern beamJ. Mar. Sci. Eng. 2020, 8, 629 11 of 16
interacting with Cuvier and Exmouth Plateaus to create increased wave heights at Barrow Island,
North West Cape and Shark Bay (Figure 9b), similar to scenario 3. The highest wave heights for the
Shark Bay region were predicted from this scenario (see also Section 5).
Figure 9. Maximum tsunami wave heights for tsunamigenic earthquake scenario 4. (a) Whole model
domain and, (b) a zoomed version around northwest Australia.
Moving to the east, scenario 5 created three energy beams with the two western ones directed to
the southwest and away from the landmass (Figure 10a). The eastern beam strongly interacted with
Exmouth Gulf, increasing wave heights off Barrow Island (Figure 10b).
Figure 10. Maximum tsunami wave heights for tsunamigenic earthquake scenario 5. (a) Whole model
domain and, (b) a zoomed version around northwest Australia.J. Mar. Sci. Eng. 2020, 8, 629 12 of 16
Scenarios 6 and 7 are such that the main energy beams are directed to the southwest
(Figures 11a and 12a) away from the landmass. The exception is that the eastern beam that interacts
with the Exmouth Plateau and concentrating wave energy at the North West Cape and Barrow Island
(Figures 11b and 12b).
Figure 11. Maximum tsunami wave heights for tsunamigenic earthquake scenario 6. (a) Whole model
domain and, (b) a zoomed version around northwest Australia.
Figure 12. Maximum tsunami wave heights for tsunamigenic earthquake scenario 7. (a) Whole model
domain and, (b) a zoomed version around northwest Australia.
The predicted maximum wave heights (Hmax ) along the 100 m depth contour offshore of North
West Cape, Shark Bay, Geraldton, Fremantle and Busselton (see Figure 2 for location) for all the
scenarios are summarised in Table 3. In Western Australia, >90% of the coastal population is located
between Geraldton and Busselton and, therefore, is of interest in terms of tsunami impact. ResultsJ. Mar. Sci. Eng. 2020, 8, 629 13 of 16 indicated that there were no significant differences in Hmax at locations south of Geraldton for scenarios one to four (Hmax range: 10 to 18 cm) and decreased significantly, Hmax
J. Mar. Sci. Eng. 2020, 8, 629                                                                     14 of 16

recurrence interval (ARI) of maximum tsunami wave heights at Exmouth (close to North West Cape,
Figure 2) was 60 and 160 cm, respectively, whilst the same ARI’s for Geraldton were 8 and 70 cm and
for Fremantle 4 and 35 cm. The results of this study reveal that the variability in the ARI’s value along
the coast could be attributed to the offshore topography.
       There are a series of bathymetric features along the eastern Indian Ocean between features between
the Sunda Arc where tsunamigenic earthquakes occur and southwest Australia that influence tsunami
wave propagation and include (Figure 2): Christmas Island, Venin Meinesz Seamounts, Horizon Ridge
and several plateaus (Zenith, Cuvier, and Exmouth). The numerical simulations presented in this
study have shown that these bathymetric features have a strong influence on tsunami propagation and
energy distribution. Initially, the tsunami wave encountered the Venin Meinesz Seamounts (including
Christmas Island) and Horizon Ridge that separated the tsunami energy into three to four beams
(Figures 8a, 9a, 10a and 11a). Earthquakes that occur at the eastern end (Scenario 7) indicate a single
energy beam as the Seamounts and Horizon Ridge do not extend that far (Figure 12). After the tsunami,
waves propagated past these features and they encountered the plateaus. These are large topographic
features that rise from water depths of 5000 to ~2200 m occupying up to 60% of the water column
(Figure 4a) and influence the characteristics of the tsunami through wave shoaling, propagating speed
and direction (refraction).
       Exmouth Plateau has a large influence on focusing the tsunami waves between North West Cape
and Barrow Island with increasing effect for earthquakes to the east. For example, under scenario
one (western end), although there was an energy beam moving past the plateau (scattered by the
seamounts) maximum wave heights at the 100 m depth contour was 70 cm (Figure 6). In contrast,
under scenario seven (western end), energy beams were refracted around both sides of the plateau
resulting in maximum wave heights at the 100 m depth contour of >1.20 m (Figure 12). Exmouth
Plateau acts as a bathymetric feature that focusses tsunami waves at the coast.
       Zenith Plateau is located ~1000 km from the coast and although there is an increase in wave heights
on the plateau, downstream effects are limited to the offshore and thus do not have an influence on
the coastline (Figures 6–12). In contrast, Cuvier Plateau was impacted from beams scattered by the
seamounts, appeared to refract waves towards the coast (Figures 6–9), and was most pronounced for
tsunamigenic earthquakes along the eastern region of Java (scenarios 2, 3, 4 and 5). Here, the beams
interacted with the plateau and were deflected towards the coast in the Shark Bay region (Figures 6–9).
It is interesting to note that the largest tsunami run-up (7.9 m) recorded in mainland Australia was
at Steep Point (Figure 2) resulting from the Mw 7.7 Pangandaran earthquake and tsunami (17 July
2006) [10]. This earthquake was located between scenarios three and four (Figures 8b and 9b) and
simulations highlight the influence of the Cuvier Plateau contributing to the higher run-up heights at
this location.
       The observed wave heights from many tsunamis to the south of Geraldton have been small [2].
The results from this study indicate that the bathymetric features (seamounts and plateaus) influence
the energy distribution through energy scattering and refraction reducing the energy incident in this
region. Pattiaratchi and Wijeratne [2], through analysis of sea level data along the WA coast, concluded
that the maximum tsunami waves measured in southwest Australia were reflected from the Mascarene
Ridge and/or the island of Madagascar. Here, highest waves occurred 15 h after the arrival of the first
wave and the travel path was such that the tsunami waves did not encounter the bathymetric features,
as they were directed towards the southwest.

6. Conclusions
     Numerical simulations of idealised tsunamigenic earthquakes along the Sunda Arc revealed
that topographic features in the ocean have a large influence on the distribution of tsunami
wave heights, propagating speed and direction. The bathymetric features are located between
locations of tsunamigenic earthquakes and the Australian mainland and include Venin Meinesz
Seamounts (including Christmas Island) and Horizon Ridge, Exmouth, Zenith and Cuvier plateaus.
J. Mar. Sci. Eng. 2020, 8, 629 15 of 16
The interaction between tsunami waves and Venin Meinesz Seamounts and Horizon Ridge, located
close to the earthquake locations, scatter the tsunami energy into several beams transporting energy in
different directions. Exmouth Plateau acts as a focusing feature to increase wave heights between North
West Cape and Barrow Island, whilst Cuvier Plateau deflects energy towards Shark Bay. Earthquakes
in the eastern section of the Sunda Arc have a larger influence due to the absence of seamounts and
Horizon ridge and being close to the source. Although Zenith Plateau has a local effect, it does not
influence tsunami waves along the coast. Southwest Australia is “sheltered” from the direct effect of
tsunami waves from Sunda Arc due to the combined effects of the Seamounts and Cuvier Plateau in the
scattering and refraction of tsunami waves. Cuvier Plateau deflects the wave energy towards the coast.
Funding: The research is funded by the University of Western Australia.
Acknowledgments: The author acknowledges the support of Vasily Titov (PMEL) who provided the source code
of the MOST model that was implemented and run at the Pawsey Supercomputer Centre (Perth).
Conflicts of Interest: The author declares no conflict of interest.
References
1. Pattiaratchi, C.B.; Woo, M. Risk of Tsunami impact at the Port of Dampier. In The University of Western
Australia Centre for Water Research Report; No. WP 1520 CP; UWA: Perth, WA, Australia, 2000.
2. Pattiaratchi, C.B.; Wijeratne, E.M.S. Tide gauge observations of the 2004–2007 Indian Ocean tsunamis from
Sri Lanka and Western Australia. Pure Appl. Geophys. 2009, 166, 233–258. [CrossRef]
3. Pattiaratchi, C.B.; Wijeratne, E.M.S. Observations of meteorological tsunamis along the south-west Australian
coast. Nat. Hazards 2014, 74, 281–303. [CrossRef]
4. Pattiaratchi, C.B.; Wijeratne, E.M.S. Are meteotsunamis an underrated hazard? Philos. Trans. R. Soc. A Math.
Phys. Eng. Sci. 2015, A373, 1–23. [CrossRef] [PubMed]
5. Okal, E.A. Seismic parameters controlling far-field tsunami amplitudes: A review. Nat. Hazards 1988, 1,
67–96. [CrossRef]
6. Canterford, R.; Ryan, C.; Crane, G. National Report Submitted by Australia, 2006; Intergovernmental
Coordination Group for the Pacific Tsunami Warning and Mitigation System (ICG/PTWS)-XXI; Bureau
of Meteorology, Intergovernmental Coordination Group for the Pacific Tsunami Warning and Mitigation
System (ICG/PTWS): Melbourne, VIC, Australia, 2006.
7. Burbidge, D.; Cummins, P.R.; Mleczko, R.; Thio, H.K. A Probabilistic Tsunami Hazard Assessment for
Western Australia. Pure Appl. Geophys. 2008, 165, 2059–2088. [CrossRef]
8. Dominey-Howes, D. Geological and historical records of tsunami in Australia. Mar. Geol. 2007, 239, 99–123.
[CrossRef]
9. Playford, P.E. Recent mega-tsunamis in the Shark Bay, Pilbara, and Kimberley areas of Western Australia.
J. R. Soc. West. Aust. 2014, 97, 173–188.
10. Prendergast, A.; Brown, N.J. Far-field impact and coastal sedimentation associated with the 2006 Java tsunami
in West Australia. Nat. Hazards 2011, 60, 69–79. [CrossRef]
11. Titov, V.V.; Rabinovich, A.; Mofjeld, H.O.; Thomson, R.E.; González, F.I. The Global Reach of the 26 December
2004 Sumatra Tsunami. Science 2005, 309, 2045–2048. [CrossRef] [PubMed]
12. Pattiaratchi, C.B. The threat of tsunamis in Western Australia. In Proceedings of the Third WA State Coastal
Conference, WA Department of Planning, Busselton, WA, Australia, 15–18 November 2005; pp. 210–218.
13. Exxon, N.F. Seabed morphology and offshore resources around Christmas Island, Indian Ocean. In BMR
Offshore Sedimentary Basins Program; Geoscience Australia: Canberra, ACT, Australia, 1991.
14. Hoernle, K.; Hauff, F.; Werner, R.; Bogaard, P.V.D.; Gibbons, A.D.; Conrad, S.; Müller, R. Origin of Indian
Ocean Seamount Province by shallow recycling of continental lithosphere. Nat. Geosci. 2011, 4, 883–887.
[CrossRef]
15. Sayers, J.; Borissova, D.; Ramsay, I.; Symonds, P.A. Geological Framework of the Wallaby Plateau and Adjacent Areas;
Record no. 2002/21; Petroleum & Marine Division, Geoscience Australia: Canberra, ACT, Australia, 2002.
16. Borissova, I. Seafloor Morphology and Tectonics of the Christmas Island Area, Indian Ocean; Record 1994/2;
Australian Geological Survey Organisation: Canberra, ACT, Australia, 1994.J. Mar. Sci. Eng. 2020, 8, 629 16 of 16
17. Titov, V.V.; Synolakis, C.E. Modeling of Breaking and Nonbreaking Long-Wave Evolution and Runup Using
VTCS-2. J. Waterw. Port Coast. Ocean Eng. 1995, 121, 308–316. [CrossRef]
18. Titov, V.V.; Synolakis, C.E. Extreme inundation flows during the Hokkaido-Nansei-Oki Tsunami. Geophys.
Res. Lett. 1997, 24, 1315–1318. [CrossRef]
19. Titov, V.V.; Synolakis, C.E. Numerical Modeling of Tidal Wave Runup. J. Waterw. Port Coast. Ocean Eng. 1998,
124, 157–171. [CrossRef]
20. Titov, V.V.; González, F.; Gonzalez, F.I. Implementation and Testing of the Method of Splitting Tsunami (MOST)
Model, 1997; National Technical Information Service, National Oceanic & Atmospheric Administration
(NOAA) Publisher: Seattle, WA, USA, 1997.
21. Titov, V.V. Numerical Modeling of Long Wave Runup. Ph.D. Thesis, University of Southern California, Los
Angeles, CA, USA, 1997.
22. Synolakis, C.E.; Bernard, E.N.; Titov, V.V.; Kânoğlu, U.; González, F. Standards, Criteria, and Procedures for NOAA
Evaluation of Tsunami Numerical Models; NOAA Special Report, Contribution No 3053, NOAA/OAR/PMEL;
NOAA: Seattle, WA, USA, 2007; p. 55.
23. Synolakis, C.E.; Bernard, E.N.; Titov, V.V.; Kânoğlu, U.; Gonzalez, F.I. Validation and Verification of Tsunami
Numerical Models. Pure Appl. Geophys. 2008, 165, 2197–2228. [CrossRef]
24. Titov, V.V.; Moore, C.W.; Greenslade, D.J.M.; Pattiaratchi, C.; Badal, R.; Synolakis, C.E.; Kanoglu, U. A New
Tool for Inundation Modeling: Community Modeling Interface for Tsunamis (ComMIT). Pure Appl. Geophys.
2011, 168, 2121–2131. [CrossRef]
25. Rabinovich, A.; Candella, R.N.; Thomson, R.E. The open ocean energy decay of three recent trans-Pacific
tsunamis. Geophys. Res. Lett. 2013, 40, 3157–3162. [CrossRef]
© 2020 by the author. Licensee MDPI, Basel, Switzerland. This article is an open access
article distributed under the terms and conditions of the Creative Commons Attribution
(CC BY) license (http://creativecommons.org/licenses/by/4.0/).You can also read