Earthquake and Tsunami Losses from Major Earthquakes Affecting the Wellington Region - December 2008
←
→
Page content transcription
If your browser does not render page correctly, please read the page content below
Earthquake and Tsunami Losses
from Major Earthquakes
Affecting the Wellington Region
December 2008
Contents
Executive Summary                                 2

Introduction                                      3

Earthquakes                                       4

Tsunami                                           7
    Historical Tsunami                            7
    Tsunami Modelling                             7

Assets                                            9

Earthquake Vulnerability of Buildings            10

Tsunami Vulnerability                            11

Results                                          12

Sensitivity Testing                              14
    Prior Damage                                 14
    Structure Quality                            14
    Floor Height                                 14

Conclusions                                      16

Contributors                                     17

Contacts                                         17
      GNS Science                                17
      Aon Benfield                               17

References                                       18
      GNS Science                                18

Proprietary & Confidential              Page 1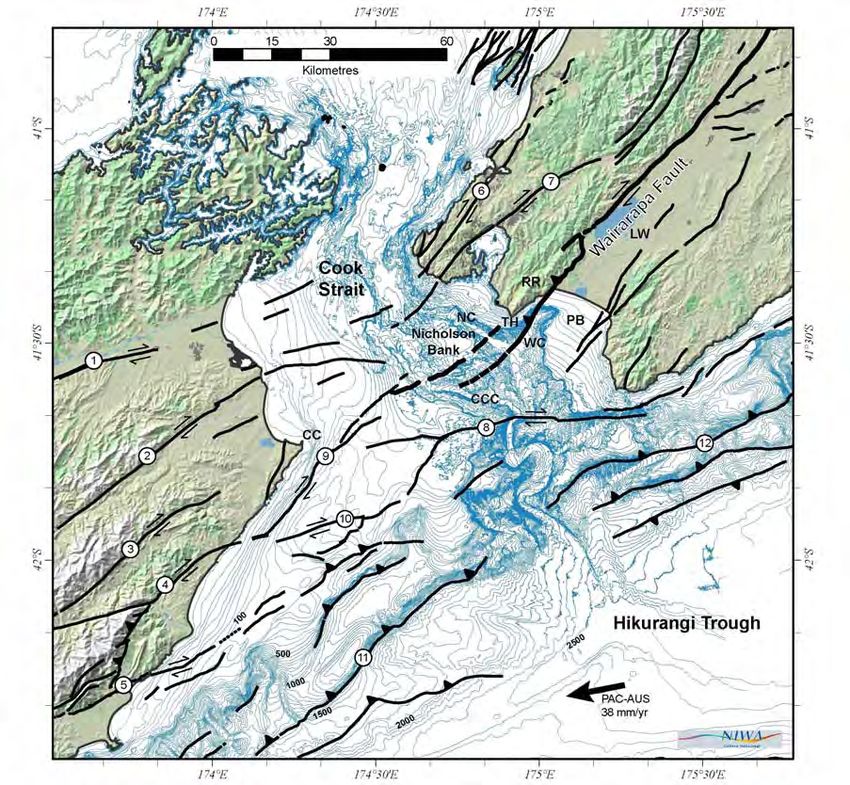
Executive Summary
The traditional earthquake PML scenario for New Zealand has long been a rupture on the Wellington fault
of approximately Mw7.5.

This was brought into question following a 2005 tsunami risk study conducted by GNS and other
organisations, which showed the potential for tsunami losses significantly exceeded potential earthquake
losses. Even more worrying, was the potential for correlated earthquake and tsunami losses from locally
sourced events.

Using much more robust modelling than that used in 2005 this study investigated this hypothesis,
reviewing shake and tsunami losses generated by earthquakes from four faults in the Wellington region.
Even when the tsunami modelled were associated with very low probability earthquake events (i.e.
beyond the return periods used for business decision making), the results show that tsunami does not add
significantly to the shaking losses generated by each earthquake. Accordingly the shake loss generated
by a Mw7.5 event on the Wellington fault remains a good earthquake PML for New Zealand.

Proprietary & Confidential                                                              Page 2
Introduction
Following the 2004 Asian tsunami a 2005 report authored by GNS and other agencies suggested that
potential tsunami losses in New Zealand could be much larger than previously suspected, significantly
larger even than potential shaking losses from a Magnitude 7.5 earthquake on the Wellington Fault,
generally accepted as the New Zealand PML event. Recognising the importance of this finding for the
insurance industry, Aon Benfield commissioned GNS to undertake more detailed research on potential
tsunami losses in the Wellington area, focusing on combined tsunami and earthquake losses.

Potential earthquake losses in Wellington are generated by local earthquakes whereas tsunami losses
can be produced by either local or distant sources (e.g., South America). Our concern here is only with
local sources and with tsunami generated by earthquakes, as these are the events that will correlate with
the current PML event to escalate potential losses. We have ignored both tsunami from distant sources
and the very small proportion generated by landslides and/or volcanic eruptions.

The commissioned work required significant original research on potential tsunami sources, newly
compiled elevation and bathymetry data, experience with the recently developed Australian National
University – Geoscience Australia (ANUGA) tsunami wave propagation model, a detailed building assets
model, and a new assessment of tsunami damage to buildings.

This report summarises the methodology and presents the current understanding of potential tsunami and
earthquake losses for the Wellington area.

Proprietary & Confidential                                                               Page 3
Earthquakes
To simplify the modelling required we have chosen a number of scenario earthquakes with the greatest
potential to generate tsunami in the Wellington area (Figure 1 and Figure 2):

     Wellington Fault, approximate magnitude Mw 7.5. This scenario represents the highest predicted
     earthquake loss and is commonly employed in the insurance industry to benchmark reinsurance
     needs. The return period of this event is approximately 700 years. Vertical movements generating
     tsunami are expected both inside Wellington Harbour and in Cook Strait. Co-seismic subsidence of
     some parts of Lower Hutt may increase tsunami susceptibility.
     Wairarapa Fault, approximate magnitude Mw 8.2, with a return period of approximately 1 in 1000
     years. This scenario represents one of the highest predicted earthquake losses after the Wellington
     Fault. The 1855 rupture on this fault caused a tsunami for which several observations of wave heights
     are documented, and for which uplift estimates have been made at many coastal locations (Grapes
     and Downes 1997). We have modelled both the 1855 tsunami (for calibration purposes) and a
     predicted future tsunami from this source, with the two events differing by the initial land elevations –
     the 1855 earthquake left the Wellington landscape in approximately its present form.
     BooBoo Fault, approximate magnitude Mw 7.4. This is an active (i.e. return period of approximately 1
     in 500 years) recently discovered offshore fault in Cook Strait. The orientation of the fault is conducive
     to directing tsunami waves towards Wellington. It is the largest of several similar faults in the Cook
     Strait area. Although it is primarily a strike-slip fault, probably with little tsunamigenic potential, we
     have considered the potential impact of an exaggerated vertical displacement to generate a
     conservative estimate of damage.
     Subduction Zone, this is the likely source of the largest magnitude earthquakes in the study area, and
     a likely source of major tsunami. However, the fault orientation is not strongly conducive to directing
     tsunami towards Wellington. Large uncertainties exist regarding recurrence interval and near-surface
     rupture behaviour. The fault is also segmented, with the segments possibly rupturing independently.
     Five scenarios have been modelled, ranging in severity from ‘basic’ (rupture only along the Wairarapa
     coast, magnitude about 8, return period about 400 years), to ‘upper limit’ (rupture extending into Cook
     Strait, magnitude close to 9, return period more than 1200 years). Only the ‘upper limit’ case is
     described here, as tsunami damage from the other scenarios is insignificant.
The earthquake loss model takes into account factors such as attenuation of ground shaking with
increasing distance from the earthquake origin, the amplification of ground shaking on soft soils, the
liquefaction potential of some soils, and the possibility of landsliding on steeper slopes.

Proprietary & Confidential                                                                    Page 4
Figure 1: Structure map of the southern Cook Strait region showing major active faults (after Barnes 2005). From northwest to southeast the highlighted faults are: (i) Wellington Fault; (ii) Wairarapa Fault; (iii) BooBoo Fault; (iv) Subduction Zone. Original image provided by NIWA. Proprietary & Confidential Page 5
Kapiti

                      Porirua                          Lower Hutt

                                                   Petone

                                      Wellington

Figure 2: Map of the main asset locations. The four areas involved in the tsunami inundation modelling
were Wellington, Lower Hutt (which includes Petone), Porirua, and the Kapiti Coast (Pukerua Bay to
Waikanae Beach). The red arrows indicate the alignment of the Wellington Fault.

Proprietary & Confidential                                                              Page 6
Tsunami
Historical Tsunami
The most significant distant source tsunami to affect Wellington Harbour and Cook Strait in historical times
are those caused by large South American earthquakes in 1868 (Mw ~9.1 southern Peru), 1877 (Mw ~9
northern Chile) and 1960 (Mw 9.4-9.5 southern Chile). However, their impact within Wellington Harbour
was minor.
The locally generated tsunami produced by the 1855 Mw 8.2 earthquake on the Wairarapa Fault was far
bigger and had far greater potential to cause damage, had the coastal area been inhabited. Maximum
known run-ups reached 3.5-5 m in parts of Wellington Harbour and Lyall Bay, 9-10 m (or more) in Palliser
Bay and 4-8 m along the Wairau Valley coast (South Island). Despite a high tide in Wellington and Cook
Strait at the time of the earthquake, very little damage was reported (Grapes and Downes 1997):
In Wellington Harbour, buildings along lowest parts of Lambton Quay (20-30 m away from and about
0.5-1.0 m above high tide) were inundated by 0.3-1.0 m
Fluctuations in water levels were noticed at many locations both in and outside the harbour
The road to the Hutt Valley was inundated, while a rapid rise in level in the Hutt River was probably
responsible for moving the already shake-damaged Lower Hutt bridge upstream
Fish were deposited well above high water mark in many places, most noticeably along the Cook
Strait coast from Lyall Bay to Otaki
The sand spit between Lyall Bay and Evans Bay was reportedly inundated in some places to a depth
of about 0.9 m, and the waters of the two bays met during the night (prior to the 1855 uplift the
isthmus was mostly low lying, and fortunately, unpopulated, with the few people living nearby
occupying sites on the sides of the hills).
Tsunami Modelling
The approach used to estimate tsunami losses firstly requires a source model of estimated co-seismic
seabed deformation for each earthquake scenario. This source model defines the physical characteristics
of the tsunami that serves as input into a tsunami propagation and inundation model (ANUGA), which is
then run for sufficient simulated time to allow the largest waves to reach the major urban locations. From
the output of this model the maximum water depths can be extracted, and are used to estimate the
tsunami losses using vulnerability functions.
ANUGA has been developed by Australian National University (ANU) and Geoscience Australia (GA), and
is a finite element hydrodynamic model. ANUGA models tsunami propagation and inundation by
assessing hydrodynamic flow across a 3-dimensional grid. This technique allows a very detailed appraisal
of water movement.
A key requirement to achieve the most accurate representation of tsunami inundation is a seamless
elevation model extending from the undersea tsunami sources to the on-land assets at risk. Creation of
such a model for the Wellington region and northern parts of the South Island required combining
bathymetry and topography data from a variety of sources. As no suitable digital bathymetric data were
available, it was necessary to digitize several NZ Bathymetry Charts and determine Mean Sea Level
(MSL) from tidal ranges. Datasets had to be revisited several times as bathymetric errors were detected
and corrected. Five nested areas, with varying grid cell size were developed to run the inundation model
and minimise computational run time. The areas were more detailed at waters edge and highly populated
areas but became (relatively) coarse in less crucial areas to allow for efficient modelling.
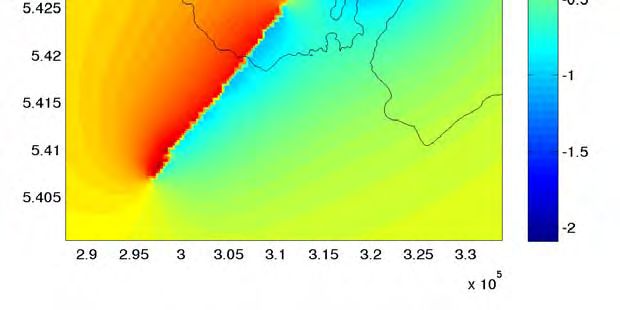
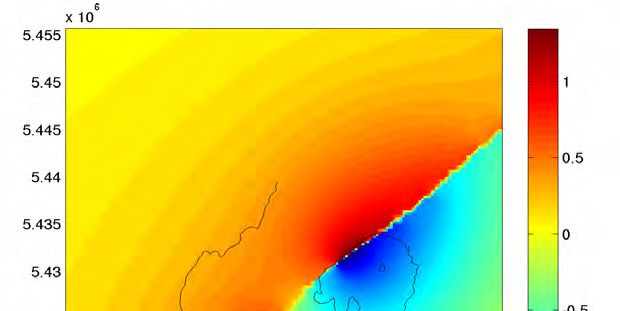
Proprietary & Confidential Page 7Topographic data were held in-house or sourced from local councils as 1 m contour lines or Lidar spot data for most inhabited areas. All topography data were checked and referenced to MSL. The topography contour data were checked for geometry errors and, where necessary, simplified. Surface roughness values, which affect the tsunami velocity across land, were derived from the UK Tsunami Risks Project and subsequently modified following a reconnaissance field trip to South Java after the 2006 tsunami (Cousins et al. 2006, 2007). The surface-roughness model was interpolated onto the modelling mesh within ANUGA. Tsunami source modelling from the faults shown in Figure 1 used the co-seismic surface vertical movement to initiate tsunami. It is standard practise to omit the strike-slip motion as a factor in the tsunami source. However, in the case of the Wairarapa Fault source it was noted that the horizontal movement of the steep-sided Cook Strait canyons by several metres might act as a secondary tsunami source, and this was incorporated into the source model for that fault. It was found that this contribution was small compared to the vertical effect – justifying the omission for the other sources where this effect is likely to be even smaller. For each tsunami source, the ANUGA model was run for a simulated time of 180 minutes, long enough to ensure the maximum water level is reached for local sources. Maximum water level during the 180 minute period was extracted on a regular 50 metre grid, which formed the basis of the loss modelling. Figure 3 illustrates the vertical deformations caused by the modelled Mw 7.5 earthquake on the Wellington fault. Figure 3: Vertical movement on the Wellington fault (metres) Proprietary & Confidential Page 8
Assets
There are approximately 160,000 residential and 20,000 non-residential buildings in the Wellington
Region. Ideally, we would know the location, value and vulnerability of each one of them, but such a
database is not currently available. Instead, we developed an asset database in which the resolution
varied in accordance with the proximity of the location to inundation and the type of data available. The
levels of resolution used varied from building, to property, to meshblock and area unit.

Assets data were sourced from local councils, QuotableValue NZ, GNS databases, and personal
knowledge. Floor areas were multiplied by estimated construction cost rates (Rawlinsons 2007) to give
replacement values. Average building heights were estimated from (floor area)/(site cover). The
aggregated replacement values and average heights were located at the centroid of each meshblock, and
subdivided into five use categories – commercial, industrial, other (e.g. schools, hospitals), agricultural
and residential.

Proprietary & Confidential                                                                 Page 9
Earthquake Vulnerability of
Buildings
Buildings of the Wellington Region were distributed amongst 34 vulnerability classes. The major
determinants of vulnerability were the construction type of a building, its age, its height, and the quality of
the design (classified as ‘sound’ or ‘deficient’).

By far the dominant type of residential construction in New Zealand is the light timber-frame, though a
wide range of cladding materials is used. Houses were placed in the ‘deficient’ category if they were of
pre-1960 age (when un-braced piles and heavy chimneys were common) or post-1980 age (when the use
of fragile cladding materials became widespread). Houses of unreinforced masonry construction (URM)
were treated separately. A small proportion of houses (about 1% in the Wellington Region), are
constructed from reinforced concrete masonry.

Workplace construction is far more varied than residential construction in both type of construction and
height. Medium-rise (4 to 7 storey) and high-rise (8 or more storey) buildings are nearly all of reinforced
concrete, but a few are steel-framed. Low-rise buildings may be of reinforced concrete, timber, steel-
framed, or URM.

The vulnerability classification scheme was simplified to just four classes for New Zealand-wide modelling:

                   pre-1980 reinforced concrete,
                   post-1980 reinforced concrete,
                   timber, and
                   URM.

The earthquake loss is obtained from Loss = DR x Replacement Value, where DR is the Damage Ratio, a
function of the intensity of shaking, = Cost to repair/Cost to replace. Figure 4 shows vulnerability curves
for URM and timber construction.

                       100.0%

                        10.0%
   Mean Damage Ratio

                        1.0%

                                                                      URM (standard)
                                                                      URM (strengthened)
                        0.1%
                                                                      Timber (deficient)
                                                                      Timber (sound)

                        0.0%
                                6   7          8                  9          10            11

                                                   MM Intensity

Figure 4: Sample vulnerability functions for damage due to earthquake shaking

Proprietary & Confidential                                                                      Page 10
Tsunami Vulnerability
A preliminary set of tsunami vulnerability functions were developed, based partly on code design
requirements for timber houses in New Zealand, partly on observed damage to timber and reinforced
concrete buildings in historical tsunamis, particularly the Java Tsunami of 17th July 2006, and on other
empirical data.
Tsunami waves exert a variety of forces on a structure, ranging from simple buoyancy to dynamic surge
and drag forces. Buoyancy forces may well dominate in a very long period tsunami from a distant source
when the rise in water level is slow and water velocities are low, but for short-period tsunami (as would be
expected from the local sources being studied here) surge forces are expected to dominate. The surge
force depends primarily on the depth and velocity of the impacting wave.
The tsunami vulnerability functions used in the loss estimation that follows are plotted in Figure 5. Given
the variability and sparseness of data there seems little justification for using anything other than straight
line estimates.
Losses from earthquake ground shaking and tsunami inundation have been identified separately.
Accordingly, a tsunami cannot damage a building further if it is already destroyed by earthquake shaking.
No account has been made of the impact of debris bombardment during the tsunami.
100%
Damage Ratio, 1 to 2 storey
80%
60%
40% Timber 1-storey small
Timber 1-storey large
Timber 2-storey small
20% Timber 2-storey large
Concrete 1-storey small
Concrete 1-storey large
0%
0 1 2 3 4 5
Water Depth (m above floor)
Figure 5: Tsunami vulnerability functions for low-rise timber and concrete buildings.
Proprietary & Confidential Page 11Results
As described earlier, four main earthquake and tsunami scenarios have been modelled. The main results
are shown in Table 1 and can be summarised as:
Post-earthquake tsunami do not significantly increase the PML loss from a Wellington Fault
earthquake
The second highest loss is due to shaking from the scenario Wairarapa Fault earthquake, for which
losses from the post-earthquake tsunami are insignificant in comparison
The combined shaking and tsunami loss from the ‘upper limit’ Subduction Zone to Cook Strait event,
at $8.4 billion, is substantially smaller than the Wellington Fault loss of $13.7 billion, though the
potential tsunami loss, at $2.3 billion, is significant.
Case Shaking Loss Shaking Loss (%) Tsunami Loss Tsunami Loss
($m) ($m) (%)
Wellington Mw 7.5 13,700 18 40 0.05
(base case)
Wairarapa Mw 8.2 9,200 12 14 0.02
BooBoo Mw 7.4 800 1 1 0.00
Subduction to 6,100 8 2,300 3.00
Cook Strait Mw 8.9
Table 1: Summary earthquake shaking and tsunami losses. The losses are expressed as both $millions
and percentages of the total asset value of $77 billion.
The results shown above incorporate standard vulnerability functions but with a 100% increase in tsunami
vulnerability for those buildings experiencing prior earthquake damage. Further explanation of the
sensitivity testing of the assumptions used are provided in a subsequent section.
The return periods for the combined shaking and tsunami losses from the Wellington and Wairarapa
cases are more than 700 and 1000 years, respectively, because above-average shaking scenarios were
chosen for each. For the BooBoo case the tsunami-generating features of the fault were exaggerated. The
return period for the Subduction to Cook Strait case is more than 1200 years, because that case was
based on an extension (into Cook Strait) of a near worst-case fault model with a return period of about
1200 years. Additionally, all tsunami were modelled to occur at high tide. These assumptions all imply that
the return periods given here are very conservative.
Proprietary & Confidential Page 12100
90
80
Percentage of tsunami loss
70
60 Kapiti
Porirua
50
Hutt
40 Wellington
30
20
10
0
Wellington, Mw 7.5 Wairarapa, Mw 8.2 BooBoo, Mw 7.4 Subdn to Cook
Strait, Mw 8.9
Tsunami source
Figure 6 : Percentage of tsunami loss for each region by event.
Essentially all the tsunami losses in these scenarios occurred in the Wellington and Hutt areas, with
virtually no potential losses in the Porirua and Kapiti areas. This is clearly shown in Figure 6, which
illustrates the percentage loss from each event for each region modelled.
The contribution of the various occupancy types in the region to the tsunami losses generated by the
Subduction Zone Mw 8.9 event have been plotted below.
7%
12%
Commercial
Industrial
10%
Other
Agricultural
Residential
0%
71%
Figure 7: Distribution of losses by occupancy type for tsunami generated on the Subduction to Cook
Straight Mw 8.9 earthquake.
Figure 7 clearly illustrates that the majority of loss is generated by the residential portfolio, with the other
occupancies contributing comparatively minor amounts. This is a function of not only the comparative
vulnerability of the construction types typifying these risks, but also the geographic distribution of the risks
and their preferential location in areas inundated by the tsunami.
This result suggests that the tsunami loss potential will vary markedly between insurance portfolios, with
occupancy and geographic distribution the crucial factors in determining the risk faced by any particular
organisation.
Proprietary & Confidential Page 13Sensitivity Testing
Given that much of the science presented here is new, with some poorly-constrained assumptions, a
number of sensitivity tests have been undertaken. All of these tests have been conducted on the
subduction zone event as this scenario produced the largest tsunami losses.
Prior Damage
The tsunami vulnerability functions shown in Figure 5 assume no prior damage to buildings by earthquake
shaking. While there is no information available on the effects of prior earthquake damage on tsunami
damage to buildings, if we assume that earlier damage increases tsunami damage by 50%, sensitivity
testing suggests the relative tsunami loss would increase by only 5%. Similarly, if it was assumed that
prior earthquake damage increased tsunami damage by 100%, then relative tsunami loss would increase
by about 9%. The losses given in Table 1 include the 100% increase in the tsunami vulnerability function.
Structure Quality
In order to test the assumptions surrounding the vulnerability functions used in the modelling, the four
curves described earlier have been modified to represent High and Low levels of vulnerability as well as
the Standard curves discussed previously (Figure 8).
Standard
High
Low
Relative Tsunami Fragility
3,000
Tsunami Loss ($millions)
2,500
2,000
1,500
1,000
500
0
1 1.5 2 2.5
Depth to Cause Total Loss of Small Timber Building (m)
Figure 8: Effect of variation in vulnerability function on estimated tsunami losses (case Subduction to
Cook Strait, Mw 8.9) for a small timber building.
It is worth noting that the x-axis in this graphic is shown as the depth to cause total loss to a small timber
building. This represents the steepness of the curve used in each example. The results illustrate that the
Standard curve used in the modelling appears to be a good approximation of mid range vulnerability, with
both extremes varying an acceptable level from the base case.
Floor Height
The assumption made previously is that all buildings have a floor height of 0.5 m; that is, the tsunami
water is 0.5 m deep before any damage occurs to the structure. Figure 9 shows the change in the results
created by varying the floor height from 0-1.0 m.
Proprietary & Confidential Page 14Significant variations in estimated losses occur with variations in average floor height. As we have no
detailed information on actual floor heights, it is difficult to judge the importance of this range in loss
estimates. It is worth noting that no allowance has been made for damage in sub-floor areas, such as
basements and under-floor areas of houses.
3,500
3,000
Tsunami Loss ($millions)
2,500
2,000
1,500
1,000
500
0
0 0.25 0.5 0.75 1
Ground Floor Height (m above ground)
Figure 9: The effect of average floor height on tsunami losses generated by an Mw 8.9 earthquake on the
Cook Straight Subduction zone.
Proprietary & Confidential Page 15Conclusions The potential loss estimates published in 2005 for Tsunami in New Zealand caused significant concern in the insurance industry. The magnitude of those losses suggested that the common approach of determining reinsurance needs based on the Wellington earthquake shake loss may have underestimated the true risk. The results reported here suggest that the Wellington earthquake event still represents a reasonable benchmark for risk assessment purposes, with the combined earthquake and tsunami loss generated for four key earthquake scenarios either adding little to the Wellington event itself, or accumulating to significantly less than that earthquake on a stand alone basis. Further investigation is required to determine potential losses from South America and other distant tsunami sources. Proprietary & Confidential Page 16
Contributors
Jim Cousins

William Power

Umut Destegul

Andrew King

Contacts
GNS Science
Jim Cousins                  T: +64 4 570 4705    E: j.cousins@gns.cri.nz

William Power                T: +64 4 570 4681    E: w.power@gns.cri.nz

Andrew King                  T: +64 4 570 4749    E: a.king@gns.cri.nz

Aon Benfield
Richard Trevethick           T: +94 9 302 9583    E: richard.trevethick@aonbenfield.com

Brad Weir                    T: +61 8 9242 7366   E: brad.weir@aonbenfield.com

Russell Blong                T: +61 2 8209 4288   E: russell.blong@aonbenfield.com

Ben Miliauskas               T: +61 2 8209 4249   E: ben.miliauskas@aonbenfield.com

Proprietary & Confidential                                                        Page 17
References
Barnes, P.M. 2005. “The southern end of the Wairarapa Fault, and surrounding structures in Cook Strait”.
     Proceedings of the Wairarapa Earthquake Sesquicentennial Symposium, 8-10 September 2005, Te
     Papa, Wellington. pp 66-71.

Cousins, W.J., Power, W.L., Palmer, N.G., Reese, S., Tejakusuma, I.G. & Nugrahadi, S. 2006. “South
      Java tsunami of 17th July 2006, Reconnaissance Report”.GNS Science Report 2006/33. 42p.
      (copies available from j.cousins@gns.cri.nz)

Cousins, W.J., Power, W.L., Palmer, N.G., Reese, S., Tejakusuma, I.G. & Nugrahadi, S. 2007. “Damage
      and casualties in the South Java Tsunami of 17th July 2006”. Proceedings, 2007 Conference of the
      New Zealand Society for Earthquake Engineering, 30 March – 1 April 2007, Palmerston North. New
      Zealand Society for Earthquake Engineering. Paper No. 32. (copies available from
      j.cousins@gns.cri.nz)

Grapes, R. and Downes, G., 1997. “The 1855 Wairarapa, New Zealand, Earthquake – analysis of
     historical data”. Bulletin of the New Zealand National Society for Earthquake Engineering,
     30(4):271-368.

Rawlinsons, 2007. New Zealand Construction Handbook. Rawlinson Media Limited, Auckland.

GNS Science
Institute of Geological and Nuclear Sciences Limited (New Zealand)
GNS Science Disclaimer: The modelling described in this report was carried out by the Institute of Geological and Nuclear Sciences Limited (GNS
Science) exclusively for and under contract to Benfield (NZ) Limited. Unless otherwise agreed in writing, all liability of GNS Science to any party other
than Benfield (NZ) Limited in respect of the modelling is expressly excluded.

© Benfield Limited (for itself and on behalf of each company within its group of companies) (Trading as Aon Benfield) Aon Benfield reserves all rights to
the content of this document. This document is provided exclusively for the use of the directors and employees of the organisation to which it was
originally delivered. Copies may be made by that organisation for its own internal purposes, but no part of this document may be made available to any
third party without both (i) Aon Benfield’s prior written consent and (ii) that third party having first signed a “recipient of report” letter in a form acceptable
to Aon Benfield. Aon Benfield will accept no liability to any third party to whom this document is disclosed whether in compliance with the preceding
sentence or otherwise. This document does not constitute any form of legal, accounting, taxation regulatory or actuarial advice. Without prejudice to the
generality of the preceding sentence this document does not constitute an opinion of reserving levels or accounting treatment. The recipient
acknowledges that in preparing this document Aon Benfield may have based analysis on data provided by the recipient and/or from third party sources.
This data may have been subjected to mathematical and/or empirical analysis and modelling. Aon Benfield has not verified, and accepts no
responsibility for, the accuracy or completeness of any such data. In addition, the recipient acknowledges that any form of mathematical and/or
empirical analysis and modelling (including that used in the preparation of this document) may produce results which differ from actual events or losses.
Where this document includes a recommendation or an assessment of risk, the recipient acknowledges that such recommendation or assessment of
risk is an expression of Aon Benfield’s opinion only and not a statement of fact. Any decision to rely upon any such recommendation or assessment will
be solely at the risk of the recipient, for which Aon Benfield accepts no liability, and the recipient acknowledges that this document does not replace the
need for the recipient to make its own assessment. Aon Benfield will not be liable, in any event, for any special, indirect or consequential loss or
damage of any kind (including, but not limited to, loss of profit and business interruption) arising from any use of the information contained in this
document. Benfield Limited is authorised and regulated by the Financial Services Authority under the reference number 311884.

Proprietary & Confidential                                                                                                              Page 18
You can also read


