GENERATION ZERO'S VISION FOR A PROSPEROUS LOW CARBON CAPITAL - V1.1 17/9/13
←
→
Page content transcription
If your browser does not render page correctly, please read the page content below
GENERATION ZERO'S VISION FOR A PROSPEROUS LOW CARBON CAPITAL

                                                          V1.1 17/9/13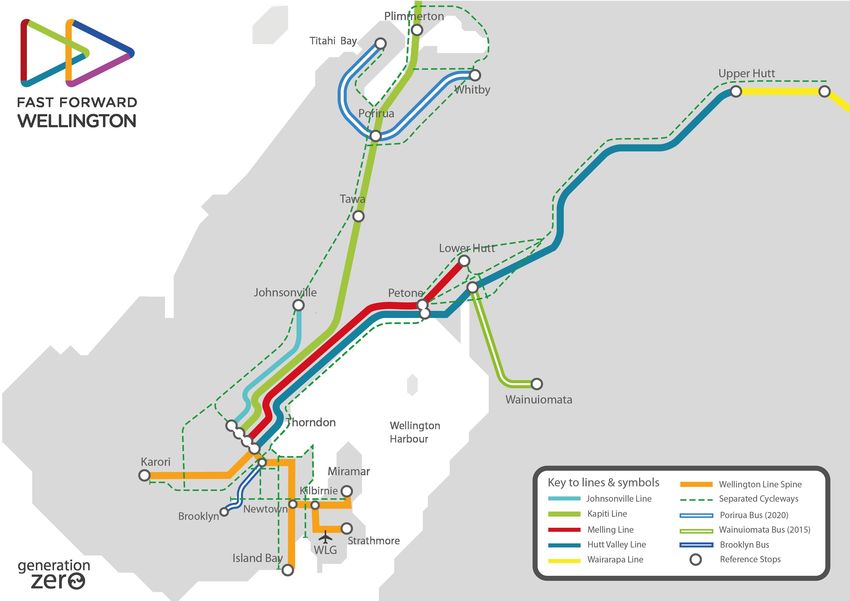
1. Introduction                                                                              2. The current plan – pause and rewind?

Generation Zero is a rapidly growing nationwide network of thousands of                      The region's future is dominated by central government plans for an enormous
young people passionate about the solutions to climate change.                               state highway expansion: the Wellington Northern Corridor RoNS, which
                                                                                             includes the Kapiti Expressway, Transmission Gully, the Basin Reserve
As young people, we also want to live in cities that are moving with the times.              Flyover and more. This series of projects comes with a total estimated price
Smart, cool and modern cities - vibrant and creative, with a great quality of                tag of more than $3 billion. Almost all components have an official benefit-cost
life.                                                                                        ratio of less than one.1

The great thing is that we can have both. We believe the cities embracing the                According to the recently released “baseline forecast” from Opus,
low carbon transformation early and wholeheartedly will be the prosperous,                   commissioned by GWRC,2 simply proceeding with the RoNS plus all other
competitive cities in the 21st century. Many already are: cities such as London,             currently planned projects would fail on virtually all key outcomes sought by
Perth, Portland, Copenhagen and New York.                                                    the regional transport strategy,3 resulting in:

If there's one area that is vital to transforming our cities, it's transport. There is          •   Reduced mode shares for public transport, pedestrians and cyclists;
so much more to our transport system than simply how fast we can get
                                                                                                •   Increased greenhouse gas emissions;
around – it’s about how our city will grow, the health of its people and
economy, the look and feel of the city and the opportunities it creates. It's                   •   Increased congestion;
about providing freedom of choice to those – particularly young people – who                    •   Slower average freight speeds.
are driving less or not at all and don't want to be shackled to a car and rising
fuel costs.                                                                                  The forecast decrease in public & active transport and increased congestion
                                                                                             in Wellington city are cited as direct results of the RoNS encouraging a shift to
Wellington is well-placed to lead. It is one of the most compact cities in the               car travel.
world, helping create an environment where ideas, innovation and new
business opportunities can flourish. In the New Zealand context it has some of               In our view, the plan is outdated and broken. Based on the real transport
the best and most highly utilised public transport services, particularly our rail           trends over the last decade4 we are sceptical about the forecast traffic growth
network to the north. These things are fundamental to what makes Wellington                  – but this is certainly more likely if the huge road expansion goes ahead,
'cool' and a great place to live.                                                            encouraging sprawl and induced traffic. And if the growth does not occur for
                                                                                             any reason then the economic case for the roads is further undermined.
Today, our city and region are facing some big choices about its future. We're
concerned that Wellington is heading down the wrong road.                                    Most importantly to us, the plan will do almost nothing to help build a low
                                                                                             carbon Wellington – in fact it will work against it.

FAST FORWARD WELLINGTON V1.1 17/9/13                                                     2
3. What about the Public Transport Spine Study?                                        3. The study seems to lack a long-term, network-wide perspective. Going
                                                                                          with buses for the Wellington City spine would lock in the “broken spine”
The PTSS was undertaken to help determine a “high quality public transport                approach where train commuters from centres like Johnsonville and the
solution” along Wellington's “growth spine” from Johnsonville to Kilbirnie –              Hutt cities are dropped off at the edge of the Wellington CBD and forced to
addressing in particular the severe bus congestion along the Golden Mile. The             transfer to reach their final destination. This will remain a barrier for many
two leading contenders were light rail and “bus rapid transit” (BRT). Neither             travelers. Light rail physically integrated with the Railway Station enables
solution is included in the Opus baseline forecast.                                       the possibility of continuous tram-train services in the future from the
                                                                                          northern centres all the way through to Kilbirnie and eventually the airport.
The study concluded that BRT was the best option, recommending a split
route from Wellington Railway Station to Newtown and Kilbirnie splitting at the        4. The split route chosen resulted in an inflated cost of $940m for light rail as
Basin Reserve. The official line is that the project can't even get underway for          a result of a dedicated third tunnel through Mount Victoria, plus an extra
at least another nine years.                                                              3km or so of track compared with a single route to Kilbirnie through
                                                                                          Newtown. There are alternatives that we believe are cheaper and better,
However, we believe both the solution being pushed and the study itself have              such as using Constable Street. We estimate this would cost around
serious flaws. Some of the key reasons are:                                               $400m based on a similar cost per kilometre.

1. The option being proposed is really “BRT-lite”. Having the buses mix with           We aren't light rail evangelists – we just want the best solution for Wellington.
   general traffic in places (e.g. through the proposed second Mount Vic               But it appears BRT as proposed in the spine study won’t deliver the step
   tunnel) will cause delays. And by avoiding having passing lanes at stops            change desired and will just kick a real solution off into the future, while in the
   and flyovers at some intersections, the network capacity is constrained,            meantime we spend billions of dollars on more roads.
   coming out significantly below a light rail network. The study actually says
   that BRT would already be over capacity from day one – hardly “high                 Altogether, the story is that Wellington is being sold a lemon – a $3B+
   quality”.                                                                           highway expansion that will drive more traffic into the city, won't solve
                                                                                       congestion and will undermine regional transport goals; plus a sub-standard
2. The study predicts a very low growth in public transport ridership: even for        public transport solution that doesn't deliver capacity for growth. We think
   the “best case” of BRT, just a 9.3% increase in PT trips from south and             Wellington deserves better. We need a real long-term transport vision.
   south-east areas from 2021-2041, giving an overall regional increase of
   just 1.4% (just making up for the reduction caused by the RoNS). If the             What if there were a smarter plan that could deliver good outcomes for
   growth were in fact higher – in line with Wellington's strategic transport          everyone and move Wellington forward to a prosperous low carbon future?
   goals – then the capacity problems with BRT described in the previous               Working with some independent transport experts we had a crack at
   point would get much worse.                                                         developing one. Over the page is a visualisation of what this could look like.

FAST FORWARD WELLINGTON V1.1 17/9/13                                               3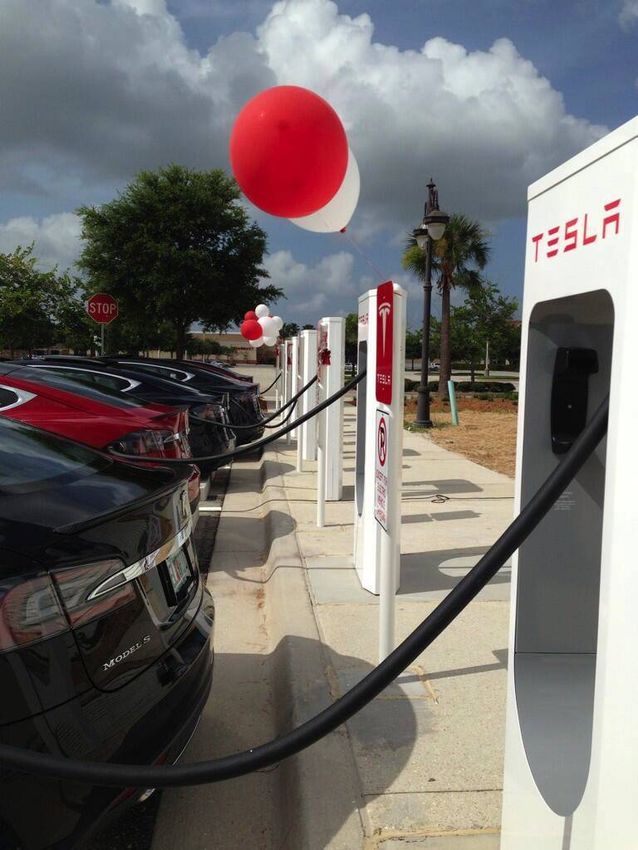
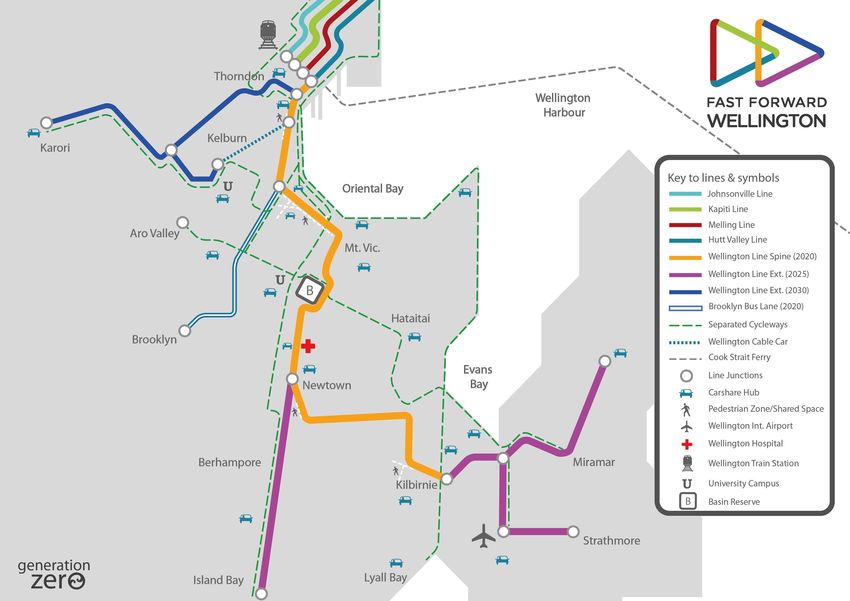
4. Our vision - Fast Forward Wellington Island Bay and Karori. In the interim these lines could be bus-only lanes
connecting to the rail spine for transfers and some through-services.
Fast Forward Wellington is about getting on and building a holistic low carbon
transport system right now. As mentioned in section 3, over time there is the possibility of introducing
continuous tram-train services from the existing heavy rail network onto
We are not claiming this is the perfect plan down to every fine detail – the the new light rail network, with some modifications required. The light rail
options and the precise routes are of course up for debate. But it's a realistic line should be built with this in mind.
and achievable vision intended to spark a conversation: would we prefer the
status quo, or something like this? We also propose some separated bus routes: a full divider-segregated bus
lane through Porirua, and peak-hour bus-only lanes for Brooklyn and
Fast Forward Wellington revolves around three big ideas. Wainuiomata.
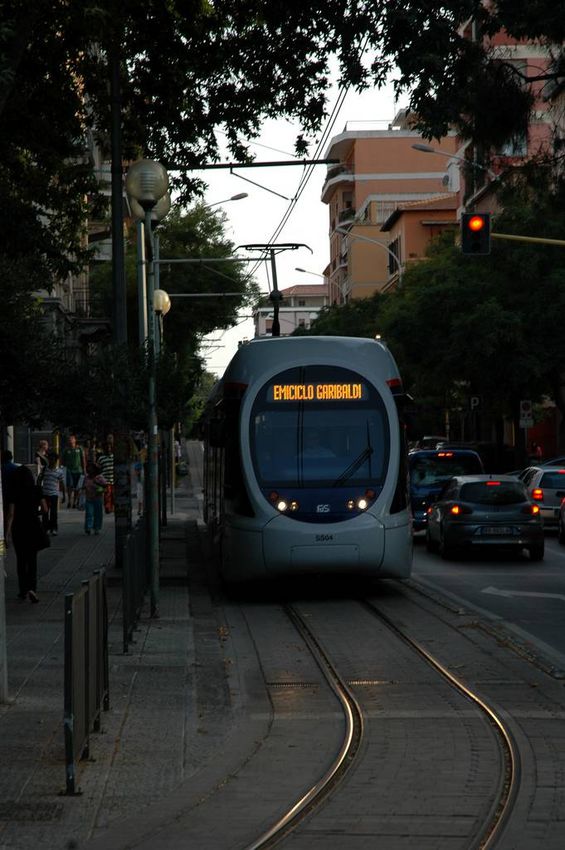
1) A “congestion free” transit network connecting key centres with dedicated 2) A comprehensive “Copenhagen-style” cycleway network throughout urban
public transport corridors. centres.
This means giving people the choice This means giving people the
of high frequency PT services choice of a safe and pleasant trip
physically separated from congestion, by bike with protected bike-only
like we see in so many cities around corridors.
the world. This can be a combination
of light rail and buses, but we think Our proposed network would see
light rail is the best choice for the main about 150 km of segregated
spine for reasons explained in cy cl e w a ys b u i l t t hr ou g h ou t
sections 3 and 5. Wellington, Porirua and the Hutt
Cities. This would be in
The first step is to build light rail on conjunction with more on-road
our alternative spine route from the cycleways and traffic-calming
Railway Station to Newtown then on measures to make the streets
to Kilbirnie over Constable St. If we safer. With adequate funding of about $20 per resident per year matched by
move fast, we believe this could be central government this could all be completed within a decade.
completed by 2020. The network can
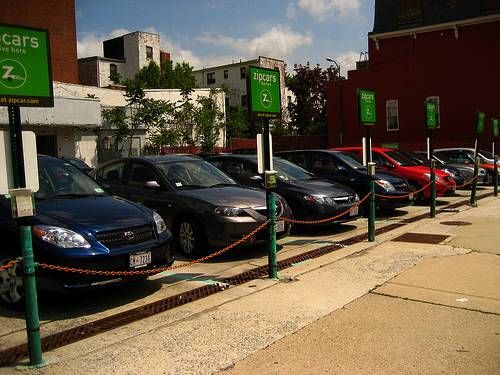
3) A city- or region-wide car share system.
then be extended outwards over
future years, to the airport, Miramar,
FAST FORWARD WELLINGTON V1.1 17/9/13 6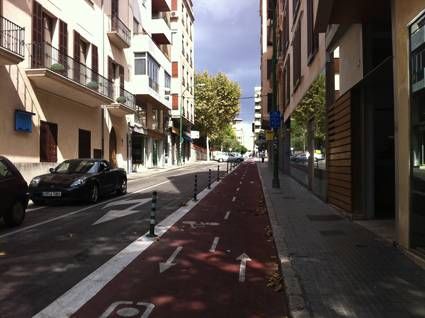
This means giving people an option          In the CBD, Lambton Quay, Courtenay Place and Manners St could become
                                            of not owning a car but still having        car-free, with pedestrians and cyclists sharing the space with light rail. In
                                            the service available when they             Newtown, Riddiford St between Rintoul St and Constable St could become a
                                            need one. In a car share scheme,            low-speed shared space or a timed car-free zone, as could the Kilbirnie
                                            people pay a subscription plus a            shopping area on Rongotai Rd and Bay Rd.
                                            per-use fee, and can rent a car for
                                            minutes, hours or days at a time            Additionally, building several pedestrian and cycling overbridges or
                                            with little notice required.                underpasses to avoid heavy traffic areas – particularly around the Basin
                                                                                        Reserve, and Wakefield & Cable Streets – would further improve Wellington's
                                            The world's leading car sharing             walkability.
                                            network is Zipcar, with over 800,000
                                            members and nearly 10,000                   5) Major improvements to the existing northern rail services.
                                            vehicles available throughout the
                                            US, Canada, the UK, Spain and               In addition to the potential for developing continuous tram-train services from
                                            Austria. A NZ-owned company                 the north through the CBD, there are a number of initiatives that could be
                                            called CityHop currently operates           taken to make train services more frequent, more reliable and more appealing
                                            two shared vehicles in Wellington           – some of which are underway or under investigation by GWRC. These
                                            and is looking at adding a third in         include:
                                            Newtown.
                                                                                            •   Electrification further north to Otaki and north of Upper Hutt;
                                           Our proposal would see upwards of                •   New stations in places such as Raumati South;
   200 vehicles rolled out across greater Wellington, making it a world-leader
   in car sharing. Furthermore, we propose at least half of these could be full             •   Double-tracking in bottlenecks such as between Trentham and Upper
   electric vehicles, with the rest plug-in hybrids or other high fuel efficiency               Hutt;
   vehicles.                                                                                •   Integrated ticketing.

Other components
                                                                                        There are also a huge range of more minor improvements that could be made
                                                                                        such as more cycle lockers, more parking at park & ride facilities, route
Complementing these three big ideas, our vision involves two other key
                                                                                        improvements, platform improvements, seating at stations, and speed and
components.
                                                                                        safety improvements.
4) Several new pedestrian zones and shared spaces.

FAST FORWARD WELLINGTON V1.1 17/9/13                                                7
5. The Prize • Up to 2% increase in property values along the whole length of the
cycleway, again resulting in more rates for the city.12
By focusing our efforts and investments on building real alternatives to car
dependence, we believe our Fast Forward Wellington proposal would deliver Car Sharing:
greater benefits for all Wellingtonians than the status quo would. The • For every car sharing vehicle put in place, between 9 and 13 vehicles
components of the system will work on their own and together to deliver better are dropped by owners in the area,13 helping liberate parking space for
transport outcomes, grow a cleaner and leaner economy, and build on other uses such as cycleways and PT lanes. 80% of the cars dropped
Wellington's strengths as a compact, liveable city. are households becoming car-free, resulting in higher active transport
and PT ridership as well.
Here are some of the outcomes we could expect based on international
• A large increase in average fuel economy as the cars tend to be newer
experience.
and more efficient (especially if electric vehicles are used).
Light Rail Transit:
Pedestrian Areas:
• As many as 40% more PT riders, 16% in the first seven years. 5 This
means more revenue and potential for fare reductions. • 49% fewer commercial vacancies, 14% increase in retail sales around
• An 8% to 25% increase in commercial and residential property values new seating areas, and up to 170% increase in retail sales around
around stations,6 resulting in an uplift of around $2.5b in value on the pedestrianized zones where parking is removed.14
main spine route alone.7 This also means more rates for the city,
Overall:
helping to pay back the investment.
• More money recirculating in the local economy rather than paying for
• Between 33% (one year) and 71% (multiple years) increase in retail
imported oil and cars. For Wellington City alone, the amount leaving
sales along the route.8
the economy each year to pay for oil for transport is over $150 million,
• Faster travel speeds for all commuters – car, PT and pedestrian.9 or roughly $750 per person.15 The AA estimates the average car
operating cost per year is $7,400 to $15,000, 16 most of which leaves
Cycleways: the local economy.
• Up to 180% more Wellingtonians trying out their commute by cycling, a • Productivity and innovation have been found to correlate with density,
37% decrease in injury crashes along cycle routes, and a 49% so long as the city has good transport connections.17
increase in retail sales along the routes.10
• Health benefits through more physical activity and less air pollution.
• A large hike in cycling mode share – Seville, Spain experienced growth
from 0.5% of trips in 2006 to 7% today as a result of building about • And of course, reducing Wellington's carbon emissions to tackle the
130 km of separated cycleways.11 urgent challenge of climate change.
FAST FORWARD WELLINGTON V1.1 17/9/13 86. The cost This is a large sum of money, but it needs to be put in perspective.
The estimated investment for all components out to 2030 are as follows. First, it is proposed over a time window of 15-20 years. The Auckland
Council's Integrated Transport Plan is proposing a spend of $60bn over 30
Item Total cost Notes/assumptions years and the Government has committed in principle to at least $10bn of this.
Light rail: total of $1.4bn Approx. cost per km from Public Transport Second, by comparison, the projected total spending in the scope of view on
23 km at Spine Study, excluding tunnels. Includes the Wellington RoNS (Transmission Gully, Kapiti Expressway, Petone-
$60m/km contingency of ~30%. Main spine from Grenada Link, Basin Reserve Flyover, second Mt. Victoria tunnel, second
Railway Station to Kilbirnie is $400m. Terrace tunnel) plus the BRT option for the PT spine comes to more than
Bus lanes in $40m $3.7 billion.19
Porirua, Wainui,
Brooklyn If the majority of this was scrapped in favour of sensible improvements to the
regional road network, that would free up more than enough funds for what we
Approx. 150 km $150m Generous estimate based on €0.5m/km for
are proposing with Fast Forward Wellington.
fully separated Dutch cycleways. Consistent with estimate
cycleways at for Island Bay cycleway. Auckland Cycling
It comes down to a choice: what sort of future do we want to
$1m/km Action Plan quotes generic average cost of
build for the next generation, and will our elected leaders be
$150,000 per km of cycle facility.18
bold enough to stand up for it and make it happen?
Car share $100m Imprecise. Generous allowance for initial
scheme investment to buy up to ~500 cars and
license carshare technology – other options
exist such as public-private partnership or a
scheme using existing private cars. Would
pay back through revenue.
Pedestrian $150m
bridges &
pedestrianization
Northern rail $1-1.5bn Proposed fund, imprecise.
improvements
TOTAL $2.8-3.3bn
FAST FORWARD WELLINGTON V1.1 17/9/13 91 Pickford, M. (2013). State Highway Investment in New Zealand – the decline and fall of economic efficiency, Policy Quarterly,Volume 9, Issue 3. http://igps.victoria.ac.nz/publications/files/30aaf9a4518.pdf 2 Opus International Consultant (2012), Wellington Transport Models TN24: Baseline Forecasting Report. 3 Greater Wellington Regional Council (2010), Wellington Regional Transport Strategy 2010-2040, Chapter 6. 4 See http://transportblog.co.nz/2013/04/30/trends-in-vehicle-travel-in-nz/ for national statistics and http://thedailyblog.co.nz/2013/09/03/trainspotting-latest-motorway-madness/ for a Wellington graph. 5 Tennyson, E. L. (1989). Impact on Transit Patronage of Cessation or Inauguration of Rail Service. Transportation Research Record, 1221, 59–70. Henry, L. (2012). Comparative examination of New Start light rail transit, light railway, and bus rapid transit services opened from 2000. Henry, L., Litman, T., Authority, C. M. T., & Austin, T. (2006). Evaluating new start transit program performance: Comparing rail and bus. Victoria Transport Policy Institute. Retrieved from http://www.vtpi.org/bus_rail.pdf 6 Debrezion, G., Pels, E., & Rietveld, P. (2007). The Impact of Railway Stations on Residential and Commercial Property Value: A Meta-analysis. The Journal of Real Estate Finance and Economics, 35(2), 161–180. 7 Pettit, T. (2013, 28 August). Realistic light rail cost is needed. The Dominion Post. http://www.stuff.co.nz/dominion-post/comment/9093288/Realistic-light-rail-cost-is-needed 8 New York City Department of Transport (2012). Measuring the Street: New Metrics for 21st Century Streets. Clower, T. L. & Weinstein, B. L. (2007). Economic and Fiscal Impacts of Dallas Area Rapid Transit Operations and Capital Expenditures. 9 NYDOT (2012). 10 NYDOT (2012). 11 See http://lcc.org.uk/pages/seville-goes-dutch 12 Racca, D. P. & Dhanju, A. (2006). Property Value/Desirability Effects of Bike Paths Adjacent to Residential Areas. Prepared for Delaware Center For Transportation 13 Martin, E. & Shaheen, S. (2011). The Impact of Car Sharing on Household Vehicle Ownership. Access, Number 38. 14 NYCDOT (2012) 15 Calculated from transport emissions in WCC 2013 Climate Change Action Plan with importer cost of roughly $1/litre http://www.med.govt.nz/sectors-industries/energy/liquid- fuel-market/weekly-oil-price-monitoring 16 http://www.horizons.govt.nz/assets/Uploads/Events/Passenger_Transport_Committee_Meeting_/2012-11-20_100000/12-182-Ann-A-Levin-Commuter-Bus-Review.pdf 17 http://blogs.smithsonianmag.com/ideas/2013/06/why-living-in-a-city-makes-you-more-innovative/ http://www.dol.govt.nz/news/media/2011/study-links-firms-productivity-population-with-spending.asp 18 http://www.aucklandtransport.govt.nz/improving-transport/strategies/TransportStrategies/Documents/Original/cyclingactionplan.pdf 19 Greater Wellington Regional Council (2012). Regional Land Transport Programme 2012-2015. See Tables 4 & 5.
You can also read