JOBS AND COMMUTING IN OUTER GROWTH SUBURBS - National Growth Areas Alliance
←
→
Page content transcription
If your browser does not render page correctly, please read the page content below
JOBS AND
COMMUTING
IN OUTER
GROWTH
SUBURBS
A report for the National Growth
Areas Alliance

28 July 2020
PAGE 2

Contents

               1. Overview - jobs, commuting and our outer growth
                  suburbs
               2. The commuting impact - cost and time
               3. Outer growth suburbs - commute overviews
               4. The future commute - new ways of working for the
                  outer growth suburbs
               5. End Notes - Methodology and references

                         For complete breakdown of methodology and references, see end notes.

PAGE 3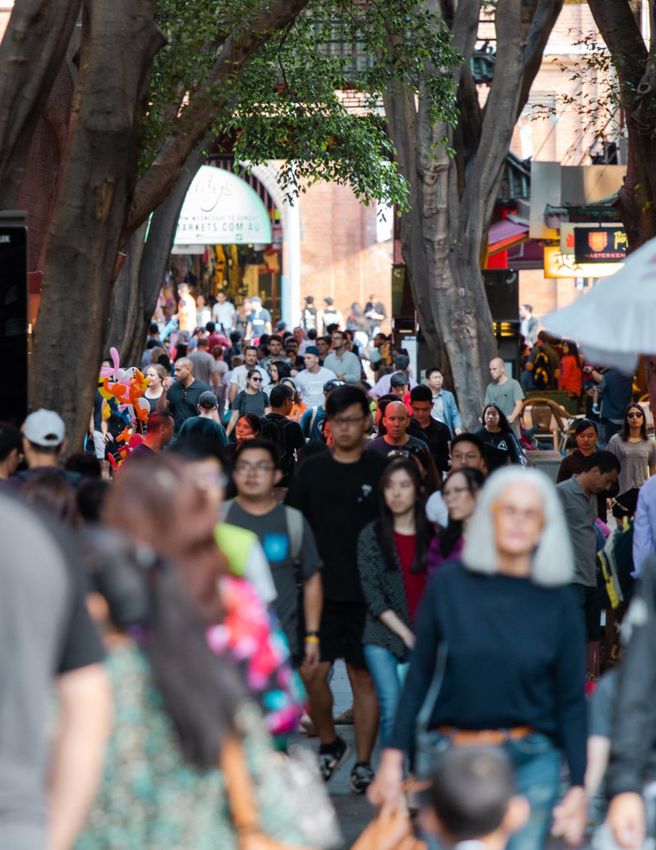
Changing the way we work

    COVID-19 has had a significant impact on the way we work. Three-quarters of businesses have changed
    the way they operate1, and thousands of people made a sudden shift to working from home.

    Working from home has been enabled not only in industries with largely desk-based jobs, but also in
    occupations that are typically face-to-face – health professionals providing telehealth consults and
    educators teaching online. How we do our work is being reimagined.

    One of the widespread outcomes of people working from home is more time at home as commuting was
    reduced. Nowhere has this impact been more notable than among people living in Australia’s outer
    growth suburbs, where employment is characterised by long commutes. There is also the additional
    benefit of no longer spending money on travel, which again for our outer growth suburbs where
    commuters largely drive can be considerable when adding vehicle running costs, tolls and parking.

    The impact of the commute is of particular interest for the National Growth Areas Alliance (NGAA), who
    advocate for ensuring outer urban growth areas have the infrastructure and investment needed to reach
    their potential.

    This report looks at what we know about the impact on time and costs for commuting and what a new
    future, where remote and flexible work is maintained and grown, will provide for people living in outer
    growth suburbs.

PAGE 4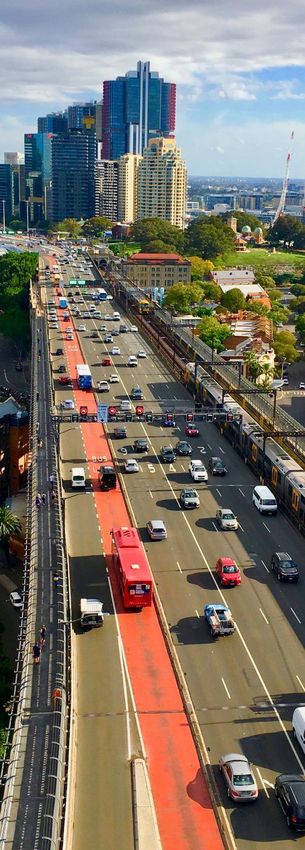
Australia’s Growth Suburbs
    Outer growth suburbs are those located on the urban fringe of Australia’s metropolitan areas. They are
    characterised by significant greenfield (new) development areas, and are experiencing relatively rapid
    population and urban development growth.

    Local Government Areas (LGAs) identified as outer growth areas across Australia are:

           NSW                     VIC                 SA                   WA                    QLD

     Blacktown            Cardinia             Playford              Armadale             Ipswich

     Camden               Casey                Mount Barker          Cockburn             Logan

     Campbelltown         Hume                                       Gosnells             Moreton Bay

     Liverpool            Melton                                     Kwinana              Redland

     Penrith              Mitchell                                   Mandurah

     The Hills Shire      Whittlesea                                 Rockingham

     Wollondilly          Wyndham                                    Serpentine-
                                                                     Jarrahdale
                                                                     Swan

                                                                     Wanneroo

PAGE 5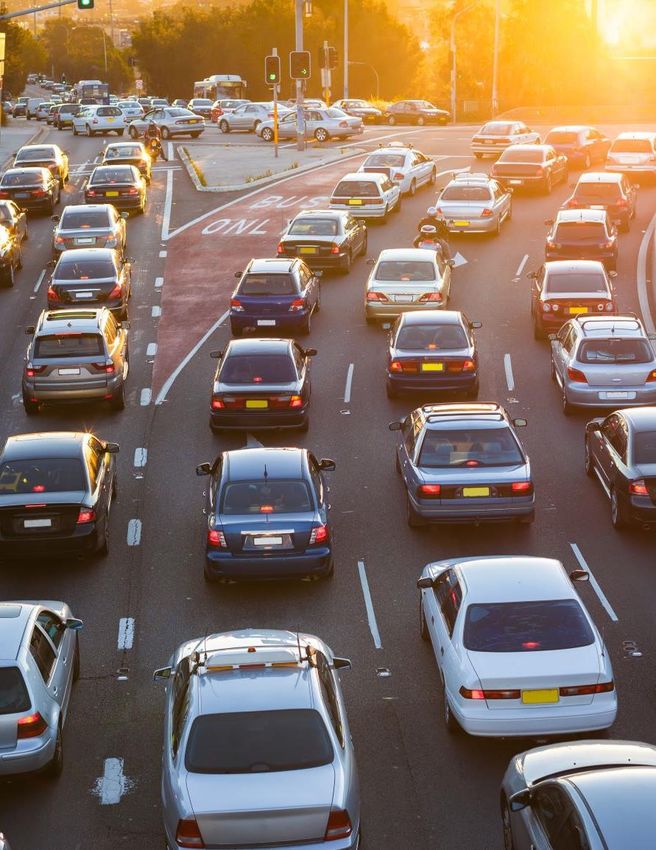
Top 5 insights for action

           1                      2                    3                    4                     5
      Four out of five      Men in outer growth   Three out of four   The average daily       There are an
      workers in outer       suburbs are more     commuters from      cost just to get to   estimated half a
      growth suburbs          likely to do long     outer growth      and from work in      million workers in
    have to travel out of        commutes         suburbs drive to      outer growth          outer growth
    their community for         compared to             work           suburbs is $36       suburbs who are
            work                   women                                    by car           doing jobs that
                                                                                            could be done at
                                                                                                   home

PAGE 6
The commuting impact
    Cost and time

PAGE 7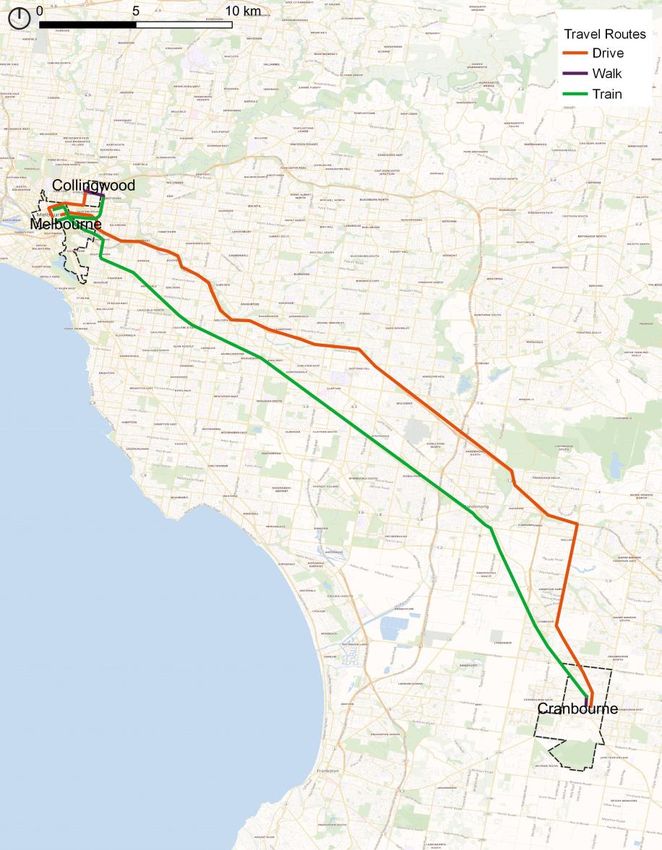
Workers in outer growth suburbs experience
    significant commutes
    4 out of 5 workers travel more than 5km to get to work

    What stands out for people living in outer growth suburbs is that the most common commute is 10-30 kms and a significant
    proportion travel 30km or more to get to work – that’s just in one direction.

    For commuters in outer growth suburbs,
    even a 5km commute from a growth suburb
    with poor roads and inadequate public transport
    connections can take a long time.

    Most workers in outer growth
    suburbs have to travel between
    10 to 30km just to get to work.
    While more part-time workers tend to work
    closer to home compared to full-time workers,
    most still need to travel long distances.

PAGE 8
                                                                                      Source: 2016 Census of Population and Housing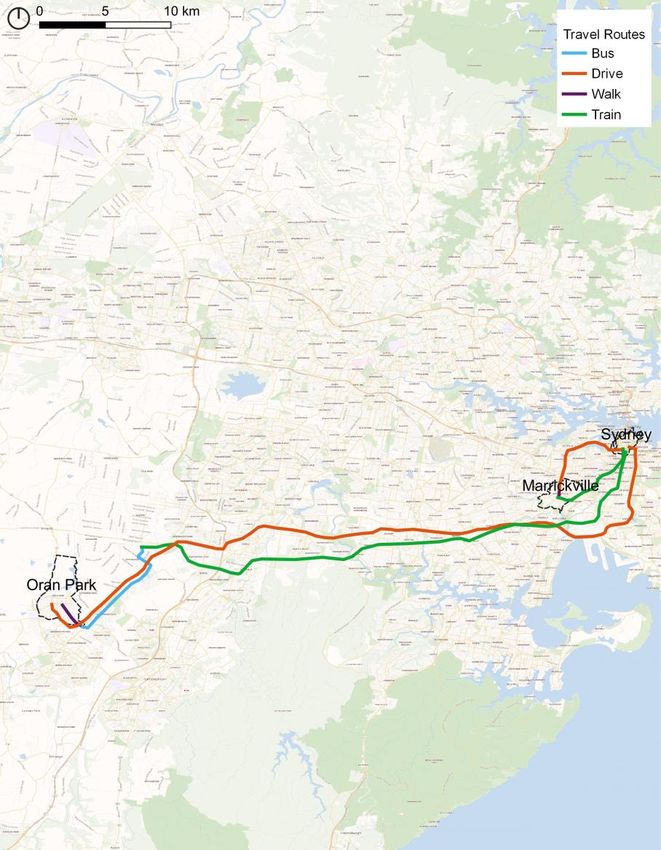
Full-time workers have to travel the most
                                                              146,000 full time
                                                              and 102,000 part
                                                            time workers travel
                                                              5-10km for work

             963,000 full time and                          175,000 full time
          343,000 part time workers                        and 170,000 part
          travel 10km or more to get                        time workers live
                    to work                                within 5km of work

PAGE 9
                                       Source: 2016 Census of Population and Housing
Impacts are different for your age and gender
    Men are more likely than women in the outer growth suburbs to travel long distances for work and this is true at all ages. Access to high
    paying and senior jobs is one reason, where workers are doing longer commutes to get to the city to get to this type of employment.
    Specialist jobs requiring specific skills are another type of employment that are centralised around cities. 2 Technicians and trade workers
    also have longer commutes.3 Each of these examples of employment has traditionally higher proportion of men.

    Ripple Effects
    Apart from the impact on time and cost for the commuter, travelling for work will impact everyone’s lives in different ways:
    • families when one parent is away for long periods of time it exacerbates the caring burden. 4
    • relationships when long commute times mean strain on the family,5 increased divorce6 and exacerbation of family violence7.
    • health and wellbeing when there is limited time for exercise while commuting.8
    • local economy when people are not able to spend locally because they are physically not there. 9
    • social participation when time commuting precludes participation in local club or social activities, including volunteering. 10
    • gender pay gap differences are exacerbated because of the gender commute gap. 11

PAGE 10
Impacts are different for your age and gender
Number of persons travelling 10km or more for work
PAGE 11
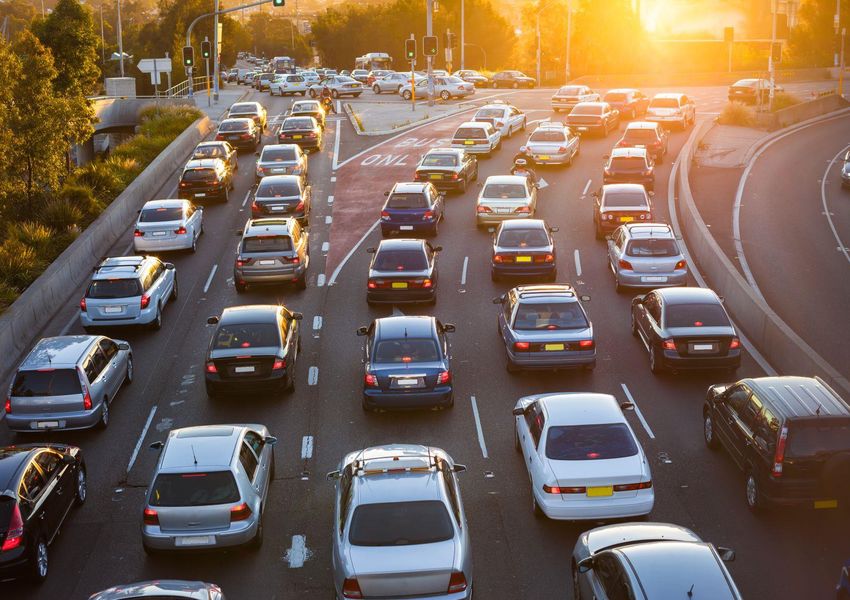
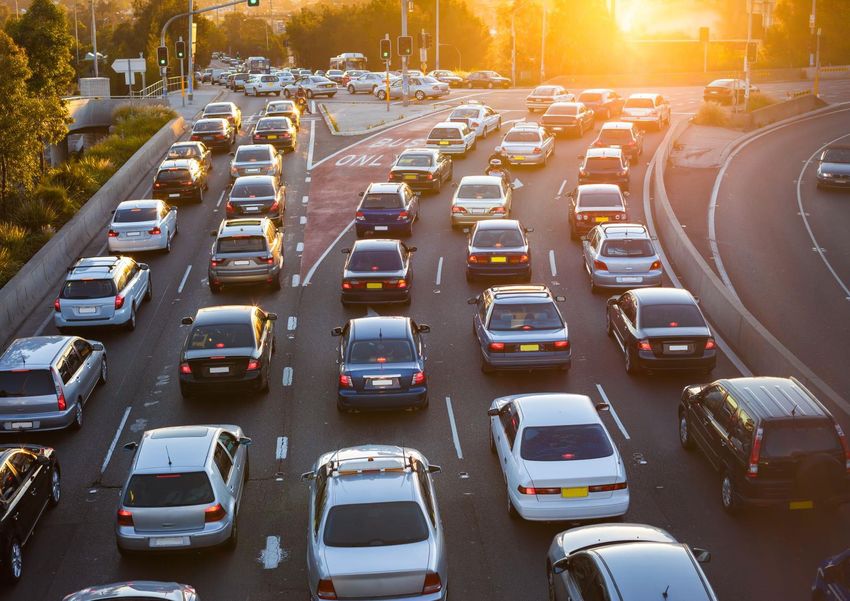
Source: 2016 Census of Population and HousingThe commuting experience is reliant on cars
For the majority of commuters from outer growth suburbs, commuting by car is the only choice because public transport options are
limited. The commuting experience is reliant on cars.
To reduce journey to work car dependency in outer growth suburbs, two factors need to be addressed:
Lack of local jobs Limited convenient public transport options
People living in outer growth suburbs require more local Commuting times also hide the complexity of outer suburb
employment opportunities that match their skills and public transport. While driving can take longer and cost more,
qualifications to reduce the need to commute longer distances. commuters choose to drive anyway because using public
A recent report from Western Sydney University identified that transport leads to a journey to work that is either overly
over 300,000 people leave Western Sydney every day for work. complex, incompatible with routine, or non-existent. Limited
If left unchecked, the report estimates that there will be a daily public transport options then contribute to more congestion on
outflow of 562,000 commuters by 2036.12 our roads, as more people are compelled to drive to work.13
PAGE 12The commuting experience is reliant on cars
3 out of 4 people drive to work
PAGE 13
Source: 2016 Census of Population and HousingThe financial pressure of driving
Commuting by car to work from outer growth suburbs costs
commuters $5.4 billion a year
The average daily commute for workers driving from outer growth suburbs costs*:
$36.28 $58.35
Per return trip if only considering Per return trip if including running
running car costs, tolls and parking costs PLUS standing costs for a car per
km (insurance, registration etc)
That’s $8,380 a year for full-time workers and $4,170 a year for part time workers just to drive to work. With the average income in these
outer growth suburbs being only $49,250 a year, can result in over one-tenth of income spent just on getting to work.
Public transport costs commuters $2,540 a year for full-time workers and $1,270 a year for part-time workers to get the train, bus or tram
to work. While public transport is often a much cheaper alternative, with public transport commutes from outer growth suburbs costing just
$11.00 per return trip, it’s not always a easy or even viable option. For many people in outer growth suburbs, public transport is not
available, or viable in terms of time tables, length of commute and may still requires multiple modes such as driving to get to a
transport route.
*Cost estimates are based on the numbers of workers employed in outer growth suburbs who travel 10km or more per commute by car, broken down by part time and full time work status. Full time workers
were assumed to commute 231 days per year (assuming work is completed onsite and allowing for four weeks or 20 days annual leave) and part time workers 115 days per year (half those of full time
workers). Costs are based on 2019 estimates of running costs for medium size cars applied to the average commute distance, toll and parking rates based on public domain rate calculators for each city.
PAGE 14Case Study: Commute in Sydney
Daily costs of time and money for the commute from Oran Park are more
than double those commuting from Marrickville. Mapping typical routes for
Oran Park commuters highlights the complexity of public transport for those
living out west, requiring a bus and two different trains.
Oran Park Marrickville
Running costs for car per km $0.17 $0.17
Driving Distance (return)* 120km 18.8km
Tolls (return) $23.60 -
Parking (early bird) $25.00 $25.00
TOTAL DRIVING COST $68.60 $28.13
(RETURN)
Drive Time (return)* 2hr 35m 32m
PUBLIC TRANSPORT COST $10.00** $7.22
(RETURN)
Time on bus/train (return) 3 hrs 44m
* Drive times are estimated from the midpoint of the ‘typical’ journey time forecast by Google Maps journey
data if arriving in Sydney CBD by 9am and leaving after 5pm. Drive distance is based on the fastest route
recommended by Google Map. **Weekly cap of Opal Card is $50. The daily cap, is $16.10 for Opal Card
uses so the public transport cost could be higher for persons commuting less than five days per week.
PAGE 15Case Study: Commute in Melbourne
Comparing Cranbourne commuters to the CBD demonstrate driving costs
are more than double compared to Collingwood. Public transport costs are
the same, highlighting how policy can mitigate some of the costs for those
who live on the urban fringe when provided this as a viable option.
Cranbourne Yarra
Running costs for car per km $0.17 $0.17
Driving Distance (return)* 100km 7.2km
Tolls (return) $17.08 -
Parking (early bird) $19.00 $19.00
TOTAL DRIVING COST $42.72 $20.19
(RETURN)
Drive Time (return)* 1h 55m 29m
PUBLIC TRANSPORT COST $9.00** $9.00
(RETURN)
Time on bus/train (return) 1h 8m 38m
* Drive times are estimated from the midpoint of the ‘typical’ journey time forecast by Google Maps journey
data if arriving in Melbourne CBD by 9am and leaving after 5pm. Drive distance is based on the fastest route
recommended by Google Map. ** The daily myki cap is $9 full fare.
PAGE 16Local economies are missing out
The annual cost for long-distance commuting paid by workers in
the outer growth suburbs is $7.4 billion.
The cost saving across households if every current long-distance
commuter commuted just one day less would be $37 million
each year.
All of this travel is not just affecting commuters in their time and
money, but also their local economics.
Every person who works away from their local community in the
outer growth suburbs, spends money somewhere else.
In just one day, if every commuter bought one cup of coffee in
their local community it would see an injection of $5.4 million
which in turn would equal:
$1.4 billion
each year
PAGE 17
*Estimated on average of public transport and car costs allowing for full time workers commuting 231 days per and part time workers 115 days per year. For one day’s savings we
assumed all workers who travelled more than 10km would travel at least 48 days per year, allowing for four weeks annual leave and two weeks sick leave. See also End Note A.City overviews
The outer growth suburb
commute
PAGE 18Understanding city
overviews
Average commuting distance from across
named local government areas (LGAs) in the
capital city (return)
Running costs for car (fuel, tires and servicing),
average tolls and parking costs across named
LGAs
Average public transport costs across named
LGAs based on information from relevant
transport provider website.
% of all employed usual residents who travel to
work by car
% all usual residents employed full-time who
travel 10km or more to get to place of work
% all usual residents employed part-time who
travel 10km or more to get to place of work Map legend: % of employed usual residents who travel
10km or more to get to work, with darker shading
indicating higher proportion of people making long
commutes.
PAGE 19
Source: 2016 Census of Population and Housing. For car and public transport cost calculations see End Note A.MELBOURNE’S
OUTER SUBURBS
45.88 km average commuting
distance
$39.84 average cost of commute
by car
$9.00 average cost of commute
by public transport
76% commute by car
78% full time workers have long
commutes over 10km
59% part time workers have long
commutes over 10km
PAGE 20SYDNEY’S OUTER
SUBURBS
44.58 km average commuting
distance
$54.48 average cost of commute
by car
$10.00 average cost of commute
by public transport
71% commute by car
73% full time workers have long
commutes over 10km
53% part time workers have long
commutes over 10km
PAGE 21PERTH’S OUTER
SUBURBS
40.72 km average commuting
distance
$22.77 average cost of commute
by car
$13.43 average cost of commute
by public transport
74% commute by car
76% full time workers have long
commutes over 10km
55% part time workers have long
commutes over 10km
PAGE 22BRISBANE’S OUTER
SUBURBS
38.44 km average commuting
distance
$33.83 average cost of commute
by car
$12.54 average cost of commute
by public transport
76% commute by car
74% full time workers have long
commutes over 10km
55% part time workers have long
commutes over 10km
PAGE 23ADELAIDE’S OUTER
SUBURBS
41.30 km average commuting
distance
$22.77 average cost of commute
by car
$7.54 average cost of commute
by public transport
77% commute by car
73% full time workers have long
commutes over 10km
58% part time workers have long
commutes over 10km
PAGE 24The future commute
New ways of working for the
outer growth suburbs
PAGE 25Planning for a future that works
Reducing the pressure of time and cost for outer growth suburb
commuters
1.3 million workers in outer growth suburbs have to travel more than 10km each way just to work. In the
professional, scientific and technical industry alone there are 75,000 people who can’t access
employment close to home if they have to complete their work in a physical workplace.
As the economy rebuilds post-pandemic, people who have been forced to work from home during social
isolation say they would like a hybrid model of working from home and face to face in the workplace.
Most workers are keen to return to physical offices, but not everyday. 15
Supporting people to work from home will save hundreds of thousands of dollars back to families and
households as money spent just on getting to work can be redirected.
On average, a commuter in an outer growth suburb working from home just one day a week would:
• save $1,740 a year if driving,
• save $528 a year using public transport,
• save at least 92 hours a year in commuting time.
Working one day a week at home and purchasing coffee locally would see $5.4 million retained within
Australia’s outer growth suburb economies.
PAGE 26
Estimated on average of public transport and car costs. See also End Note A.Opportunities for remote & flexible work
522,000 people across Australia’s outer growth suburbs are Outer growth
Occupation
suburb workers
working in jobs that could be done flexibly and remotely.
Accounting Clerks 25,466
The impacts of social isolation during COVID-19 has demonstrated
Office Managers 22,069
for a great many jobs this is possible and practical if not all the
Accountants 21,407
time, then at least some of the time to travel less and work at
Purchasing and Supply Logistics Clerks 19,048
home. This is true both for whole industries, but also for specific
occupations that are across many industries. Contract, Program and Project
17,103
Administrators
Based on occupation data from the Census, it is estimated that half Advertising, Public Relations and Sales
16,117
a million people living in outer growth areas could do their jobs Managers
from home at least some or all of the time. Bookkeepers 14,413
Construction Managers 13,885
Considering the top 10 occupations by employment number in
Information Officers 12,902
outer growth suburbs, working from home some or all of the time
could reduce the number of outer growth suburb workers Real Estate Sales Agents 12,287
commuting by 174,697 people. This is regardless of what industry Total 174,697
these job functions are employed in.
PAGE 27
Source: 2016 Census of Population and HousingOpportunities for remote & flexible work
Changing commuting by industry
Three key industries dominate the jobs that could be done working from home with little change to work habits or expectations –
administrative and support services; financial and insurance services; and professional, scientific and technical services.
PAGE 28
Source: 2016 Census of Population and HousingRedefining jobs that can be done
at home
Our experiences of COVID19 related restrictions have demonstrated that a great many jobs can be done
remotely very effectively and efficiency with little change to work practices. This experience has provided
an opportunity for both management and workers to rethink how work can be done.
Pandemic related lockdowns have also demonstrated that jobs not historically delivered or thought to be
able to be delivered from home can actually be completed in a digital setting 16. Think virtual pilates and
telehealth services.
These jobs can be adjusted to suit flexible work arrangements with little to no adjustments to get the
same results. There of course remain groups of jobs that are not as readily able to be done remotely.
This is not to say that flexible options, such as a hybrid of remote and physical workplace activity can’t be
explored.
Our use of digital technology during the pandemic should also encourage experimentation in employment
in how we carry out and deliver our work.
Other jobs may not be able to be completed permanently at home, or workers may not want work from
home all or some of the time, but future workforces will need to have flexible approaches*.
*Data on jobs in Australia are measured using standard codes for occupations and industries. This report has looked at occupations and industries to
explore how many people could work from home in outer growth suburbs in Australia. They measure job types in different ways with occupations allowing a
more refined understanding of the number of jobs, and the larger industry grouping allowing cross referencing with other variables.
PAGE 29How to create change to the long commute?
1. Understand the drivers, motivations and aspirations of commuters in outer growth suburbs
Employers can benefit from developing a deeper and more empathy driven approach to understanding
commuters in our outer growth suburbs. This includes aggregating data such as surveys and interviews to
understand what people need to work from home, their decisions regarding where they work, impacts felt
across their lives and their aspirations for work practices that work for them. This should be compared to what
is different for people in outer growth suburbs compared to workers in inner city suburbs.
2. Develop new ways to understand the jobs done by people in outer growth suburbs
The data used to understand employment and forecast jobs is typically based on the Australia New Zealand
Standard Classification of Occupations. The first edition was released in 2006 and revised in 2009. While this
is the industry standard it is now ten years old and does not capture new and emerging roles such as ‘Data
Scientist’. Developing new frameworks to understand new and emerging occupations will support better
planning to create places that allow people to work in the jobs of the future.
3. Invest in infrastructure that supports the ability to work from home, and to enable more local
employment options.
Employment at home or within outer growth suburbs needs to be supported by infrastructure and amenity. This
includes ensuring there is high level broadband connections throughout all outer growth suburbs and establish
locally-based work hubs that preclude long commutes. Further exploration of land use and local integrated
transport options to promote greater local economic activity generating more locally-based jobs should be a
priority.
PAGE 30End notes
Methodology & references
PAGE 31Methodology
What data did we use?
The main data source in this report is the Journey to Work data
from the 2016 Census of Population and Housing.
A: How did we work out costs?
Astrolabe Group used data from the RACV17 on 2019 running
costs of a medium size car per kilometre and applied this to
average commuting distances for the named LGAs. Estimated
tolls were from each state’s toll calculator and parking was based
on average early bird rates for each capital city. Public transport
costs were based on fare information for each metropolitan city’s
transport website.
B: How did we estimate potential remote based/flexible
jobs?
Astrolabe looked at Census occupation and industry data and
made an assessment based on job titles or industry groups.
PAGE 32A: Estimating the cost of commuting
Average commuting costs were estimated based on the following information:
• Number of employed persons living in outer growth suburbs who travelled more than 10km to work each day
• Average commuting distance for each LGA sourced from the 2016 Census of Population and Housing.
• Running costs (fuel, tires and servicing) per kilometre and standing costs (insurance, registration, depreciation) per kilometre for a
medium sized car were applied to the average commuting distance. 17
• Tolls were estimated using the relevant toll calculator for Sydney, Melbourne and Brisbane from the source LGA to the CBD. These can
vary depending on route but some estimates have placed costs at between $1,000 and $3,000 per year so estimates listed here should
be viewed as an average. 18
• Parking costs were sourced from average cost for earlybird parking that did not require booking in the CBD of each capital city
featured. We note that costs can vary in capital cities from $180 to $750 a month. 18
• Public transport costs were calculated by identifying relevant zone location of outer growth suburbs for travel to the CBD of a city.
• Annual cost estimates assumed full time workers commuted 231 days per year, and part time workers 115 days per year (allowing for
four annual leave).
Estimates of total costs applied the average commute cost to the number of employed workers who travelled further than 10km per day,
recognising that using averages can overestimate costs for those making short commutes.
For estimates of cost savings if people worked at home one day per year, we used the average of public transport and car travel for every
person who travelled 10km or more to get to work. We assumed at least 48 days travel (assuming four weeks annual leave).
PAGE 33B: Occupation by job title
Occupation
Chief Executives and Managing Journalists and Other Writers ICT Business and Systems Intelligence and Policy Analysts Judicial and Other Legal
Directors Analysts Professionals
General Managers Accountants Multimedia Specialists and Web Land Economists and Valuers Solicitors
Developers
Legislators Auditors, Company Secretaries Software and Applications Librarians Contract, Program and Project
and Corporate Treasurers Programmers Administrators
Advertising, Public Relations Financial Brokers Database and Systems Management and Organisation Office Managers
and Sales Managers Administrators, and ICT Security Analysts
Specialists
Corporate Services Managers Financial Dealers Computer Network Other Information and Personal Assistants
Professionals Organisation Professionals
Finance Managers Financial Investment Advisers ICT Support and Test Engineers Advertising and Marketing Secretaries
and Managers Professionals
Human Resource Managers Human Resource Professionals Telecommunications ICT Sales Professionals General Clerks
Engineering Professionals
Policy and Planning Managers ICT Trainers Barristers Public Relations Professionals Keyboard Operators
Research and Development Training and Development Urban and Regional Planners Technical Sales Call or Contact Centre Workers
Managers Professionals Representatives
ICT Managers Actuaries, Mathematicians and Human Resource Clerks Other Miscellaneous Clerical Information Officers
Statisticians and Administrative Workers
Authors, and Book and Script Archivists, Curators and Library Assistants Fashion, Industrial and Receptionists
Editors Records Managers Jewellery Designers
Practice Managers Bank Workers Graphic and Web Designers, Accounting Clerks
and Illustrators
Architects and Landscape Economists Credit and Loans Officers (Aus) Interior Designers Bookkeepers
Architects / Finance Clerks (NZ)
Surveyors and Spatial Scientists Payroll Clerks Insurance, Money Market and
Statistical Clerks
Source: Australian and New Zealand Standard Classification of Occupations, 2013, Version 1.3. https://www.abs.gov.au/ANZSCO
PAGE 34References
1. ABS (2020) Business Indicators, Business Impacts of COVID-19, May 2020. Cat. No. 9. Urhonen, T. et al. (2016) ‘Associations between long commutes and subjective
5676.0.55.003 health complaints among railway workers in Norway’, Preventive Medicine Reports,
4:490-495.
2. BITRE (2016) Information Sheet: Five facts about commuting in Australia. Department
of Infrastructure and Regional Development: Canberra. 10. Gibbs et al. (2020) Social impact analysis of out-commuting. Urbis
3. Donaldson, D. (2018) “Avoiding the sprawl: which cities really face the longest 11. Office for National Statistics (2019) Gender differences in commute time and pay.
commutes”, The Mandarin, 23 May 2018.
4. Sandow, E. (2011) On the road: Social aspects of commuting long distances to work.
Doctoral thesis, Umea University, Faculty of Social Sciences, Department of Social and 12. O’Neill, P. (2020) Where are the jobs? Part 2: The geography of Western Sydney’s
Economic Geography.
5. Feeling the pain and joys of commuting, ANU Newsroom, 21 May 2015. 13. Terrill, M., Batrounry, H., Etherington, S. and Parsonage, H. (2017). Stuck in
https://www.anu.edu.au/news/all-news/feeling-the-pain-and-joys-of-commuting traffic? Road congestion in Sydney and Melbourne. Grattan Institute: Melbourne. ,
https://grattan.edu.au/report/stuck-in-traffic/>; Jacks, T. (2018) “The west has
6. Hansson, E. et al. (2011) “Relationship between commuting and health outcomes in a Melbourne’s worst commutes – four hours a day across town”, The Age, 7 June 2018.
cross-sectional population survey in southern Sweden”, BMC Public Health 11, Article
11-834; Sandow, E. (2014) ‘Til work do us part: the social fallacy of long-distance
commuting’, Urban Studies, 51(3):526-543. 15. Ziffer, D. (2020) “Most workers want 'hybrid' jobs at the office and at home after
https://journals.sagepub.com/doi/full/10.1177/0042098013498280. coronavirus, study finds”, ABC News, 23 June 2020.
https://www.abc.net.au/news/2020-06-23/most-workers-want-hybrid-of-home-and-
7. Hoath, A. & Haslam McKenzie F (2013) The socio-economic impacts of long distance office-post-coronavirus/12381318
commuting on source communities. Perth, Co-operative Research Centre for Remote
Economic Participation and Curtin Graduate School of Business. 16. Ulubasoglu, M. & Onder YK (2020) ‘Teleworkability in Australia: 41% of full-time
https://apo.org.au/sites/default/files/resource-files/2013-11/apo-nid36235.pdf; Beland, LP and 35% of part-time jobs can be done from home’, The Conversation, 29 June 2020.
and Brent DA (2018) ‘Traffic and Crime’ Journal of Public Economics 160(3): 96–116. https://theconversation.com/teleworkability-in-australia-41-of-full-time-and-35-of-part-
https://www.lpbeland.com/uploads/7/8/7/5/7875420/jpube1-s2.0-s0047272718300422- time-jobs-can-be-done-from-home-140723
main.pdf
17. RACV car running costs calculator (2020)
About Them. British Columbia.
18. Australian Railway Association. (2015). The Costs of Commuting: Analysis of
Potential Commuter Savings. https://www.ara.net.au/sites/default/files/15-
01%20REPORT-Commuter-costs-potential-savings-report-
FINAL%20%281%29%20%281%29.pdf
PAGE 35PAGE 36
linkedin.com/company/astrolabegroup
                                                                                                         astrolabegroup.com.au

About Astrolabe Group
Our vision is to create a positive impact for people and places.
Astrolabe is a strategic consultancy anchored in collaboration and innovation where there is
change and growth.
This report was prepared for the National Growth Areas Alliance. In preparing the report,
Astrolabe has made every effort to ensure the information included is reliable and accurate.
Astrolabe is unable to accept responsibility or liability for the use of this report by third parties.
You can also read