London Overground - A success story: Transforming neglected urban railway infrastructure to meet capacity and connectivity demands - CORE
←
→
Page content transcription
If your browser does not render page correctly, please read the page content below
International Symposium for Next Generation Infrastructure
                                                     October 1-4, 2013, Wollongong, Australia

            London Overground – A success story:
    Transforming neglected urban railway infrastructure to
           meet capacity and connectivity demands

                                         N. Badstubera
                                          C. Smalesb

     Abstract: London Overground illustrates the successful transformation of underused
     and fragmented urban railway infrastructure into an orbital service boasting record
     passenger satisfaction and popularity. London’s metropolitan transport authority
     Transport for London achieved this through a combination of measures. In addition
     to station upgrades and new trains, the provision of integrated transport services,
     such as integrated ticketing and customer information, marketing and branding
     contributed to London Overground’s success. In 2007, Transport for London took
     over the concession to operate and manage the neglected railway routes. Since then,
     London Overground has become one of best performing train operators in Great
     Britain. London Overground patronage has nearly quadrupled since Transport for
     London took over the management of the concession – surpassing demand forecasts
     and necessitating further capacity enhancement investment. As well as providing
     new radial connections, London Overground has also managed to attract passengers
     from London Buses, National Rail and London Underground, and thereby freed
     capacity on these stressed services. This paper will describe all of these
     transformations and draw out some principles that will be of use to other similar
     initiatives.

     Key words: Railway; Infrastructure; Regeneration; Connectivity; Orbital
     transport; London overground; Transport for London.

                                       I. Introduction

   London’s public transport authority Transport London has successfully transformed neglected
and fragmented urban rail infrastructure into a comprehensive network that complements the
existing public transport provision in London. An inner London orbital service was created by
Transport for London by linking up a dispersed and fragmented collection of railway routes. This
network was branded as London Overground and became part of Transport for London.

a
   Department of Civil, Environmental and Geomatic Engineering,,University College London, London
WC1E 6B, UK
b
  London Rail Development, Transport for London, London, SE1 8NJ, United Kingdom
http://dx.doi.org/10.14453/isngi2013.proc.3
International Symposium for Next Generation Infrastructure
                                                      October 1-4, 2013, Wollongong, Australia
   The largest component of the new London Overground network is formed from the previous
Silverlink Metro routes. Transport for London took over the management of the Silverlink Metro
concession in November 20071. Silverlink Metro ran suburban and inner London services from
Stratford to Richmond, Willesden Junction to Clapham Junction, London Euston to Watford
Junction via Willesden and Gospel Oak to Barking. The map below illustrates the former
Silverlink Metro rail routes rebranded as London Overground.

   The Silverlink Metro ran a low quality service, marked by neglected stations, old rolling stock
and low service levels. When taking over the concession Transport for London set about
transforming the network with a programme dedicated to the enhancement of the level and
quality of services which included:

    •   New rolling stock
    •   Upgraded infrastructure to accommodate higher service levels
    •   Station refurbishments
    •   High standards of customer service1

    Figure 1: London Overground Network in 20082
International Symposium for Next Generation Infrastructure
October 1-4, 2013, Wollongong, Australia
Figure 2: London Overground Network in 2011 (with East London Line Extensions5)
A. East London Line
Another existing route to be integrated into the London Overground was the London
Underground East London line from Whitechapel to New Cross Gate3. The East London Line
was closed in 2007 to become part of the London Overground network. The infrastructure of the
former London Underground East London Line needed to be upgraded to accommodate the new
levels of service. The work involved the installation of new signaling and communications
equipment as well as the replacement of tracks and construction of new bridges. In the same
fashion as the former Silverlink Metro stations, all existing stations were refurbished to offer
modern and high level of customer service and experience.
The East London line was extended both to the north, to meet the Richmond to Stratford line
at initially only to Dalston in 2010 and later Highbury & Islington in 2011, and to New Cross,
Crystal Palace and West Croydon via separate branches in the South1,4. The section north ofInternational Symposium for Next Generation Infrastructure
October 1-4, 2013, Wollongong, Australia
Whitechapel uses the route of the old railway lines into Broad Street station, which was closed in
1986. Along this section four new stations were constructed. The section south of New Cross
Gate runs alongside the existing mainline railway tracks3. A full service between Highbury &
Islington and New Cross/Crystal Palace/West Croydon via the City opened on 28 February
20114. A map capturing the expanded network to the East and South East is shown below.
B. Completing the Orbital
The orbital was completed with the final link currently planned on the London Overground
orbital network in December 2012. London Overground’s newest addition is an extension across
south London between Surrey Quays and Clapham Junction station. Four new stations were built
along the route. Thereby, offering a new level of connectivity to the residents along the
route4.The complete transformation of neglected a fragmented urban rail infrastructure into the
orbital London Overground network to date cost Transport for London £1.5 billion4.
Figure 3: London Overground Network as of December 20126International Symposium for Next Generation Infrastructure
October 1-4, 2013, Wollongong, Australia
C. Alignment with the London Plan and Mayor’s Transport Strategy
The London Plan is an overall strategic plan for the UK capital which sets out an integrated
social, economic, environmental and transport framework for development in London for the
next twenty years7. The London Plan was developed alongside the Mayor’s Transport Strategy,
in which the Mayor of London sets out his vision for transport in the next twenty years. With
high levels of residential and employment migration into to London, 1.25mil and 0.75mil
respectively by 2031, sustainable transport is the key keeping London moving8. Alongside this
significant population growth rail demand is forecast to grow by two-thirds by 20319. This will
inevitably put pressure on the transport network, leading to greater crowding levels and thereby
adversely affection both journey times and reliability. The public transport network is vital to
keeping London moving. Urban rail in particular carries 80% of all journeys into London9.
London Overground is therefore vital to providing greater capacity and offering alternative
routes in order to relieve capacity in Central London9. One of the ways the London Plan
proposes to enhance London’s transport connectivity is to provide an orbital rail network, i.e.
London Overground, which would support future development, regeneration of priority areas
and increase public transport capacity.
London Overground’s orbital service complements the existing services by providing links
between inner London areas without customers needing to travel via central London. London
Overground facilitates strategic interchanges between orbital and radial routes. The concept of
these strategic interchanges is outlined in the Mayor’s Transport Strategy10.
Figure 4: Strategic Interchange Concept10
Interchanges expand the level of accessibility to opportunities and services as well as improve
connectivity and passenger journey experiences. Strategic interchanges outside of centralInternational Symposium for Next Generation Infrastructure
October 1-4, 2013, Wollongong, Australia
London have the potential to reduce travel times for the individual customer and relieve
crowding in central London. Key to achieving these goals is the quality of the interchange. To
achieve world-class interchanges which encourage multi-modal public transport use and attract
passengers from using their private cars Transport for London has published Interchange Best
Practice Guidelines11 to ensure high quality and effective interchanges across their jurisdiction.
As part of the Transport for London family, London Overground stations were also designed to
ensure customers would have a good interchange experience.
Figure 5: Examples of Strategic Interchange Locations Outside Central London10
As you can see in the figure above the London Overground provides the backbone potential
radial orbital interchanges, improving journeys for customers through reduced journey times and
freeing up capacity at Central London interchanges.
II. Success of London Overground
A. Passenger Numbers
London Overground patronage tripled in the four years following Transport for London’s
take-over of the concession, between November 2007 and 2011. A large part of the growth
occurred on the East London Line with its new extensions. However, the rest of the London
Overground network also experienced passenger numbers increasing by 110%1. Today, four
times as many passengers are using London Overground than before the concessions were taken
over. The latest four week period (Period 3 for 2013/2014) was the busiest for the London
Overground to date with 10.9 million passengers12.International Symposium for Next Generation Infrastructure
October 1-4, 2013, Wollongong, Australia
Peak services are already crowded. In 2009, new high capacity trains were introduced and in
2011 the service frequency was doubled13. The popularity of the service is highlighted by
demand for the service having grown in line with capacity increases. Demand for the services
has increased steadily. London Overground has already completed an additional capacity
enhancement programme since it’s initial upgrades. In 2010 the train capacity was increased by
over a third by adding an additional car to the train along the North and West London Line.
Initially only three car trains were introduced, these were extended to four car trains already in
use on the East London Lines in 20101. The crowding levels today match those recorded before
these two measures were implemented. By 2016, as illustrated below, it is anticipated that
demand will exceed Transport for London’s planning standard of no more than three passengers
per square metre standing in the morning peak1. Demand across the whole London Overground
network alone is expected to increase by another forty per cent by 202115.
Figure 6: Forecasted Crowding on London Overground in 20161
The fastest growing section of the network has been on the Willesden to Clapham Junction
route between the two new stations along that route: Shepherd’s Bush and imperial Wharf.
Shepherd’s Bush now provides links with London Underground’s Central Line as well as easy
access to a large urban shopping mall1. Imperial Wharf station has provided new levels of
connectivity to an area previously underserviced by public transport. The popularity of the
service along this section has outstretched capacity already. These two section are the busiest
sections along with the Highbury & Islington to Dalston section. Crowding in the peak surpasses
the crowding levels Transport for London designs for, namely three passengers per square metre.
The London Overground Loadweight12 report from the weeks commencing the 10th and 17th
June 2013 indicates that crowding levels of up to 6 passengers per square metre standing areInternational Symposium for Next Generation Infrastructure
October 1-4, 2013, Wollongong, Australia
reached close to passenger safety crowding threshold of 7 per square metre. Maximum train
loading is considered 5 passengers per square metre – which these peak services are exceeding -
and 7 passengers per square is considered crush load14,15. Peak loads are increasing necessitating
further capacity investment.
The popularity of the link demonstrates the former gap in public transport provision that the
London Overground has managed to fill. It is servicing new areas and providing easy
connections between previously underserviced routes. The popularity of this section also
highlights the importance of good interchange facilities which encourage customers to undertake
multi-modal journeys to access new services and opportunities.
Transport for London will be increasing the number of cars on the routes using electric 4-car
trains (all bar Gospel Oak to Barking on which diesel trains run) from four to five cars to further
increase capacity on the lines. This London Overground capacity enhancement scheme will
increase capacity by more than a quarter and thereby reduce crowding on trains. The scheme will
first be rolled out to the East London Line, from Highbury & Islington to West
Croydon/Clapham Junction, from December 2014. The rolling stock upgrade will follow on all
other electric lines in 201513. Transport for London has placed an order for 57 new cars with the
original manufacturer Bombardier worth £88 million. This is part of a wider £320million
capacity enhancement programme which also includes the construction of longer platforms,
depot enhancement, new signalling and power works16,17.
B. Drivers of Growth
Key drivers of rail demand are the economy, demographics, fares and service levels. During
an economic downturn rail demand is therefore, assumed to slow. However, this has not been the
case in London and South East of England. On the contrary, rail demand grew strongly between
2010 and 20121. Instead, other drivers contributed to London Overground’s growth in patronage,
namely:
• Service frequency
• Operational Performance
• Service Quality, including stations and rolling stock
• Connectivity
• MarketingInternational Symposium for Next Generation Infrastructure
October 1-4, 2013, Wollongong, Australia
Figure 7: Drivers of Growth on London Overground
The impact of each of these drivers to the
overall patronage increase was calculated by
Transport for London using industry elasticity to generate a waterfall chart, as depicted above1.
In the first instance, London Overground has benefitted from a buoyant rail market in London
and South East England1. Despite the economic downturn rail usage has steadily increased.
Background growth, however, has only contributed a quarter of the patronage increase observed
on the routes between 2009 and 2011. The largest contributor to London Overground’s growth
was service frequency.
C. Frequency
When Transport for London took over the concession from Silverlink Metro in 2007, up to six
trains per hour ran between Stratford and Richmond and three trains per hour between Clapham
and Willesden Junction. In the off peak frequencies were notably lower at four and two trains per
hour respectively. There have been two updated timetables since the concession was taken on,
one in 2010 and 2011. The frequency was changed to three trains per hour from Stratford to
Clapham Junction and three trains per hour from Stratford to Richmond. The schedule was
changed to service the increasingly popular link between Clapham and Willesden. In 2011, the
service frequency was increased to four trains per hour on both routes1.
Figure 8: Frequency of London Overground Services1International Symposium for Next Generation Infrastructure
October 1-4, 2013, Wollongong, Australia
Based on extensive research conducted for London Underground, Transport for London has
set the frequency all stations should receive at least four trains per hour throughout the week,
wherever appropriate9. The research demonstrated that this level of standardized frequency
addressed customer preconceptions that the journey would be lengthy and inconvenient9. Instead
the “turn up and go” service frequency encourages customer to use the service without planning
their journey in advance, thereby attracting customer from other frequent services such as the bus
and London Underground.
D. Service Quality - New Trains
All London Overground routes bar the Gospel Oak to Barking route are now served by a four
car high capacity train. Longitudinal seating and walk-through carriages maximise capacity. The
trains have a capacity of 700, designed to carry customers in comfort for short distances1. The
suburban old rolling stock was replaced for a metro style rolling stock.
E. Service Quality - Safe Stations
During 2011, all London Overground stations were refurbished to provide a safe and secure
station environment to customers. This was achieved through:
• Modernising stations
• Improving lighting
• Installing more CCTV
• Managing stations more effectively
• Visible policing and security patrolling
• Providing more Help Points
• Implemented alcohol and smoking bans
• Enhanced information systems
• Continuous station maintenance and cleaning9,13
The design principles developed by Transport for London’s dedicated team, Crime Prevention
Through Environmental Design, were also applied to London Overground to design out crime13.
The success of these efforts is captured by the Passenger Focus surveys18,19 in which passengers
self-assessment of their personal security whilst using the station increased by nearly thirty
percentage points from a satisfaction level of 45% to 74% since Transport for London took over
the concession. There were also significant increases in customer satisfaction in the overall
station environment, for which the passenger satisfactions rates increased from 50% to 69%
between Spring 2010 and 2011 - during this period a considerable number of stations underwent
the station refurbishment as outlined above. The new maintenance and upkeep periodicity also
received high customer approval rates. Passenger satisfaction rates went up with statistical
significance by nearly 20% for the same time period with regard to cleanliness and station
upkeep/repair of the station buildings and platforms18.
F. Service Quality – Staff
All London Overground stations are staffed while trains are running, to enable customers to
access help from members of staff available. In additions this will also increase the safety at the
stations20.International Symposium for Next Generation Infrastructure
October 1-4, 2013, Wollongong, Australia
G. Branding
London Overground has been branded with the same operational branding as the rest of
Transport for London. A recognizable adaptation of the Transport for London roundel brand
originally designed Edward Johnston for London Underground in 1918 has been adopted for
London Overground21. The bright orange formerly used to denote the London Underground East
London Line which was incorporated in the London Overground network was adopted for the
London Overground with a roundel mirroring the London Underground icon with the red
replaced with orange.
London Overground design standards were introduced to promote a high level of quality and
consistency in appearance and all communications. London Overground design standards fall in
line within the Transport for London family brand. To ensure the continuity and consistency in
brand design separate London Overground design standards were developed for basic elements,
signs, posters, the built environment, stationary and train graphics. The standardised appearance
of the patchwork network was achieved with a design standard for stations. The adaptation of the
roundel also implied a service quality and level that the customers are accustomed to from the
other Transport for London brands. Supplementing the visual appearance with an higher service
quality and frequency, increased maintenance regimes, improved customer service and Transport
for London’s smart card ticketing system, presented the London Overground network as a fully-
fledged member of the Transport for London family both in terms of appearance and
performance.
H. Marketing
In addition to the rebranding of the stations and routes Transport for London took over they
also had an active marketing campaign to raise awareness and encourage the use of the new
network. In 2008, they launched a campaigned called London’s New Train Set which intended to
inform passengers about the new London Overground network20. London Overground also
appeared on the London Underground network maps in addition to its appearance on the London
Rail maps. This placed London Overground firmly on the map for Londoners and visitors
navigating the city. The “turn-up-and-go” service frequency enabled this as London Overground
services were now a reasonable journey alternative.
The success of the marketing campaign is captured in the survey results of customer research
conducted for London Overground East London Line22. Surveys were undertaken pre and post
opening of the extended and refurbished line. Pre-opening 62% planned to use the service. Post
opening a slightly smaller proportion 57% had already used it and an additional 19% planned to
use it. In total 76% (89% and 61% of the survey users on rail and bus respectively) had used or
intended to use the new service22.
I. Integrated Ticketing
From when Transport for London took over the concession of the Silverlink Metro routes, the
smart card ticketing already used on Transport for London’s other services such as London
Underground, London Buses and Tramlink could be used on the London Overground network20.
The smart card ticketing facilitated and encouraged the use of the network and multimodal
journeys. The smart card eliminated the barrier to using the service created by the need to
purchase a separate ticket and the higher financial cost associated with of National Rail tickets.
Instead the Transport for London smart card offers customers the best fares and will cap at lessInternational Symposium for Next Generation Infrastructure
October 1-4, 2013, Wollongong, Australia
than the price of an equivalent Day Travel Card or One Day Bus card if multiple journeys are
under taken in a 24-hour period20.
J. Integrated Transport
An indication of the success of the integration principles applied to London Overground is the
level of interchanging passengers from London Overground onto different other modes. In the
London Overground Impact Study1 it was identified that a fifth of London Overground
passengers interchange with London Underground or Transport for London’s light rail network
the Docklands Light Railway. Another 20% interchange onto London Buses or other London
Overground branches. This compares to half of all mainline railway passenger who switch onto
London Underground or Docklands Light Railway in the morning peak when arriving in
London1.
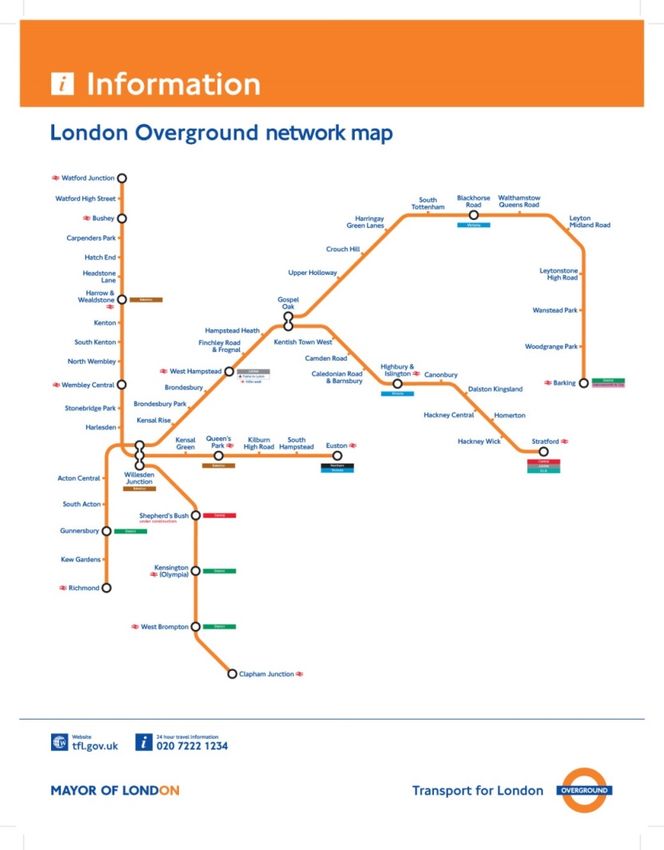
K. Switch from other services
The largest share of passengers switched from using London Buses or London Underground
to London Overground since Transport took over the management of the London Overground
network.
Figure 9: Modes Previously Used By Additional London Overground Passengers1
L. Performance – Customer Satisfaction
The railway passenger watchdog Passenger Focus undertakes research throughout the year to
gauge railway passengers’ opinion and raise concerns across the country. Passenger Focus’s
mission is to get the best deal for Britain’s passengers23. Twice a year Passenger Focus
undertakes a National Passenger Survey to produce a report on each of the UK’s train operating
company’s performance. The graph below illustrates how passenger’s overall satisfaction levels
have increased by nearly a half from 64% to 93%.International Symposium for Next Generation Infrastructure
October 1-4, 2013, Wollongong, Australia
London Overground London and South East
Spring Autumn Spring Autumn Spring Autumn Spring Autumn Spring Autumn
2008 2008 2009 2009 2010 2010 2011 2011 2012 2012
100
95
90
85
80
75
70
65
Figure 10: Overall Satisfaction with London Overground between 2008 and 2012 (%)19
M.Performance – Punctuality
Like all UK train operating companies London Overground is given a score on its
performance with regard to punctuality of its services. Two measures are used: Public
Performance Measure and Right Time. The former indicates which percentage of the services
that the train operator runs arrived within five minutes of the train’s scheduled arrival time24. The
Right Time performance measures the percentage of trains arriving early or within 59 seconds of
schedule25. The graph below indicates London Overground’s performance since Transport for
London took over the concession in 2007. The latest figures for London Overground are 96.8%
on Public Performance Measure and 86.6% on Right Time Measure, both annual moving
averages for July 2012 to 2013. These compare to 91.1% and 73%, respectively, when the
management of the routes was taken over by Transport for London. As the graph below
illustrates, on top of the notable increase in punctuality, the gap between the Public Performance
Measure and Right Time measure has been narrowed since the concession was taken over.International Symposium for Next Generation Infrastructure
October 1-4, 2013, Wollongong, Australia
Figure 11: Public Performance Measure & Right Time Performance on London Overground
from 2007 to 201126
III. Conclusion
London Overground has been a success with regard to various metrics. It has provided a
popular complementary service with enhanced capacity along the routes and in turn freeing up
capacity on other routes. It has also demonstrated the validity of Transport for London’s call to
give the Mayor of London, who supervises Transport for London, greater powers over transport
in the capital9. Not only can this offer customers a better integrated transport provision, but it can
also ensure the efficient use of investment and maximise revenues. Transport for London
believes that giving the Mayor a budget to operate London’s entire rail network would enable the
Mayor to balance London’s transport needs and service standards across the capital9. London
Overground’s success underlines the argument for Transport for London’s call.
London Overground is a successful example of the in-fill services Transport for London refers
to in their Delivering the Mayor’s Transport Strategy9 which are intended to complement the
major schemes by focusing management and invest in transport provision. London Overground
has improved connectivity to the areas it services, the popular service reroutes journeys that
previously were via Central London and thereby frees up capacity in the central areas. The
strategic interchanges it has creates between radial and orbital services contributes to this. The
higher service quality and frequency as offered customers across London better transport
provision and greater access to opportunities and services.International Symposium for Next Generation Infrastructure
October 1-4, 2013, Wollongong, Australia
References
1
Transport for London, “London Overground Impact Study”, London, 2012a.
2
Transport for London, “London Overground Map”, [Electronic version] URL:
http://www.projectmapping.co.uk/Reviews/Resources/London%20Overground%20network
%20T.jpg [cited 13 August 2013], 2008.
3
Transport for London, “London Overground: History”, [Electronic version] URL:
http://www.tfl.gov.uk/corporate/modesoftransport/londonrail/6836.aspx [cited 12 August
2013], 2013.
4
Transport for London, “London Overground: Highbury &Islington to West Croydon/Clapham
Junction”, [Electronic version] URL:
http://www.tfl.gov.uk/corporate/modesoftransport/londonrail/15360.aspx [cited 12 August
2013], 2013.
5
Transport for London, “London Overground Map”, [Electronic version] URL:
http://www.projectmapping.co.uk/Reviews/Resources/london-overground-map%20610.pdf
[cited 13 August 2013], 2011.
6
Transport for London “London Overground Map”, [Electronic version] URL:
http://www.projectmapping.co.uk/Reviews/Resources/london-overground-network-b.pdf
[cited 13 August 2013], 2012.
7
The London Plan, [Electronic version] URL:
http://www.london.gov.uk/priorities/planning/london-plan, [cited 12 August 2013], 2013.
8
Transport for London, “Mayor’s Transport Strategy”, Retrieved 12 August 2013, 2013.
9
Transport for London, “Delivering the Mayor’s Transport Strategy: National Rail in London –
Transport for London’s recommendation for the High Level Output Specification (2014-
2019)”, London, UK, 2011.
10
Mayor of London, “Mayor’s Transport Strategy”. London. 2011.
11
Transport for London, “Interchange Best Practice Guidelines”, [Electronic version] URL:
http://www.tfl.gov.uk/microsites/interchange/ [cited15 August 2013], 2013.
12
Transport for London, “Overground Loadweigh Report: Weeks commencing 10th and 17th
June 2013”, London, 2013i.
13
Transport for London, “London Overground Capacity”, [Electronic version] URL:
http://www.tfl.gov.uk/corporate/projectsandschemes/27141.aspx [cited 13 August 2013],
2013.
14
Transport for London, “Rolling Stock Information Sheets, 2nd Edition”, London, UK,
[Electronic version] URL:
http://www.tfl.gov.uk/assets/downloads/foi/rolling_stock_data_sheet_2nd_edition.pdf [cited
15 August, 2013], 2007.
15
Transport for London, “Stock Information Sheet”, London, UK, 2010.
16
Transport for London, “Keeping you safe”, [Electronic version] URL:
http://www.tfl.gov.uk/gettingaround/19461.aspx [cited 13 August 2013], 2013.
17
Transport for London, “More Overground trains”, [Electronic version] URL:
http://www.tfl.gov.uk/corporate/media/newscentre/metro/27884.aspx [cited 15 August
2013], 2013.
18
Passenger Focus, “National Passenger Survey – TOC Report for London Overground Spring
2011”, London, UK, 2011.International Symposium for Next Generation Infrastructure
October 1-4, 2013, Wollongong, Australia
19
Passenger Focus, “National Passenger Survey – TOC Report for London Overground Autumn
2012”, London, UK, 2012.
20
Transport for London, “London’s new train set”, London, UK. [Electronic version] URL:
http://www.tfl.gov.uk/assets/downloads/guide-to-london-overground.pdf [cited 15 August
2013], 2008.
21
Design Museum, “London Transport”, [Electronic version] URL:
http://designmuseum.org/design/london-transport [cited 15 August 2013], 2006.
22
Transport for London, “East London Line Re-opening – Impacts on Travel Patterns”, London,
UK, 2010.
23
Passenger Focus, “Home Page”, [Electronic version] URL: from
http://www.passengerfocus.org.uk [cited 15 August 2013], 2013.
24
UK, National Statistics, Topic Guide to: Rail, [Electronic version]
http://www.statistics.gov.uk/hub/travel-transport/other-modes-of-transport/rail [cited 15
August 2013], 2013.
25
Network Rail, “Performance and punctuality figures – Public Performance Measure (PPM)”,
[Electronic version] URL: http://www.networkrail.co.uk/about/performance/ [cited 15
August 2013], 2013.
26
London Overground Rail Operations Ltd, “London Overground (LOROL) Performance
Review”, [Electronic version], URL: http://theuic.com/downloads/1stPerfConf/Presentation-
MaureenDominey.pdf [cited 15 August 2013], 2011.
27
Transport for London, “London Overground Station Colour Standard for the Built
Environment”, [Electronic version] URL:
http://www.tfl.gov.uk/assets/downloads/corporate/overground-station-colour-standard-
issue04.pdf [cited 15 August 2013], 2008.
28
Transport for London, “London Overground Map”, [Electronic version] URL:
http://www.projectmapping.co.uk/Reviews/Resources/london-overground-map%20510.pdf
[cited 13 August 2013], 2010.
29
Transport for London, “London Overground Customer Charter”, [Electronic version] URL:
http://www.tfl.gov.uk/assets/downloads/customer-charter-feb2011.pdf [cited 13 August
2013], 2011.
30
Transport for London, “Design Standards”, [Electronic version] URL:
http://www.tfl.gov.uk/corporate/media/12523.aspx [cited 15 August 2013], 2013.You can also read