Investor Presentation - May 2018 - November 2016 - Amazon AWS
←
→
Page content transcription
If your browser does not render page correctly, please read the page content below
November 2016
Investor Presentation – May 2018

                                              PAGE 0
Disclosure
Yatra Online, Inc. (“Yatra”) or any of their respective affiliates make no representation or warranty as to the accuracy or completeness of the information contained
in this presentation. The data contained herein is derived from various internal and external sources and is not intended to be all-inclusive or to contain all of the
information that a person may desire in considering an investment in Yatra. It is not intended to form the basis of any investment decision. Yatra or any of their
respective affiliates assume no obligation to update the information in this presentation.
This presentation is for informational purposes only and does not constitute an offer to sell, a solicitation of any offer to buy, or a recommendation to purchase any
securities of or any of its affiliates (as such term is defined under the U.S. federal securities laws). The presentation shall not constitute a solicitation of a proxy,
consent or authorization with respect to any securities. This presentation shall also not constitute an offer to sell or the solicitation of an offer to buy any securities,
nor shall there be any sale of securities in any jurisdictions in which such offer, solicitation or sale would be unlawful prior to registration or qualification under the
securities laws of any such jurisdiction. No offering of securities shall be made except by means of a prospectus meeting the requirements of Section 10 of the
Securities Act of 1933, as amended.
Forward-Looking Statements
The statements in this presentation that are not historical facts are “forward-looking statements” within the meaning of the safe harbor provisions of the United
States Private Securities Litigation Reform Act of 1995. Forward-looking statements may be identified by the use of words such as “anticipate”, “believe”, “expect”,
“estimate”, “project”, “budget”, “forecast”, “intend”, “plan”, “may”, “will”, “could”, “should”, “predicts”, “potential”, “continue”, and other similar expressions that predict
or indicate future events or trends or that are not statements of historical matters. Such forward-looking statements are based on current expectations, estimates
and projections about the industry and markets in which Yatra operates. Yatra’s beliefs and assumptions are made by its management and are not predictions or
guarantees of actual performance. Accordingly, actual results and performance may materially differ from results or performance expressed or implied by the
forward-looking statements. No representation is made as to the reasonableness of the assumptions made within or the accuracy or completeness of any forward-
looking statements or other information contained herein. Factors that could cause future results and performance to differ from the forward-looking statements
include but are not limited to: (1) Yatra’s history of operating losses; (2) competition in the Indian travel industry; (3) declines or disruptions in the Indian economy;
(4) risks relating to any unforeseen liabilities of Yatra; (5) future capital expenditures, expenses, revenues, earnings, synergies, economic performance,
indebtedness, financial condition, losses and future prospects; businesses and management strategies and the expansion and growth of the operations of Yatra;
(6) the limited liquidity and trading of Yatra’s securities; (7) changes in applicable laws or regulations; (8) the possibility that Yatra may be adversely affected by
other economic, business, and/or competitive factors; and (9) other risks and uncertainties indicated from time to time in Yatra’s filings with the Securities and
Exchange Commission (the “SEC”).
Yatra cautions that the foregoing list of factors is not exclusive. Additional information concerning these and other risk factors is contained in Yatra’s most recent
filings with the SEC. All subsequent written and oral forward looking statements or other matters are expressly qualified in their entirety by the cautionary
statements above. Yatra cautions readers not to place undue reliance upon forward looking statements, which speak only as of the date made. Yatra undertakes
no obligation to update or revise any forward-looking statements, whether as a result of new information, future events or otherwise, except as required by law.

Industry and Market Data
Industry and market data used in this presentation have been obtained from industry publications and sources as well as from research reports prepared for other
purposes. Yatra has not independently verified the data obtained from these sources and cannot assure you of the data’s accuracy or completeness.

Other
All years are calendar years unless otherwise noted as “fiscal year” or “FY”.
                                                                                                                                                                             PAGE 1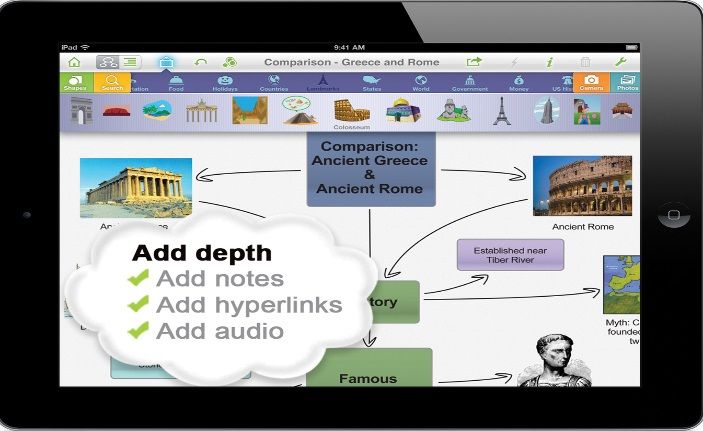
Investment thesis

 India is the fastest growing major economy, with travel spending growing at 1.7x GDP, with
 accelerating shift from offline to online.1

 q Yatra, India’s second largest online travel agent (“OTA”), is well-positioned to benefit from
        strong macroeconomic trends

 q Yatra’s multi-channel platform is a competitive advantage in the emerging Indian market

 q ATB acquisition gives Yatra leadership position in the defensible and lucrative Corporate
        Travel Market

 q Yatra continues to deliver strong growth posting Revenue Less Service Cost of INR 1,957.8
        million in Q3FY18, an increase of 45.6% YOY2,3
                                                 2,3                                                                                      46.1%                                     45.6%
         Revenue less Service Cost (INR MM)
         % Growth y-o-y
                                                           34.3%                                  33.8%

                           23.1%

                                                                                                                                                                                    1,958
                                                                                                   1,632                                   1,690
                   1,345                                   1,446

                  Q3FY17                                  Q4FY17                                 Q1FY18                                  Q2FY18                                     Q3FY18
1. Source: Phocuswright
2. Quarterly numbers for Revenue less service cost are as per unaudited results and exclude Other Income ; Includes ATB performance for 2 months in Q2FY18 and 3 months in Q3FY18
3. Refer to Appendix for definitions and reconciliations of non-IFRS measures                                                                                                                PAGE 2
India’s 2nd largest B2C & Largest corporate travel platform
Yatra’s multi-channel platform is a competitive advantage in the emerging Indian market

                                     Gross Bookings1                                                                                      Revenue Less Service Cost1,2
                                            (INR billion)                                                                                                (INR million)

                 CAGR                                                                                                                                                                      5,280
                                                                                                                             CAGR
                 19.3%                     68.0                                   66.6                                        23%                        5,154                  41.9%
                                                                 36.3%                                                                                                                     450
                        58.9                                                                                                                              373
                                           10.4                                   9.6                                                4,167
      47.8                                                     48.8                                                                                                          3,722         1,196
                         9.6                                                       23.9                                               243                1,124
                                                                                                                3,387                                                         242
       7.4                                                      7.8                                              190                 1,047
                                                                                                                                                                              839
                                                                16.5                                             866
                                           57.6                                   57.0
                        49.3                                                                                                                             3,657                             3,634
      40.4                                                     41.1                                                                  2,877                                   2,641
                                                                                                                2,331

      FY15             FY16                FY17               9MFY17            9MFY18                          FY15                 FY16                FY17            9MFY17         9MFY18

                                     Air             Hotels                                                                         Air             Hotels          Others

        7.4m                               76m                              83k+                                  82%                                77%                             700
     cumulative                            Visits4                        hotels in                       of transactions                           of traffic                  large
     customers3                                                        1,300+ cities5                      from repeat                                from                    corporate
                                                                                                            customers4                              mobile6                  customers7
1.   include ATB performance for 5 months in FY18
2.   Excludes Other Income; 9 months numbers are as per unaudited results ; Refer to Appendix for definitions and reconciliations of non-IFRS measures
3.   Cumulative as of Dec 31, 2017; does not include data for B2B2C businesses
4.   Data for the period Oct’17- Dec’17 for flagship brand Yatra.com only and excludes data from B2E and B2B2C businesses
5.   As of Dec 31, 2017
6.   Data for the period Oct’17- Dec’17
7.   Approximate count as of Dec 31, 2017 and includes corporate customers of ATB                                                                                                                PAGE 3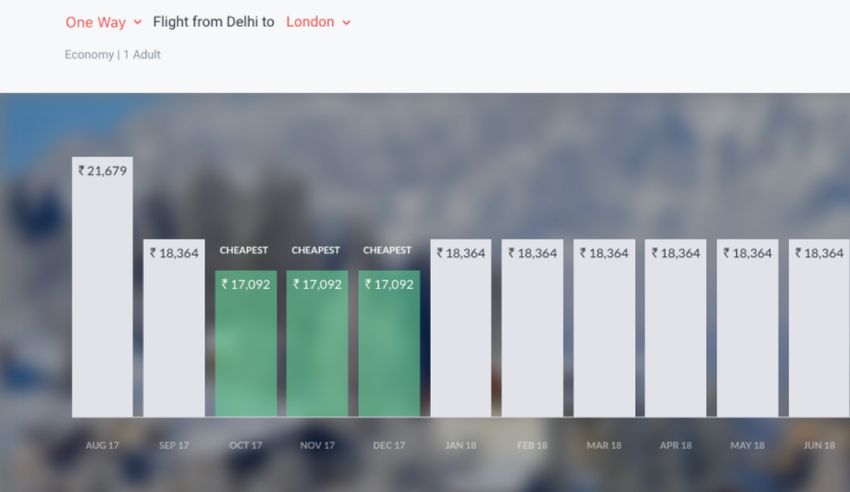
India is the fastest growing global economy with low
technology penetration
India’s GDP growth tops other economies1                                                                India’s travel industry has significant room to grow
(GDP Annual % change)                                                                                   (Airline spending2,2013, USD per capita)

          India       China          U.S.        Russia          Brazil        India Travel Spending
10%

     8%
                                                                                                                               39
                                                                                                                                               India            China

     6%
                                                                                                           China ~6x                                                24
                                                                                                                                              China ~8x
     4%                                                                                                      India                              India

     2%                                                                                                           7
                                                                                                                                                       3
     0%
      2017E                         2018E                         2019E                         2020E                  Air                                 Hotels

Internet users3 (million)                                                                                 Smartphone penetration rate4
       53%
                                                                                                                                                                    69%
       739                                         xx%      % of Population
                      34%
                                                                                                                                            52%         55%
                                                                                                                                    50%
                      462
                                      88%                                                                             38%
                                     287
                                                     66%             94%                                   22%
                                                                                   76%
                                                    139             118            110

     China           India           US            Brazil         Japan          Russia                   India       Brazil        Japan   China      Russia        US
1.   Source: Phocuswright, International Monetary Fund, World Economic Outlook Database, October 2017
2.   Source: Phocuswright, World Bank
3.   Source: Internetworldstats.com (June 2017)
4.   Source: newzoo Global Mobile Market Report (April 2017)
                                                                                                                                                                          PAGE 4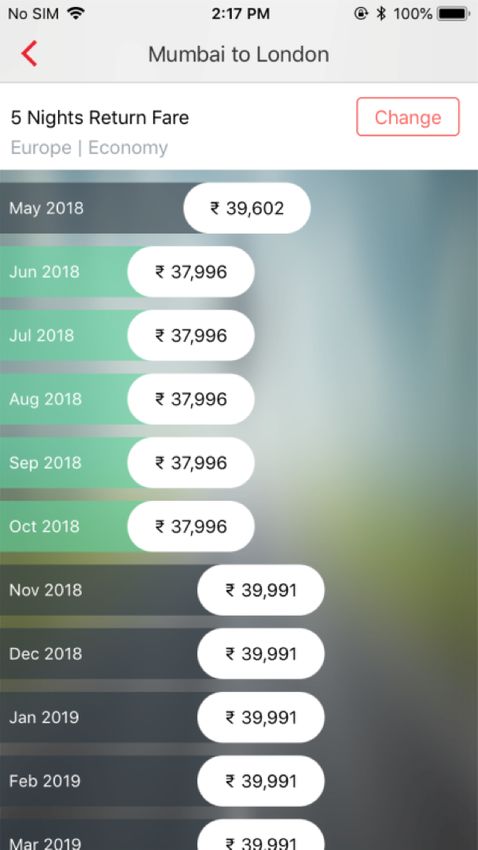
Indian air travel forecast to be world’s 3rd largest market
by 2032
Demographics, government policy, and an improved investment environment are driving
travel related growth, especially in Tier 2 and Tier 3 cities1.

Current Airline fleet and orders2                                                                                       Secondary and smaller regional airports are currently
                                                                                                                        growing faster than Major Metro Airports in India
                  147                             448                                                                   (YoY growth – passengers handled3)

                  114            190

                                                                                                                                                                                      24%
                  57       157
                                                                                                                                                                                                            21%
                                                                                                                                                                                      20%                   20%
                  30 119
                                                                                                                                                                                                            17%
                                                                                                                                                                                      16%
                  158        19                                                                                                                                 15%
                                                                                                                                                                13%
             17    5
                                                                                                                                          10%                   10%           Major Metro
              13       60                                                                                                                                                     Secondary
                                                                                                                                          7%
                                                                                                                                          5%                                  Smaller Regional
             4         6

             2     19
                                                                                                                                 2013-14               2014-15               2015-16                2016-17

            Current: 542 On Order: 1023
1. Tiers based on Indian Government House Rent Allowance (HRA) categories
2. Source: Company reports and press articles
3. Source: Airports Authority of India. “Major Metro Airports” represents airports with more than 10m air passengers in 2016-17; “Secondary Airports” represents airports with 5m – 10m air passengers in
   2016-17; “Smaller Regional Airports” represents airports with 200k – 5m air passengers in 2016-17
                                                                                                                                                                                                            PAGE 5
Online (Hotel + Air) Gross Bookings to grow nearly
2x to $13 billion by 2021E with 45% Penetration

 Indian hotel and air travel gross bookings

              2015                                                                   2017E                               2021E

                                                                                             Online
                              Online                                                          38%              Offline           Online
                               33%                                                                              55%               45%
                                                                           Offline
        Offline                                                             62%
         67%
                                                   16%                                                 16%
                                                  Online                                              Online
                                                  CAGR                                                CAGR

  Total: $16.2 billion                                                        Total: $19 billion                 Total: $28.6 billion
  Online: $5.4 billion                                                        Online: $7.2 billion               Online: $12.8 billion

Source: Phocuswright; online refers to online leisure / unmanaged business travel

                                                                                                                                          PAGE 6
India Air Travel Growth leading all Markets Globally.
Lodging Market expanding Online=3x(Offline Sales)
   India air travel passengers1                                                Indian air travel gross bookings2
   (million)                                                                   (USD billion)

               Domestic               International                                  Total air travel
                                            140.2                                    Online leisure and unmanaged business air travel
               120.0                               23.0          14.4%                                                         17.0
               20.1                                                                        11.1
                                                                                                                                          9.1

                                               117.2                                                     5.4
               99.9
                                                                 17.3%

               CY16                            CY17                                              2017E                            2021E

Indian lodging market continues to grow2                                       Low penetration rate for online bookings of hotels
(USD billion)                                                                  (Online percentage of gross bookings, 2017E)2
       Total Hotel Bookings Online Bookings
                                                                                                                52%
                                                          11.7                                                                        49%

            7.9

                                                                                               23%
                                                                         3.8

                            1.8

                  2017E                                      2021E                             Hotel             Rail                 Air

1. Source: Directorate General of Civil Aviation
2. Source: Phocuswright                                                                                                                         PAGE 7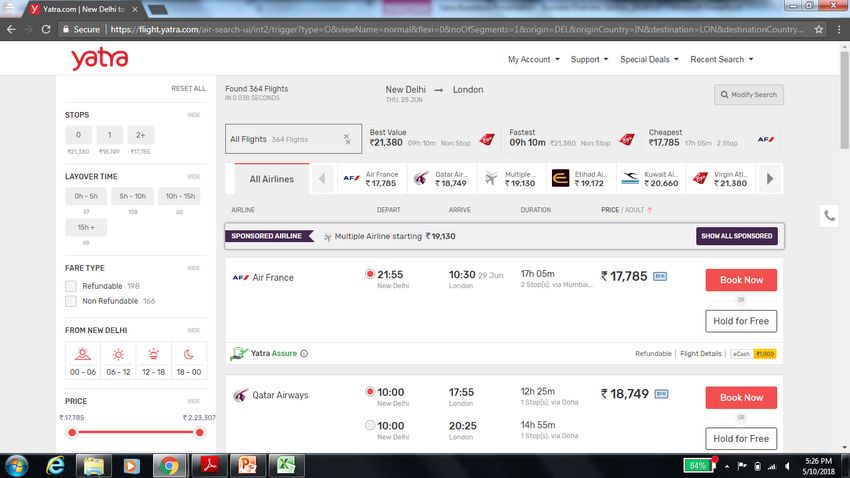
Consumer Spending – India is where China was

       Comparison of key economic and online commerce indicators between China and India

                                                                                           China1                           India1                   China 2015
               GDP per capita (USD)                                                 2004        $1,498               2014            $1,487            $7,9202

               Organized retail penetration                                         1999        ~10%                 2014            9-10%                 20%3

               Online shoppers                                                      2006            43m              2014             38m                  413m4

               Spend per online buyer (USD)                                         2007            $135             2014            $104              $1,7624

               Internet penetration                                                 2008            23%              2014             20%                  50%2

               Smartphone penetration                                               2010            13%              2014             14%                  58%5

       Chinese online travel agents have benefited from economic development
         Revenues6                                                  GDP per capita2                 Revenues6                                         GDP per capita2
         1,800                                                                 10                   600                                                          10
         1,500                                                                        8              500                                                            8
         1,200                                                                                       400
                                                                                      6                                                       IPO                   6
            900         IPO                                                                          300
                                                                                      4                                                                             4
            600                                                                                      200
            300                                                                       2                                                                             2
                                                                                                     100
               0                                                                      0                0                                                            0
                   2002 2004 2006 2008 2010 2012 2014                                                         2010     2011     2012        2013    2014     2015
                                                China GDP per capita (USD ‘000)                            Ctrip and Qunar revenues (USD million)
1.   Source: Credit Suisse Equity Research. India Internet Primer #2, August 2015
2.   Source: World Bank; internet penetration refers to internet users per 100 people
3.   Source: Business Standard, February 2015
4.   Source: Statista, 2015
5.   Source: Pew Research Centre. Represents % of adults who report owning a smartphone
6.   Source: Bloomberg
                                                                                                                                                                        PAGE 8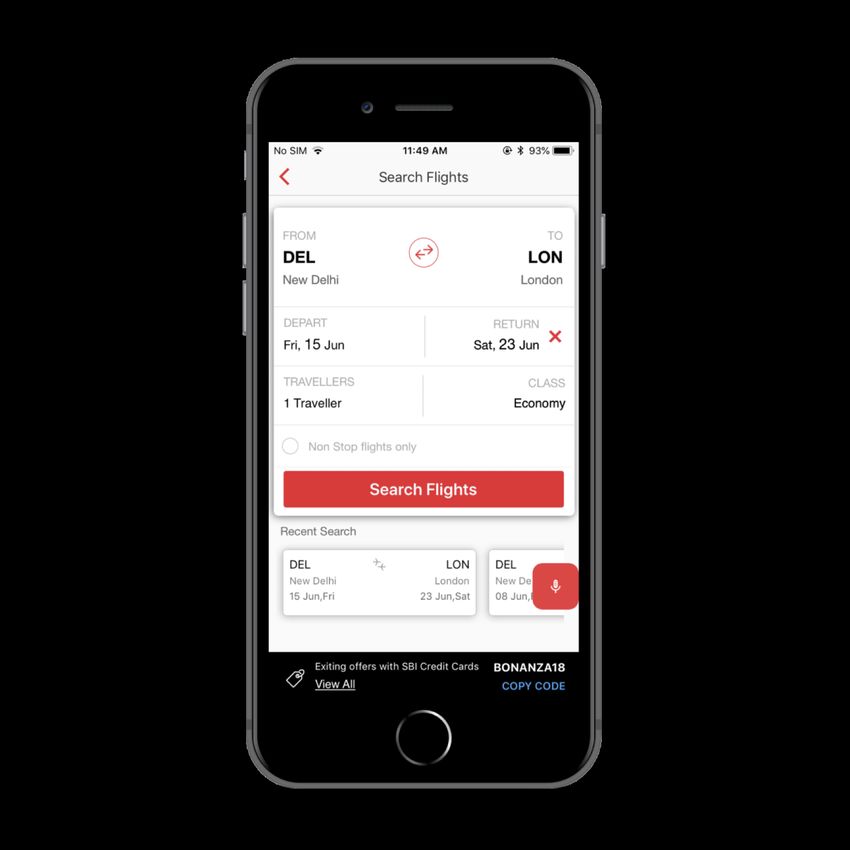
Our “secret sauce” – Yatra’s ecosystem links all
channels and products
Yatra is on a common technology platform. An affinity program (e-Cash), which allows
customers to use their eCash across channels, driving cross-sales and loyalty

      Multi-channel                                                                                                              Complete
     customer access                                                                                                             offerings

       Direct-to-consumer
                                                                                                                                       Air
              “B2C”                                                                                                            8 Domestic carriers
              ~76m visits1 ;
                                                                                                                            300+ International carriers
            ~7.4m customers2

                                                                                                                             Hotels & Lodging
       Corporate travelers                                                                                                  83,0004+ Indian properties
                                                                                                                             plus growing homestays
            “B2E”
      Corporate customers have
         ~4.2m employees3

                                                                                                                             Holiday packages

            Travel agents
              “B2B2C”
       ~19,000 registered agents                                                                                            Rail, bus, activities,
             across India4                                                                                                         others

1.   Data for the period Oct’17- Dec’17 for flagship brand Yatra.com only and excludes data from B2E and B2B2C businesses
2.   Cumulative as of Dec 31, 2017; does not include data for B2B2C businesses
3.   Approximate count as of Dec 31, 2017 and includes the employees of corporate customers of ATB
4.   As of Dec 31, 2017                                                                                                                                   PAGE 9
Selection – Yatra has a Differentiated Strategy in Hotels
Yatra has India’s largest hotel inventory, especially in the key “budget” category
in Tier 2 and Tier 3 cities
Yatra’s 83k+ units by market segment1,2,3 Key elements of Yatra’s hotel strategy
l Target segment: Focus on Tier 2 and Tier 3 cities.
83k+ hotels
l Marketing: Avoid creating “artificial” demand through
65.4k
discounting; building supply that better matches consumer
Yatra's budget hotels
Competition
price points
30k-45k hotels2 Yatra's mid-segment
hotels
l Marketplace strategy: Rolling out a marketplace in Hotels
Yatra's premium
hotels & Packages to leverage Yatra’s extensive network
l Investment in on-the-ground presence and a dedicated
14.4k
technology platform to support suppliers
3.3k
l Demand: Growth from cross selling to customers, deeper
Largest penetration in “budget” category penetration in the B2E segment
1. Management estimates, as of Dec 31, 2017
2. Management estimates from company websites, press articles, and filings
3. Includes ~6,500 homestay accommodations
PAGE 10Yatra + ATB is India’s largest Corporate Travel Platform
Yatra can leverage the large corporate market through cross selling to customers
India’s Corporate travel industry India’s Corporate travel industry has
($ Bn)1 significant room to grow1 ($Bn)
93
6%
291
12% 52
30
30
2015 2020P 2030P India China
Growth Rate of Corporate Travel Market Cross Sell Opportunity
India vs. China (2016-2020)1
12%
l Cross-sell personal travel to the captive
8%
Corporate Employee base of 4.2 MM2 across
5% Corporate customers of Yatra and ATB
l Cross-Sell Hotel inventory to the Corporate
customers of Yatra and ATB
India China Global Avg
1. KPMG & FCM Travel Report accessed from Travelbizmonitor.com
2. Approximate count as of Dec 31, 2017 and includes the employees of corporate customers of ATB PAGE 11A “Mobile-First” Company!
Yatra’s common technology platform supports a user-friendly, multi-app environment
12.7 mm App ~77% Traffic
Downloads1 from Mobile2
Bouquet of Apps 51% Hotel
– Main, Mini, Bookings & 40%
Corporate, Air Bookings3
Note:
1. As of Dec 31, 2017
2. Data for the period Oct’17- Dec’17 for flagship brand Yatra.com only and excludes data from B2E and B2B2C businesses
3. % of Online Bookings for the period Oct’17- Dec’17 for flagship brand Yatra.com only and excludes data from B2E and B2B2C businesses
PAGE 12Innovation – A Comprehensive Mobile or Web Offering
Only travel app in India with voice enabled flight search and book process
“YUVA” – Voice & text AI
- customers can book on
the go
(Google Assistant)
“Travel Talk” –
Share Personal
experiences
A suite of offerings across Mobile & Desktop platforms
PAGE 13Discovery – Differentiating Through Product Innovation
Innovative Features like ‘Xplore the World’ enable budget based search and planning
Select Top Available across mobile and desktop
Destinations
View lowest prices
in a time period
PAGE 14Our Loyalty Program
Rewarding customers & driving conversion of corporate travelers to our consumer offerings
• Over 3 million registered
• Specifically for frequent travelers
eCash customers1
82% transactions • Over 35,000 enrolled members3
• Earn and Burn across products
from repeat since launch in Feb’18
on Yatra platform customers2 in
• Special Member benefits
• Helps drive cross sell and Q3’18 up from 72%
§ Free cancellation up to Rs.10,000
in Q3’17
stickiness per year
• In a fragmented supplier § Spend linked rewards
§ Dedicated priority service desk
environment acts as a strong
value add
1. Approximate count as of Dec 31, 2017
2. Data for the period Oct’17- Dec’17 for flagship brand Yatra.com only and excludes data from B2E and B2B2C businesses
3. Approximate count as of May 8, 2018 PAGE 15Yatra for Business – Comprehensive Self Book Platform
1 Available across devices and platforms – leveraging “Consumer” UX
2 Enhanced capability to manage complex approval processes and enforce
policy compliance
3 Tightly Integrates with Corporate’s ERP and HRIS systems
PAGE 16B2B2C – Building an O2O Platform
As the largest Omni channel travel company in India with an agent base of 19,0001+ covering 350+ cities and towns
across India, Yatra uniquely positioned to capitalize on the O2O market opportunity
25mil+ Online
Shoppers on
Yatra/Month2
2.0% to 5.0%
Online Buyers
Connecting non-online buyers to
19,000+ local agents
• 83% of Indians and 90% in
smaller towns -- prefer cash
as a method of payment
• Helps connect customers
with agents in their
neighborhood
(1) Approximate count as of Dec 31, 2017 (2)Data for the period Oct’17- Dec’17 for flagship brand Yatra.com only and excludes data from B2E and B2B2C businesses PAGE 17The Yatra Team – A Track Record of Innovation
Management and employees own an estimated ~9% of Yatra
Years in Shared Experience
Name and title Background
travel industry
Dhruv Shringi l Experience: Ebookers.com, Ford Motors, 15
Co-Founder and Arthur Anderson Travel
CEO l Education: MBA - INSEAD, Chartered Accountant Industry
Manish Amin l Experience: Ebookers.com 25
Co-Founder and l Education: Btech National and Business Management –
CIO South Thames College, London
Online
Alok Vaish l Experience: HSIL Ltd., Deutsche Bank 10 Product
CFO l Education: MBA - Darden School of Business,
Chartered Accountant
Himanshu Verma l Experience: Flipkart, Yahoo 3
Internet
CTO l Education: EMP - IIM Bangalore, Univ. of Lucknow
Technologies
Sharat Dhall l Experience: Trip Advisor India, Hindustan Unilever 12
COO – B2C l Education: MBA - XLRI Jamshedpur, BITS Pilani
Operational
Akash Poddar l Experience: Travel Boutique Online, Triburg Sportswear, 9 Discipline
COO – B2B Indorama Synthetics
l Education: MBA - Thunderbird School of Management
Sunny Sodhi l Experience: Carlson Wagonlit, HRG Sita 17 Public Company
COO – B2E l Education: Bcom (Hons) Delhi University, Diploma in Experience
Hotel Management and Tourism
PAGE 18Yatra’s Q3 FY18 highlights
Delivered strong growth across all key parameters, mobile traffic exceeded desktop traffic1
72% 70% 38%
Growth in mobile app Growth in Hotel Room Nights
Growth in net transactions
install base4 Booked
37% 99% 26%
Growth in transacting Growth in mobile Growth in holiday
customers2 traffic packages passengers travelled
46% 129% 31%
Growth in Revenue less service
Growth in mobile Growth in Air Passengers
cost3
bookings5 Booked
Note:
1. Growth rates represent YoY growth from Q3FY17 to Q3FY18
2. Data for B2C and B2E business
3. Revenue less service cost is as per unaudited results; Refer to Appendix for definitions and reconciliations of non-IFRS measures
4. Includes Yatra main and Yatra Mini app
5. % of Online Bookings for flagship brand Yatra.com only and excludes data from B2E and B2B2C businesses PAGE 19Strong Growth and Margin Expansion
Growth has been consistent driven by bookings growth and net revenue margin expansion
l Revenue Less Service Cost1 grew by 45.6% in Q3FY18
l Net Revenue margin2 increased to 7.6% during Q3FY18
l Adjusted EBITDA1 losses of INR 388.3 million ($6.1 million) 3
Gross Bookings1 Revenue Less Service Cost1
(INR billion) (INR million)
CAGR 68.0 44.8% 5,154
23.9 CAGR
19.3% 58.9 23%
4,167
45.6%
1,958
47.8
16.5 3,387
1,345
FY15 FY16 FY17 Q3FY17 Q3FY18 FY15 FY16 FY17 Q3FY17 Q3FY18
1. Quarterly numbers for Revenue less service cost, adjusted EBITDA and Net Revenue margin are as per unaudited results; Refer to Appendix for definitions and reconciliations of non-IFRS measures; Includes
ATB performance for Q3FY18
2. Net Revenue Margin refers to Revenue less service cost divided by Gross Bookings. This excludes the Gross Bookings and Revenue less service cost associated with others segment
3. Converted into U.S. dollars at the exchange rate of 63.83 INR per USD PAGE 20Yatra’s Air Bookings continue to outpace market growth
Gross Bookings Air Passengers Booked 1,2
(INR million) (‘000s) 6,869
CAGR 27.8%
CAGR 19.3% 57,562 5,698
49,269
40,438 4,207
47.8% 31 %
2,308
20,449
1,761
13,838
FY15 FY16 FY17 Q3FY17 Q3FY18 FY15 FY16 FY17 Q3FY17 Q3FY18
Revenue Less Service Cost1,2
(INR million) 3,657
CAGR 25.3%
2,877
2,331
46% 1,370
939
FY15 FY16 FY17 Q3FY17 Q3FY18
1. Numbers for Q3FY18 Include ATB performance for 3 months
2. Quarterly numbers as per unaudited results ; Refer to Appendix for definitions and reconciliations of non-IFRS measures
PAGE 21Yatra’s Hotels and Packages business growth accelerating
Gross Bookings1 Room Nights Booked 1,2
(INR million) (‘000s)
1,383
CAGR 19% 10,436 CAGR 21%
9,614
1,139
7,368 944
29.4% 37.8%
504
3,488
2,695 365
FY15 FY16 FY17 Q3FY17 Q3FY18 FY15 FY16 FY17 Q3FY17 Q3FY18
Revenue Less Service Cost1,2
(INR million)
CAGR 13.9% 1,124
1,047
866
46.8%
437
298
FY15 FY16 FY17 Q3FY17 Q3FY18
1. Numbers for Q3FY18 Include ATB performance for 3 months
2. Quarterly numbers as per unaudited results ; Refer to Appendix for definitions and reconciliations of non-IFRS measures
PAGE 22Sustainable Take Rates as Yatra scales up
Total Net Revenue Margin1,2,3,4 Air Ticketing Net Revenue Margin1,2,3
7.5% 7.6%
6.7% 6.7% 7.0% 6.8% 6.7%
5.8% 6.4%
5.8% • Multichannel strategy,
along with growth in
supply expected to
provide stability going
forward
FY15 FY16 FY17 Q3FY17 Q3FY18 FY15 FY16 FY17 Q3FY17 Q3FY18
Q3FY18 mix of Revenue less service cost1,2 Hotels and Packages Net Revenue Margin1,2,3
Others 11.8% 12.5%
8% 10.9% 10.8% 11.1%
• Expected to improve due
Hotels &
to change in mix in favor
Packages of standalone hotels
22%
Air • Better negotiation with
Ticketing
70%
suppliers
FY15 FY16 FY17 Q3FY17 Q3FY18
B2E business has lower Net Revenue Margins than B2C business; however, we believe that the lower marketing spend required for
our B2E business may result in the profit contribution of that business being equal to or exceeding that of our B2C business
1. Refer to Appendix for definitions and reconciliations of non-IFRS measures
2. Net revenue Margin and Revenue less service cost are as per unaudited results for quarterly numbers; Includes ATB performance for Q3FY18
3. Net Revenue Margin refers to Revenue less service cost divided by Gross Bookings
4. This excludes the effect of Gross Bookings and Revenue less service cost associated with others segment PAGE 23Basis of financial presentation and use of non-IFRS
measures
The historical financial information regarding Yatra included in this investor presentation reflects Yatra’s fiscal year end of March 31, and has been derived from
audited financial statements of Yatra and its subsidiaries that were prepared in accordance with International Financial Reporting Standards, or IFRS as issued by
IASB, on a consolidated basis.
This presentation presents the metrics Revenue Less Service Cost, Adjusted EBITDA Losses, and Net Revenue Margin, which are non-IFRS measures. The
presentation of these non-IFRS measures, which are defined below, is not meant to be considered in isolation or as a substitute for Yatra’s consolidated financial
results prepared in accordance with IFRS as issued by the IASB and included in the previous filings with SEC. The non-IFRS financial metrics may not be
comparable to similarly titled measures reported by other companies due to potential differences in the method of calculation. A reconciliation of these non-IFRS
measures to the most comparable IFRS metric is set forth in this Appendix.
Description of Revenue Less Service Cost: As certain parts of Yatra’s revenue are recognized on a “net” basis and other parts of revenue are recognized on a
“gross” basis, Yatra evaluates its financial performance based on Revenue Less Service Cost, which is a non-IFRS measure. Yatra believes that Revenue Less
Service Cost provides investors with useful supplemental information about the financial performance of Yatra’s business and more accurately reflects the value
addition of the travel services that Yatra provides to its customers. The presentation of this non-IFRS information is not meant to be considered in isolation or as a
substitute for Yatra’s consolidated financial results prepared in accordance with IFRS as issued by the IASB. Yatra’s Revenue Less Service Cost may not be
comparable to similarly titled measures reported by other companies due to potential differences in the method of calculation. This Appendix reconciles Yatra’s
revenue, which is an IFRS measure, to Revenue Less Service Cost, which is a non-IFRS measure.
Description of Adjusted EBITDA: In addition to referring to Revenue Less Service Cost, we also refer to Adjusted EBITDA (Loss). We use financial statements
that exclude employee share-based compensation cost, Exceptional items, depreciation and amortization and change in fair value of warrants for our internal
management reporting, budgeting and decision making purposes, including comparing our operating results to that of our competitors. Because of varying available
valuation methodologies and subjective assumptions that companies can use when adopting IFRS 2 “Share based payment”, management believes that providing
non-IFRS financial measures that exclude such expenses allows investors to make additional comparisons between our operating results and those of other
companies.. Accordingly, we believe that adjusted EBITDA (loss) is useful in measuring the results of our company and provide investors and analysts a more
accurate representation of our operating results. However, the presentation of these non-IFRS measures are not meant to be considered in isolation or as a
substitute for our consolidated financial results prepared in accordance with IFRS as issued by the IASB. These non-IFRS measures may not be comparable to
similarly titled measures reported by other companies due to potential differences in the method of calculation. The IFRS measures most directly comparable to
adjusted EBITDA (loss) is Profit/(loss) for the period as per IFRS. A limitation of using Adjusted EBITDA (Loss) as against using the measures in accordance with
IFRS as issued by the IASB are that these non-IFRS financial measures exclude share-based compensation cost, non-recurring exceptional items, depreciation
and amortization, change in fair value of warrants, Share of loss of joint venture, Finance income, Finance costs and Income-Tax. Management compensates for
this limitation by providing specific information on the IFRS amounts excluded from Profit/(loss) for the period as per IFRS.
Description of Net Revenue Margin: Net Revenue Margin is defined as Revenue Less Service Cost as a percentage of Gross Bookings and represent the
commissions, fees, incentive payments and other amounts earned in our business. We follow Net Revenue Margin trends closely across our various lines of
business to gain insight into the performance of our various businesses.
Description of Gross Bookings: This presentation also uses the operating metric “Gross Bookings” which represents the total amount paid by our customers for
the travel services and products booked through us, including taxes, fees and other charges, and are net of cancellations and refunds.
All years are calendar years unless otherwise noted as “fiscal year” or “FY”.
PAGE 24Reconciliation of non-IFRS measures
Reconciliation of Revenue less service cost1
Air ticketing
Amount in INR million
Fiscal Year Ended Mar’31, 3 Months Ended Dec’31, 9 Months Ended Dec’31,
2015 2016 2017 2016 2017 2016 2017
Revenue 2,331 2,877 3,657 939 1,370 2,641 3,634
Service cost - - - - - - -
Revenue less service cost 2,331 2,877 3,657 939 1,370 2,641 3,634
Hotel and Packages
Revenue 4,007 5,218 5,315 1,340 1,840 4,065 4,879
Service cost (3,141) (4,171) (4,191) (1,043) (1,403) (3,227) (3,863)
Revenue less service cost 866 1,047 1,124 298 437 839 1,196
Others
Revenue 190 243 373 108 150 242 450
Service cost - - - - - - -
Revenue less service cost 190 243 373 108 150 242 450
Total
Revenue 6,528 8,338 9,345 2,387 3,360 6,948 8,963
Service cost (3,141) (4,171) (4,191) (1,043) (1,403) (3,227) (3,683)
Revenue less service cost 3,387 4,167 5,154 1,345 1,958 3,722 5,280
1. 3 months and 9 months numbers are as per unaudited results; Numbers for 3 months ended Dec’31 2017 include ATB performance for 3 months and Numbers for 9 months ended Dec’31, 2017 include
ATB performance for 5 months PAGE 25Reconciliation of non-IFRS measures
Reconciliation of Adjusted EBITDA (Loss)1
INR million FY15 FY16 FY17 Q3FY17 Q3FY18 9MFY17 9MFY18
Profit/(loss) for the period as per IFRS (948) (1,243) (5,937) (4,614) 232 (5,107) (3,671)
Employee share-based compensation costs 32 19 587 30 132 36 588
Depreciation and Amortization 209 234 276 65 111 194 303
Share of loss of joint venture 11 12 9 3 4 7 7
Finance income (93) (95) (139) (23) (17) (74) (74)
Finance costs 88 112 150 27 70 93 104
Change in fair value of warrants 0 3 (230) 65 (938) 61 1,418
Exceptional items 0 0 4,243 4,251 0 4,312 0
Income-Tax (43) 7 41 9 18 37 38
Adjusted EBITDA (Loss) (745) (952) (1,001) (187) (388) (442) (1,287)
1. 3 months and 9 months numbers are as per unaudited results; Numbers for Q3FY18 include ATB performance for 3 months and Numbers for 9MFY18 include ATB performance for 5 months
PAGE 26Operating Expense Details
Major operating expenses1,2 (INR Million, % of Revenue Less Service Cost)
Adjusted EBITDA(745) (952) (1,001) (187) (388) (442) (1,287)
(Loss)
7,066 2,631 7,506
4,425 5,412
6%
5% 1,632 6% 4401
6% 6%
5% 38%
5%
43% 39%
47% 47% 39%
41%
57%
48% 53%
43% 41% 46% 40%
34% 36% 41% 31% 37% 41%
32%
FY15 FY16 FY17 Q3FY17 Q3FY18 9MFY17 9MFY18
2
Personnel Marketing and sales promotion Other operating Depreciation and amortisation
1. 3 months and 9 months numbers are as per unaudited results; Numbers for Q3FY18 include ATB performance for 3 months and Numbers for 9MFY18 include ATB performance for 5 months
2. Includes Employee share based compensation cost
PAGE 27You can also read