EURO 7 IMPACT ASSESSMENT: THE OUTLOOK FOR AIR QUALITY COMPLIANCE IN THE EU AND THE ROLE OF THE ROAD TRANSPORT SECTOR OZONE SUPPLEMENT - An ...
←
→
Page content transcription
If your browser does not render page correctly, please read the page content below
EURO 7 IMPACT ASSESSMENT:
THE OUTLOOK FOR AIR QUALITY
COMPLIANCE IN THE EU AND
THE ROLE OF THE ROAD
TRANSPORT SECTOR

OZONE SUPPLEMENT

An independent study undertaken on behalf of ACEA
2
Executive Summary
This report is part of a Euro 7 Impact Assessmenta intended to quantify the impact on measured air
quality in urban environments throughout the EU 1 between 2020 and 2035 following the
implementation of currently mandated emission reduction measures 2 in all contributing sectors,
including road transport. The main study explored NO2, PM2.5, PM10 and Ozone; the aim of this study
is to focus on the effect of these measures on ozone, including the impact on compliance with EU
legislated targets and WHO guideline values.

The emissions Base Case adopted for this study is consistent with the Thematic Strategy on Air
Pollution Report #16 Current Legislation Baseline Scenario data from the GAINS3 model for all sectors
except road transport. Road transport emissions are derived from the SIBYL 4 baseline fleet and
COPERT5 emission tool. Specific elements of the Baseline fleet have been modified to more accurately
reflect the anticipated real-world fleet composition predicted by ACEA.6

To determine the impact of emission changes, the concentrations at urban monitoring stations across
the EU have been modelled using the AQUIReS+ model, developed by Aeris Europe and used in
previously published works on urban air quality.b, c

Regarding the impact on urban ozone, the results of this study indicate that widespread non-
compliance with the targets in the current Ambient Air Quality Directive (AAQD) d will continue
throughout the study period. The study also shows that the magnitude and extent of this non-
compliance increases significantly if the lower threshold in the current World Health Organisation
(WHO) guidelinese is applied. However, the effect of reducing road transport emissions beyond that
achieved in the Base Case does not improve the ozone compliance situation in urban areas.

NOX and NMVOC emissions are both important contributors to the photochemical production of
tropospheric (low-level) ozone on a regional scale. Therefore generally, the reduction of both these
pre-cursor emissions contributes to the reduction of tropospheric ozone. However, over cities, ozone
levels (produced through photochemical processes on the regional scale) are reduced due to the
titrating effect of NO (the most significant component of overall NOX emissions) to produce molecular
oxygen and NO2. This is most marked in densely trafficked city centres where the reductions in ozone
levels can be very significant, with reductions ranging from 10-20µg/m3. Therefore, when this titrating
effect is removed from the city, ozone levels/ozone non-compliance in the city increases. This is
despite any contribution that the NOX reductions in the city have on reducing photochemical
production of ozone at a regional scale.

This effect is most marked in cities where the regional, photochemical production of ozone is relatively
low e.g., Northern European countries bordering seas. This is clearly seen in the cities of Brussels,
London, and Paris but is also seen in the city of Madrid. The significance of this titration effect is clearly
demonstrated by the so-called ‘source receptor’ (SRs) relationships for ozone derived from the EMEP
model which are incorporated into IIASA’s Integrated Assessment Model, GAINS. Both models are

1 For the purposes of this study, the ‘EU’ includes the EU 27 nations and the United Kingdom.
2 Where it has not been possible to quantify the impact of a measure, for example the Medium Combustion Plant Directive,
emissions have not been reduced.
3 The Greenhouse gas - Air pollution Interactions and Synergies (GAINS) model, developed at the International Institute for

Applied Systems Analysis (IIASA).
4 SIBYL baseline: vehicle fleet and activity data projections for the member states of the of the EU.
5 COPERT is the EU standard vehicle emissions calculator, developed and maintained by EMISIA SA for the EEA.
6 The European Automobile Manufacturers' Association (ACEA) represents the 15 major Europe-based car, van, truck, and

bus makers.

                                                            3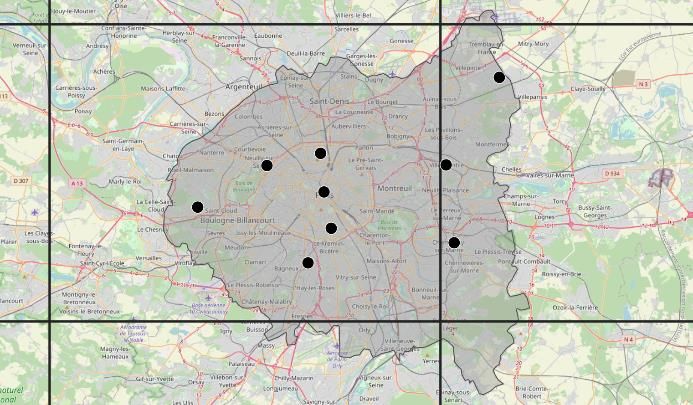
used to support air quality policy development in the EU and have been used to support the UN-ECE
Convention on Long Range Transport of Air Pollution (CLRTAP) for more than two decades. The
responses to NOX and NMVOC emission changes as seen through the lens of these SRs are discussed
in the body of this report and show that reductions in national NOX emissions in the countries where
these cities are located, result in increased ozone concentrations.

When it comes to NO2 compliance, the ozone response to NOX emission reductions creates an
‘environmental tension’ since reductions in NOX designed to reduce NO2 health impacts results in
increased ozone health impacts in such cities. This suggests targeted, city specific measures, rather
than the introduction of tougher EU-wide NOX emission limits is the wiser route to address the
diminishingly small residual ‘islands of NO2 non-compliance’.

The study also shows that a more effective strategy to reduce ozone, especially in urban areas, is to
target NMVOC emissions from the ‘solvent and product use’ sector. This sector is the largest
contributor to anthropogenic NMVOC emissions in the Base Case. The study also shows that further
NMVOC emissions reductions in other sectors has only a small effect on ozone levels/ozone
compliance.

a
  (Aeris Europe, 2021) Euro 7 Impact Assessment: The Outlook for Air Quality Compliance in the EU and the Role
of the Road Transport Sector
b
  (Aeris Europe, 2016) Urban Air Quality Study, #11/16
c
  (Concawe, 2018) A comparison of real driving emissions from Euro 6 diesel passenger cars with zero emission
vehicles and their impact on urban air quality compliance
d
  (Directive (EU) 2008/50/EC, 2008) Directive 2008/50/EC Of The European Parliament And Of The Council on
ambient air quality and cleaner air for Europe
e
  (WHO, 2005) WHO Air quality guidelines for particulate matter, ozone, nitrogen dioxide and sulfur dioxide

                                                      4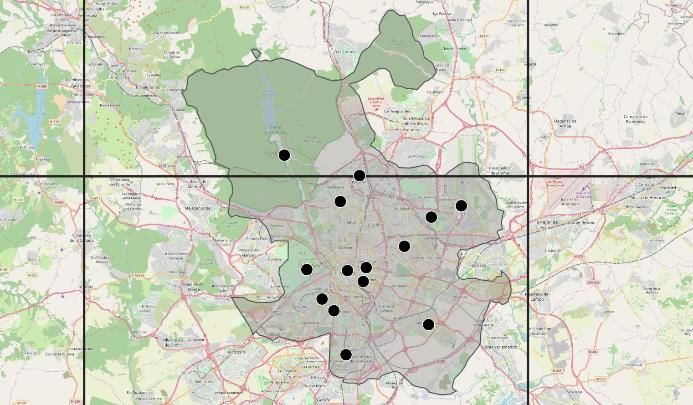
Contents
Executive Summary................................................................................................................................. 3
Introduction ............................................................................................................................................ 7
Methodology......................................................................................................................................... 11
   Overview of Base Case Emissions by Sector - NOX and VOCs ........................................................... 11
   Scenarios ........................................................................................................................................... 13
       Passenger Car and Light Duty Vehicle Scenarios .......................................................................... 13
       HDV and Bus Scenarios ................................................................................................................. 13
       Other Scenarios:............................................................................................................................ 13
   Ozone Targets ................................................................................................................................... 14
   Air Quality Model - AQUIReS+ .......................................................................................................... 14
Modelling Results.................................................................................................................................. 15
   An Insight Through the EMEP Source-Receptor Relationships ......................................................... 15
   Base Case Modelling Results............................................................................................................. 18
   Air Quality Response to Key Ozone Scenarios .................................................................................. 19
   City Focus .......................................................................................................................................... 20
Conclusions ........................................................................................................................................... 25
Appendices............................................................................................................................................ 26
   National Emissions ............................................................................................................................ 27
       NOX Base Case Emissions (kt/a) .................................................................................................... 27
       NMVOC Base Case Emissions (kt/a) .............................................................................................. 28
   SOMO35 and Daily Exceedances* at Stations in the Nine Cities (Base Case) .................................. 29
       Berlin ............................................................................................................................................. 29
       Brussels ......................................................................................................................................... 29
       London .......................................................................................................................................... 30
       Madrid........................................................................................................................................... 31
       Milan ............................................................................................................................................. 32
       Paris............................................................................................................................................... 32
       Rome ............................................................................................................................................. 33
       Stuttgart ........................................................................................................................................ 33
       Warsaw ......................................................................................................................................... 33
References ............................................................................................................................................ 34

                                                                             5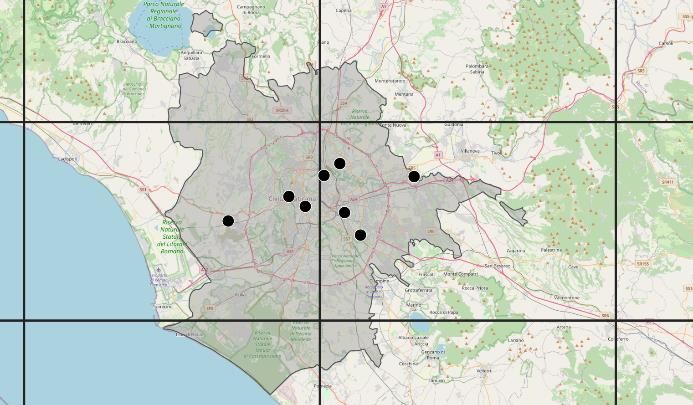
© 2021 Aeris Europe Ltd.

Report prepared by: Les White, Adam Miles, Chris Boocock, John-George Cooper, Stephen Mills.

Revision: 1.0

Background maps used in this report are © OpenStreetMap contributors. The full terms of this license are available at
https://www.openstreetmap.org/copyright

Extracts from ‘Ozone Trends in the United Kingdom over the Last 30 Years’ Florencia M. R. Diaz, M. Anwar H. Khan, Beth M.
A. Shallcross, Esther D. G. Shallcross, Ulrich Vogt, and Dudley E. Shallcross © 2020 by the authors. Licensee MDPI, Basel,
Switzerland. Used under the terms of the CC BY License.

                                                            6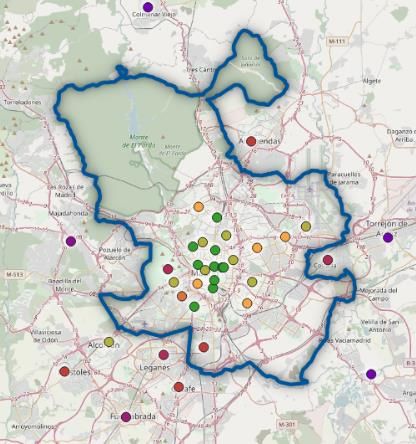
Introduction
Air Quality in European Cities continues to be an issue of policy and public concern at European,
national and city level. While the last few years has seen attention focussed almost exclusively on non-
compliance with the current AQLV for ambient nitrogen dioxide (NO2), over much of the EU
compliance with ozone target values remains an issue. Importantly, efforts to reduce NOX emissions
from road transport generally cause little to no reduction on ozone concentrations, and in many cities
increases ozone concentration.

The forthcoming revision of the AAQD is likely to reduce the permitted concentrations of specific
pollutants, this is likely to further intensify current concerns over air quality and increase the focus on
those emission sources that are believed to be major contributors to non-compliance. In response to
this, the European Commission have started to prepare draft regulatory proposals for the next
iteration of vehicle emission standards. To assist in the formulation of these Euro 7/VII proposals, the
Commission have contracted members of CLOVE (Consortium for Ultra Low Vehicle Emissions) to
conduct a series of studies.

The aim of this independent study is to put the contribution of road transport emissions into a Europe-
wide context by examining the impact on urban air quality that currently mandated emission
reduction measures from all contributing sectors will achieve. This is followed by an assessment of
what a further tightening of Euro standards, including a hypothetical ‘Euro 7/VII’ can offer to the
improvement of air quality compared to other available actions.

The AQUIReS+ model has been used to forecast the effect of emissions changes on atmospheric
concentrations at urban monitoring stations across the EU from 2020 to 2035. This ensures the
modelling is directly related to the individual measuring stations used to monitor compliance with the
legislated limit values. In this regard, it is worth noting that these limit values, as set forth in the
Ambient Air Quality Directive, are the result of a lengthy legislative process beginning with the ‘Risk
Assessment’ step undertaken by the WHO and concluding with the ‘Risk Management’ step of the
finalisation process of the Directive. As such, these limits represent the legislator’s view of the
appropriate level of managing the risk associated with human exposure to each pollutant in the
context of a multi-risk world. Therefore, from an air quality perspective, compliance with limit values
must be the priority for the protection of human health.

The main study explored NO2, PM2.5, PM10 and ozone (O3); the aim of this companion report is to
focus solely on ozone. In so doing, it draws on the detailed results and findings of the main study but
also provides additional ozone specific considerations, including a brief overview of the processes
involved in the formation of this secondary pollutant. It also seeks to compare the main findings with
other published studies.

Tropospheric ozone,1 commonly known as low-level ozone, is a recognised transboundary pollutant
and is photochemically formed in the boundary layer2 by the reaction of primary pollutants (e.g., NOX
and VOCs) in the presence of sunlight. Ozone production (and therefore concentrations) downwind of
cities and in rural and suburban areas, is typically higher than in cities due to the reaction between
local emissions of natural and/or anthropogenic NMVOCs and NOX exported from the cities. Within

1 The authors gratefully acknowledge the following source of information in the drafting of this introductory section:
Tropospheric ozone: background information (https://www.eea.europa.eu/publications/TOP08-98/page004.html)
2 The lowest part of the troposphere that is directly influenced by the presence of the earth's surface.

                                                             7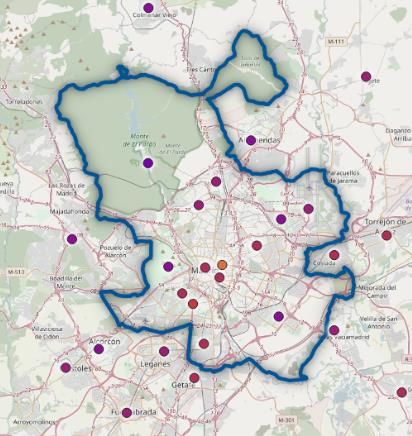
cities and more densely populated areas, where NOX emissions are typically higher, ozone
concentrations tend to be lower due to the titrating effect of NO.

The chemical formation of ozone
The photochemical chain reaction which produces ozone is initiated and maintained by reactive
radicals. VOCs act as ‘fuel’ in the formation process (from both biogenic and anthropogenic sources),
whereas NO essentially functions as a catalyst since it is regenerated in the formation process. NO also
plays a key role in the regeneration of the reactive radicals and the further progress of the reactions.

High concentrations of freshly emitted NO scavenge ozone from the local atmosphere, a process
leading to the formation of NO2. Close to the emission sources, this titration process is effectively an
ozone sink. Because of these reactions a decrease in NOX can lead to an increase in ozone, as is the
case in cities. This is known as a ‘VOC-limited regime’ and as such, emission control of VOCs is a more
efficient strategy to reduce peak values of ozone.

As an air mass moves away from an urban centre its VOC:NOX ratio changes due to further
photochemical reactions, meteorological processes, and the occurrence of fresh emissions. The
concentration of NOX decreases faster than that of VOC and consequently the VOC:NOX ratio is
amplified. At high VOC:NOX ratios, like those often found in background situations, the chemistry
tends towards the NOX limited case and NOX reductions are considered more effective to reduce ozone
in these situations.

The role of methane (CH4) in ozone formation
Methane is recognised as an important contributor to background ozone levels at a hemispherical
scale3 over long timescales. The background level in Europe and the USA is currently between 10 and
30ppb and is increasing by some 1ppb each decade. a,b However, over shorter timescales (days or
weeks), methane, due to its very low chemical reactivity, does not significantly contribute to
tropospheric ozone levels on top of this background level.

Figure 1 shows the long term (over three decades) trend in ozone concentrations and NOX
concentrations averaged over thirteen rural and six urban air quality monitoring stations in the UK.
The trend in average ozone concentration from the rural sites (showing an increase of some
1.3ppb/decade) is consistent with the general increase in background ozone in the northern
hemisphere as noted above. At the urban stations, this growth is more significant (some 2ppb/decade)
due to the additional contribution from increased urban ozone due to the loss in titration arising from
the significant decrease in NOX over the same period.

In contrast to the increase in annual mean ozone levels at the rural stations, the maximum ozone
(averaged over the thirteen stations) shows a strong downward trend, consistent with the significant
reductions in both NOX and VOC emissions through the wide range of legislative initiatives in Europe
over the same period.

3Given the effects of meteorology and global emissions on ozone production, background ozone levels (and production
processes) are typically divided into northern and southern hemispheres.

                                                          8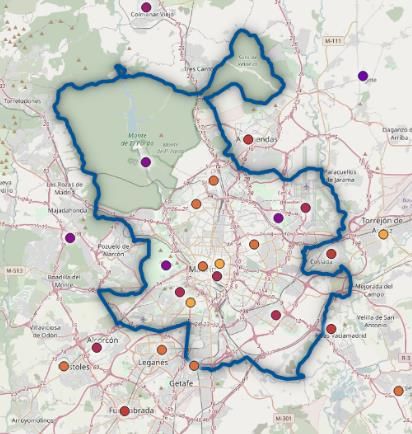
Figure 1 - Long term trends in average and maximum O3 and average NOX levels from 13 rural and 6 urban air
quality monitoring stations in the UK 4

4Extracted from ‘Ozone Trends in the United Kingdom over the Last 30 Years’ Florencia M. R. Diaz, M. Anwar H. Khan, Beth
M. A. Shallcross, Esther D. G. Shallcross, Ulrich Vogt, and Dudley E. Shallcross © 2020 by the authors. Licensee MDPI, Basel,
Switzerland and used under the terms of the CC BY License.

                                                              9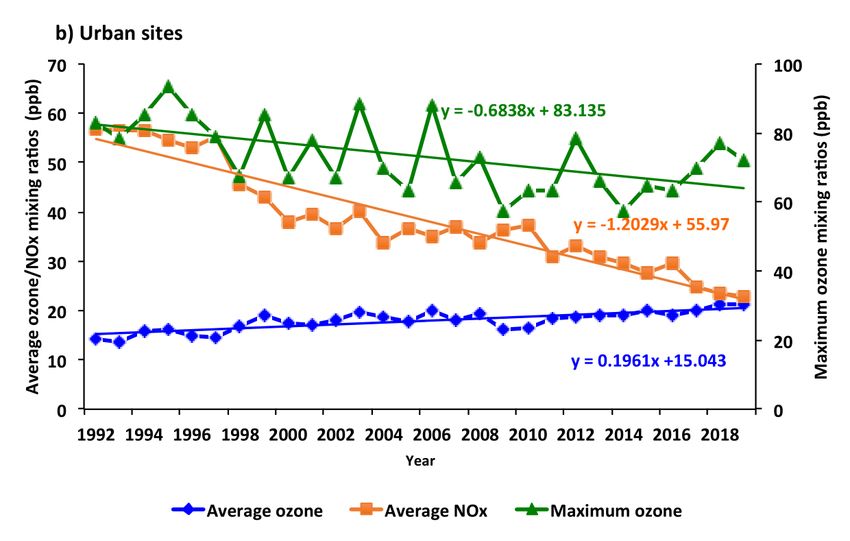
Table 1, derived from the same study, shows the number of 8-hour rolling average exceedances above
a 50ppb threshold in a year (average over the number of Rural and over the number of Urban stations).
The number of exceedances for the urban sites is clearly much lower than that for the rural sites due
to the titrating effect of NO over the urban areas.

The increase in average exceedances between the 1990s and the 2000s is indicative of the significant
reduction in road transport NOX emissions from the progressive introduction of Euro standards into
the pre-Euro standard vehicle parc in this period. The authors of the source paper indicate that the
subsequent reduction in exceedance in the next decade was likely due to the reduction in
anthropogenic NMVOCs from meeting the obligations of the 1999 Gothenburg protocol, which
reduced NMVOC emissions in the UK by some 40% from the 2000s to the 2010s. Although the UK is
used as an example, this is typical of EU member states.
Table 1 - Average ozone exceedances over the last three decades

        Site Type              1990s                2000s                 2010s                 Overall
          Rural                1941                 2141                  1412                   5494
          Urban                 532                  647                   376                   1554

Figure 2, also taken from the same study, shows the total number of exceedances for each day of the
week in both rural and urban sites averaged for the same three decades. Total exceedance is
calculated as the total number of hours over an ozone concentration of 50 ppb.

Again, these data show the much lower number of exceedances at urban sites, typically less than 20%
of the average of rural sites during a weekday. The increase in urban exceedances during the lower
traffic activity occurring at weekends is also very evident, again illustrating the effect of reduced ozone
titration.

Figure 2 - Daily total ozone exceedances in (a) rural and (b) urban sites averaged for the decades of the
1990s, 2000s and 2010s.

a
    (Golomb & Fay, 1989) The Role of Methane in Tropospheric Chemistry (MIT-EL-89-001)
b
    (Diaz, et al., 2020) Ozone Trends in the United Kingdom over the Last 30 Years

                                                      10
Methodology
Overview of Base Case Emissions by Sector - NOX and VOCs
One of the aims of this study was to put the emissions from each primary source sector into context.
This is important for two reasons: It provides a historical perspective, and it facilitates appropriate
prioritising of any new emission reductions.
Figure 3 shows the total Base Case emissions of NOX in the EU and Figure 4 the total Base Case
emissions of VOC used in this study. Each source sector is shown separately so that the contribution
of each to overall emissions can be clearly seen.
The detailed build-up of the emissions from Road Transport (based on the Sibyl Baseline developed
by Emisia) is given in the main report.1 The remaining sectoral contributions are consistent with the
TSAP16 Base Case Scenario developed by IIASA and associated with the revision of the EU’s Thematic
Strategy on Air Pollution.
2
Agri cul ture
Wa s te Ma na gement
Non Roa d Mobi l e Ma chi nery
Road Trans port
kt/a
Sol vent roduct Us e
Fuel Extra c on
Indus tri a l roces s es
Indus trial ombus on
2 Domes c ommerci a l ombus on
Energy roduc on
2 2 2 2 2 2 2 2
ear
Figure 3 - EU - NOX emissions Base Case. Source: GAINS IIASA
1(Aeris Europe, 2021) Euro 7 Impact Assessment: The Outlook for Air Quality Compliance in the EU and the Role of the Road
Transport Sector
117 Agri cul ture
Wa s te Ma na gement
Non Roa d Mobi l e Ma chi nery
Road Trans port
kt/a
Sol vent roduct Us e
Fuel Extra c on
Indus tri a l roces s es
2 Indus trial ombus on
Domes c ommerci a l ombus on
Energy roduc on
2 2 2 2 2 2 2 2
ear
Figure 4 - EU - NMVOC emissions Base Case. Source: GAINS IIASA
12Scenarios
All the scenario explored in the overall study are described in the main report,2 therefore only those
scenarios relevant to the ozone focus of this complementary report are described below.
Passenger Car and Light Duty Vehicle Scenarios
Scenario 7 - Diesel PC and LCV: NOX 0
For diesel PC and LCV N1-I both NOX and PM2.5 exhaust emissions were set to zero.
Scenario 8 - Diesel LCV N1-II and LCV N1-III: NOX 0
For diesel LCV N1-II and LCV N1-III both NOX and PM2.5 exhaust emissions were set to zero.
HDV and Bus Scenarios
Scenario 12 - Ultra-Low NOX scenario (Diesel HCV) NOX limit of 30 mg/kWh
An ultra-low NOX scenario modelling a reduction in NOX limit to 30mg/kWh by applying a coefficient
of 0.075 to diesel LCV N2 and HDV Base Case emissions.
Other Scenarios:
Scenario 9 - Zero Emissions from Domestic & Commercial Combustion
A hypothetical scenario to test the impact on air quality if residential and commercial emissions of
NOX were reduced to zero from 2025.
Scenario 15 - VOC Emissions from Road Transport: Zero
A hypothetical scenario to explore the impact on air quality of eliminating all VOC emissions from the
road transport sector from 2025, evaporative and exhaust.
Scenario 16 - VOC Emissions from Solvent and Product Use sector: 50%
A hypothetical scenario to explore the impact on air quality by reducing VOC emissions from the
‘solvent and product use’ sector by 50% from 2025.
2(Aeris Europe, 2021) Euro 7 Impact Assessment: The Outlook for Air Quality Compliance in the EU and the Role of the Road
Transport Sector
13Ozone Targets
The AAQD does not specify a binding limit value for ozone, instead there are target values for the
protection of human health and protection of vegetation. The WHO have also published a guideline
value for the protection of human health. These values are summarised in Table 2.
Table 2 - AAQD and WHO ozone target values for the protection of human health
Source Frequency Value (µg/m3) Allowed Exceedances
Maximum 25 days
AAQD – Protection of human health 120
daily (averaged over 3 years)
eight-hour
WHO – Protection of human health 100 0
mean
Air Quality Model - AQUIReS+
AQUIReS+ is Aeris Europe’s air quality forecasting model. Designed to predict the concentration of the
main pollutants covered by the AAQD, and compliance with air quality limit values at individual
monitoring stations in the European Air Quality monitoring station network. The detail of the
modelling system, including its sister tool ‘AQUIReS’, is covered in detail in the main report.3
For ozone, the AQUIReS+ model was used to generate a series of predictions for the ozone metrics of
‘SOMO35’4 and the ‘Maximum daily 8 hour mean’ (rolling average). The primary metric in the source-
receptor relationships (derived from EMEP modelling runs) to relate emission changes of NOX and
NMVOC to changes in ozone is SOMO35. Within the AQUIRES+ modelling framework, the SOMO35
metric, derived from hourly historical measuring station data, is statistically correlated to the
‘Maximum daily 8 hour mean’ (rolling average), again based on hourly measuring station data. These
relationships are generated for each individual measuring station.
Station selection criteria and the uncertainty aspects of the modelling are discussed in detail in the
main report.
3 (Aeris Europe, 2021) Euro 7 Impact Assessment: The Outlook for Air Quality Compliance in the EU and the Role of the Road
Transport Sector
4 SOMO35 - defined as the sum of means over 35 ppb from a daily maximum 8-hour rolling average
14Modelling Results
The current AAQD specifies a non-binding target value for the protection of human health from
exposure to ozone. This is based on limiting the number of exceedance days in one year to 25 days of
the rolling eight-hour average concentration above an ozone concentration threshold of 120µg/m 3,
averaged over three-years.
The WHO 2005 Guidelines reduces the daily threshold from 120µg/m3 (in their previous published
guidelines) to 100µg/m3. This study therefore also examines the implications of this lower threshold,
should it be adopted in a future revision of the AAQD.
An Insight Through the EMEP Source-Receptor Relationships
As discussed in the introduction, the formation of ozone in the atmosphere is a complex
photochemical process involving reactive hydrocarbons (NMVOC1) and oxides of nitrogen. Complex
chemical models have been developed to represent these reactions, including the EMEP model
developed and maintained by the Norwegian Meteorological Institute.2
Data from the EME model is used to generate European ‘source-receptor’ (SR) functions which relate
emissions (e.g., NMVOC and NOX) from each country and sea area to their contribution to pollutant
concentrations in each ‘receptor grid’ of the model domain. These SRs are derived from the results of
a large number of EMEP model simulations undertaken by the Norwegian Meteorological Institute.
For the whole European region (comprising more than forty countries and five sea areas) this involves
some 1200 individual simulations. In each run, the emissions of a single pollutant, from a single
country or sea area, are reduced from an emissions ‘Base ase’ by %. This same run is repeated for
five separate meteorological years to enable the inter-annual meteorological variability to be built
into a set of ‘five meteorological year averaged’ SRs. Aeris gratefully acknowledges the co-operative
relationship with NMI in their provision of these detailed simulations results which enabled generation
of detailed SR functions for the whole of Europe and their incorporation into AQUIReS+. It is worth
noting, that these SRs are consistent with those incorporated into the IIASA GAINS model used to
support the European ommission’s Clean Air for Europe Programme (CAPE).
In themselves, these SRs at the individual EMEP grid level provide a helpful insight into the ozone
response to reductions of both NOX and NMVOC emissions, especially at the urban level, which is the
focus of this study.
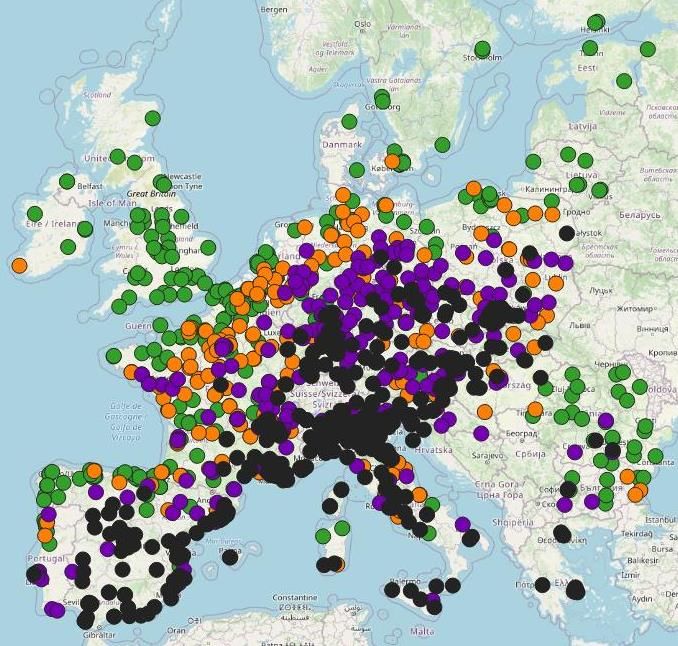
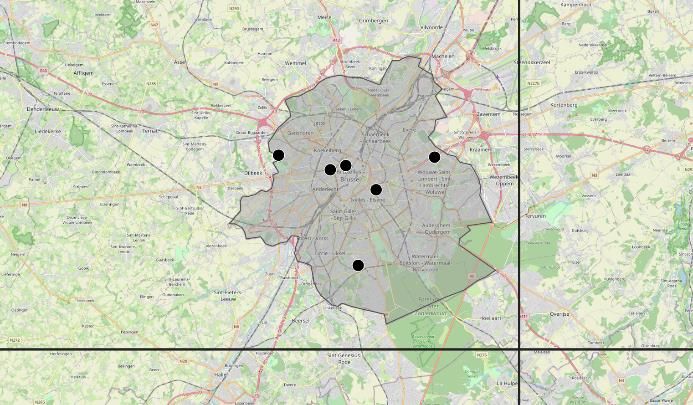
Figure 5 shows maps of four of the nine selected cities.3 In each case, the maps are overlaid with the
boundaries of the EMEP grids that correspond to the city domain. In addition, the locations of the
ozone monitoring stations are also shown. For each EMEP grid, the SR relationship for SOMO35
consists of a NOX and NMVOC emission term from each contributing country (including the country in
which the city is located).
1 NMVOC - Non-Methane Volatile Organic Compounds
2 The co-operative programme for monitoring and evaluation of the long-range transmission of air pollutants in Europe:
'European Monitoring and Evaluation Programme' (EMEP). A scientifically based and policy driven programme under the
Convention on Long-range Transboundary Air Pollution (CLRTAP) for international co-operation to solve transboundary air
pollution problems. The EMEP model has been used to support European Air Quality Policy for more than three decades.
3 Berlin, Brussels, London, Madrid, Milan, Paris, Rome, Stuttgart, and Warsaw
15Brussels In Figure 6, the SOMO35 response to a 1kt
change in emissions from both NOX and NMVOC
is shown for all nine selected cities including
Brussels, Paris, Madrid and Rome.4 The SOMO35
responses to a change of 1kt of emissions in the
country in which the city is located, and the
equivalent change of 1kt (shared proportionally)
from all the other contributing countries are
shown separately.
Although ozone is a transboundary air pollutant,
Madrid
Figure 6 shows that the most significant
influence per unit change in emissions is from
the country in which the city is located. This is
particularly evident in the case of Brussels,
London, Madrid, and Paris.
Furthermore, the significant increase in
SOMO35 in these cities when NOX emissions are
reduced in the country where these cities are
located, is also evident. This is consistent with
Paris the long-term measurement data from UK
monitoring stations discussed in the
introduction of this report. It is also evident from
the monitoring station data in the city of Madrid,
as discussed below.
In contrast, the response to reductions in
NMVOCs across all cities is to reduce SOMO35,
affirming that targeting these emissions, rather
than NOX, at least in the short/medium term, is
Rome the appropriate urban ozone mitigation
strategy.
Figure 5 - Maps of four of the nine selected cities,
overlaid with EMEP model grids and indicating the
location of ozone monitoring stations
4 For simplicity, if a city covers multiple grids, only one grid is represented in Figure 6.
16Berlin Brussels London Madrid Milan Paris Rome Stuttgart Warsaw
SOMO35 per kt change in emissions 5
4
3
2
1
0
-1
-2
-3
NMVOC from the city's parent country NMVOC from all other countries
NOₓ from the city's parent country NOₓ from all other countries
Figure 6 - The SOMO35 response to a 1kt emission reduction in the nine selected cities based on the SRs
derived from EMEP simulations
Figure 7 shows the levels of SOMO35 in Madrid based on measurement station data from the city and
its surrounding area. Here the SOMO35 for ozone has been calculated at each ozone measuring station
for 2005, 2010 and 2015.
In 2005 (with road transport made up of a mix of Pre-Euro, Euro I, Euro II, and a few Euro III vehicles)
the NO component of NOX emissions from road transport activity in the city centre substantially
reduces ozone levels compared to the suburban and rural areas around the city centre. In terms of
SOMO35, the health impact metric, the reduction is five-fold.
Over the next ten years NOX vehicle emission limits were progressively reduced, and NOX/NO
emissions fell. By 2010 the effect of the reduced NO emissions is already visible with the SOMO35
level in the city centre doubling from the 2005 level, and by 2015 increasing to three to four times the
2005 level.
Of course, these reductions in NOX have made an important contribution to the reduction of NO2 in
the city of Madrid and to compliance with the NO2 limit value. However, ozone also has important
health impacts and this ‘environmental tension’ between reducing NO2 concentrations and increasing
ozone concentrations is an important consideration in the development of any further action to
address NOX emissions.
2005 2010 2015
Figure 7 - SOMO35 based on monitoring data in Madrid: 2005 - 2010 - 2015
17Base Case Modelling Results
By 2025, ozone concentrations in the Base Case are predicted to meet the EU target of 25 exceedance
days at all but 12% of the 1166 monitoring stations currently located in urban and suburban areas of
the EU that have recorded exceedances in the last five years. This increases to 74% of stations if the
limit is reduced to 100µg/m3. A summary of Base Case compliance is shown in Table 3.
Table 3 – Number of ozone monitoring stations exceeding the EU target value of allowable exceedances of
25 days above a 120 µg/m3 threshold and WHO guide value threshold of 100 µg/m3 5
2020 2025 2030 2035
EU AAQD: 120µg/m3 (> 25 days) 204 (17%) 145 (12%) 116 (10%) 110 (9%)
WHO: 100µg/m3 (> 25 days) 921 (77%) 884 (74%) 851 (71%) 841 (70%)
Between 2020 and 2030 the number of urban and suburban stations that are non-compliant with the
EU target value reduces by over 43% as a result of currently mandated emission reduction measures.
However, this reduction is not seen in the case of the WHO threshold value of 100µg/m3. Against the
WHO value, the reduction is only 8%, with over 70% of stations remaining non-compliant and only
marginal further improvement by 2035. Compliance with the WHO guide value would therefore be a
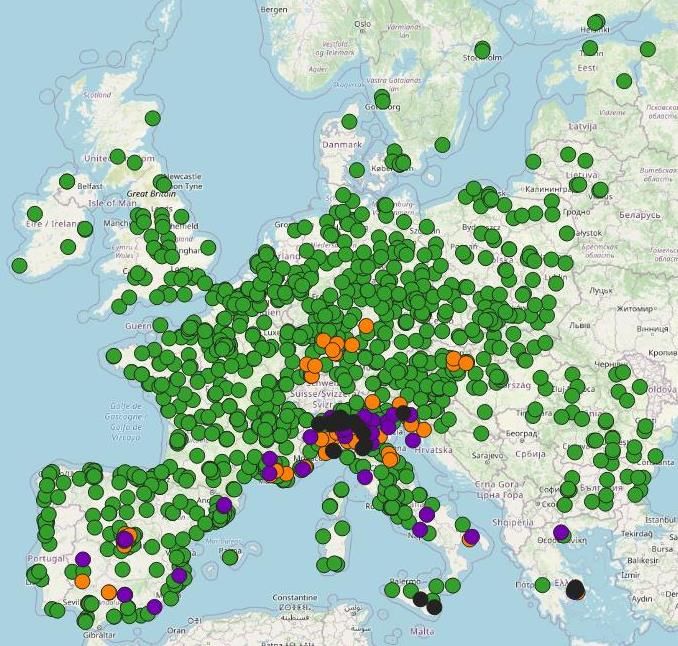
significant challenge in the EU. This difference in the compliance picture is clearly shown in Figure 8.
Figure 8 - Ozone exceedance days in 2030 against the AAQD 120µg/m 3 target and WHO 100µg/m3 guideline
5AQUIReS+ requires a monitoring station to have recorded exceedances in the past five years to be able to predict
exceedances. Therefore, stations which have never recorded an exceedance are excluded from these totals. This also
means that there are slightly different numbers of stations for the two concentrations:
• 120µg/m3 - 1166 stations
• 100µg/m3 - 1198 stations
18Air Quality Response to Key Ozone Scenarios
As discussed earlier in the report, reducing NOX emissions can increase ozone concentrations,
particularly in cities and city centres, whereas reducing NMVOC emissions reduces ozone
concentrations both in and outside the city. Therefore, to ascertain the scale of possible reductions in
ozone concentration the scenario that has the greatest impact on NMVOC emissions (Scenario 16),
and the elimination of all (exhaust and evaporative) NMVOC emissions from road transport are briefly
looked at here.
Table 4 shows that eliminating VOC emissions from road transport has a marginal impact on
compliance across the EU. This is the case for both the EU AAQD target value and the WHO guideline
value. This limited impact is consistent with the small contribution that modern gasoline and diesel
vehicles make to total VOC emissions. This indicates that any further tightening of VOC emission limits
for road transport (exhaust or evaporative) would have a minimal impact on ozone compliance.
Conversely, further reducing emissions from the ‘solvent and product use’ sector is foreseen to have
a more significant impact on ozone compliance in the EU. This reflects the much higher contribution
from this sector to VOC emissions in the Base Case.
Table 4 – Number of non-compliant ozone measuring stations (urban and suburban) with ozone
exceedances for key scenarios at 120µg/m3 and 100µg/m3
2020 2025 2030 2035
120µg/m3 (> 25 days)
Base Case 204 (17%) 145 (12%) 116 (10%) 110 (9%)
VOC Emissions from Road Transport: Zero
204 (17%) 138 (12%) 109 (9%) 108 (9%)
Scenario 15
VOC Emissions from Product Use sector: 50%
204 (17%) 107 (9%) 88 (8%) 83 (7%)
Scenario 16
100µg/m3 (> 25 days)
Base Case 921 (77%) 884 (74%) 851 (71%) 841 (70%)
VOC Emissions from Road Transport: Zero
921 (77%) 870 (73%) 839 (70%) 824 (69%)
Scenario 15
VOC Emissions from Product Use sector: 50%
921 (77%) 839 (70%) 800 (67%) 770 (64%)
Scenario 16
19City Focus
For each of the nine selected cities, Table 5 through Table 13 provide the results of the modelled
compliance with the current EU AAQD exceedance target.6 The results are given for the Base Case and
the key scenarios impacting ozone:
• Scenario 7: Zero NOx from Diesel Passenger Cars and Vans
• Scenario 15: Zero VOC emissions from all road transport
• Scenario 16: A 50% reduction in the Base Case VOC emissions from the Solvent and Product
Use sector from 2025.
The tables provide the modelled number of exceedance days at each ozone measuring station in each
of the cities. The colours indicate the ‘compliance uncertainty bands' based on the RMS deviation
between measured exceedance days and modelled exceedance days. The ‘green’ designation
indicates compliance, the ‘yellow’ uncertain compliance/non-compliance and the ‘red’, non-
compliance.
By 2025, only three of the selected cities, Madrid, Milan and Paris are predicted to remain non-
compliant in the Base Case (i.e., with at least one station remaining non-compliant). The suburban
stations in these cites generally have higher levels of exceedance than urban stations while urban
traffic stations having the lowest levels of exceedance. This is particularly visible in the case of Madrid,
where exceedance levels at the urban traffic stations are some 7 days/year compared to the
exceedances at the three suburban stations ranging between 33 and 39 days per year. This is entirely
consistent with the significant titration of ozone by the NO component of NOX emissions particularly
in city centres as discussed in the introduction. Although compliant, this pattern of higher exceedance
days in suburban stations is evident in each of the studied cities.
The impact of the key emission reduction scenarios affecting ozone compliance are also given in these
tables. The road transport NOX reduction scenario (Scenario 7: Zero NOx diesel passenger cars and
vans from 2025) has negligible impact beyond the baseline in all nine cities. As discussed in the main
report, the additional emission reduction beyond that achieved by the Base Case is very limited,
however, even this small further reduction in NOX increases the non-compliance at one station in the
cities of Madrid and Paris. Again, this is consistent with the expectation from the EMEP source
receptor relationship for these two cities as discussed in the introduction (Figure 6).
The zero NMVOC emissions from road transport (Scenario 15) also has little impact on compliance
given the small contribution of road transport to overall NMVOC levels, shown in Figure 4. However,
as expected, this reduces exceedances by one day in a limited number of stations.
Of all the scenarios considered in this study, the most significant improvement in ozone compliance
come from the 50% reduction in NMVOC emissions from the ‘solvent and product use’ sector
(Scenario 16). This is particularly evident in the cities of Madrid, Milan, and Paris.
6No more than 25 exceedance days per year of the highest 8-hour rolling average ozone concentration in a 24-hour period
above the threshold of 120µg/m3
20Table 5 - City of Berlin: Ozone Exceedance Days > 25 Days (120µg/m3 threshold) Base Case and Selected Scenarios
Base Case Scenario 7 Scenario 15 Scenario 16
Type Area 2025 2030 2035 2025 2030 2035 2025 2030 2035 2025 2030 2035
BACKGROUND SUBURBAN 15 13 13 15 13 13 14 13 13 13 11 11
BACKGROUND URBAN 14 12 12 14 12 11 13 12 11 11 10 9
BACKGROUND URBAN 12 11 10 12 10 10 12 10 10 10 9 8
Table 6 - City of Brussels: Ozone Exceedance Days > 25 Days (120µg/m3 threshold) Base Case and Selected Scenarios
Base Case Scenario 7 Scenario 15 Scenario 16
Type Location 2025 2030 2035 2025 2030 2035 2025 2030 2035 2025 2030 2035
BACKGROUND SUBURBAN 13 13 13 13 13 13 13 13 13 12 12 12
BACKGROUND SUBURBAN 14 13 13 14 13 13 12 12 12 8 8 7
BACKGROUND URBAN 10 9 9 10 9 9 9 9 9 8 8 8
BACKGROUND URBAN 7 7 7 7 7 7 6 6 6 6 6 6
BACKGROUND URBAN 6 6 6 6 6 6 6 6 6 5 5 5
TRAFFIC SUBURBAN 0 0 0 0 0 0 0 0 0 0 0 0
Table 7 - City of London: Ozone Exceedance Days > 25 Days (120µg/m3 threshold) Base Case and Selected Scenarios
Base Case Scenario 7 Scenario 15 Scenario 16
Type Area 2025 2030 2035 2025 2030 2035 2025 2030 2035 2025 2030 2035
BACKGROUND URBAN 9 9 9 9 9 9 9 9 9 9 9 9
BACKGROUND URBAN 4 5 5 4 5 5 4 5 5 4 4 4
BACKGROUND URBAN 3 4 4 3 4 4 3 4 4 3 3 3
BACKGROUND URBAN 0 1 1 0 1 1 0 1 1 0 0 0
BACKGROUND URBAN 0 0 0 0 0 0 0 0 0 0 0 0
BACKGROUND SUBURBAN 0 0 0 0 0 0 0 0 0 0 0 0
TRAFFIC URBAN 0 0 0 0 0 0 0 0 0 0 0 0
21Table 8 - City of Madrid: Ozone Exceedance Days > 25 Days (120µg/m3 threshold) Base Case and Selected Scenarios
Base Case Scenario 7 Scenario 15 Scenario 16
Type Location 2025 2030 2035 2025 2030 2035 2025 2030 2035 2025 2030 2035
BACKGROUND SUBURBAN 33 33 34 33 33 34 31 32 33 28 29 30
BACKGROUND SUBURBAN 34 33 32 34 33 32 33 32 32 31 29 29
BACKGROUND SUBURBAN 39 40 41 39 40 41 38 39 39 34 35 35
BACKGROUND URBAN 33 32 31 33 32 31 32 31 31 30 29 28
BACKGROUND URBAN 26 27 27 26 27 28 25 26 27 23 23 24
BACKGROUND URBAN 31 32 32 31 32 32 30 31 31 27 28 28
BACKGROUND URBAN 25 26 26 25 26 26 25 25 26 24 24 24
BACKGROUND URBAN 27 28 28 27 28 28 26 27 27 23 24 24
BACKGROUND URBAN 13 14 14 13 14 14 12 13 13 10 11 11
TRAFFIC URBAN 20 20 20 20 20 20 19 20 20 18 18 18
BACKGROUND URBAN 5 6 6 5 6 6 5 5 5 3 3 4
BACKGROUND URBAN 20 21 21 20 21 21 19 20 20 17 17 18
TRAFFIC URBAN 7 7 7 7 7 7 7 7 7 6 6 6
TRAFFIC URBAN 7 7 7 7 7 7 6 6 7 5 5 6
Table 9 - City of Milan: Ozone Exceedance Days > 25 Days (120µg/m3 threshold) Base Case and Selected Scenarios
Base Case Scenario 7 Scenario 15 Scenario 16
Type Area 2025 2030 2035 2025 2030 2035 2025 2030 2035 2025 2030 2035
BACKGROUND URBAN 65 60 59 65 60 58 61 57 56 50 45 44
BACKGROUND URBAN 29 25 24 29 25 23 26 23 22 18 15 13
BACKGROUND URBAN 28 24 23 28 24 23 25 22 21 18 14 13
22Table 10 - City of Paris: Ozone Exceedance Days > 25 Days (120µg/m3 threshold) Base Case and Selected Scenarios
Base Case Scenario 7 Scenario 15 Scenario 16
Type Location 2025 2030 2035 2025 2030 2035 2025 2030 2035 2025 2030 2035
BACKGROUND URBAN 10 9 8 10 9 8 10 9 8 8 7 7
BACKGROUND SUBURBAN 6 5 5 6 5 5 6 5 5 5 4 3
BACKGROUND URBAN 13 13 13 13 13 13 12 13 13 12 12 12
BACKGROUND URBAN 5 4 4 5 4 4 5 4 3 4 3 2
BACKGROUND URBAN 12 12 13 12 12 13 12 12 12 11 11 11
BACKGROUND URBAN 13 14 14 13 14 15 13 13 14 11 12 12
BACKGROUND URBAN 3 4 4 3 4 4 3 3 4 1 2 2
BACKGROUND URBAN 3 4 4 3 4 4 2 3 4 1 2 2
BACKGROUND URBAN 2 2 3 2 2 3 1 2 2 0 0 1
Table 11 - City of Rome: Ozone Exceedance Days > 25 Days (120µg/m3 threshold) Base Case and Selected Scenarios
Base Case Scenario 7 Scenario 15 Scenario 16
Type Location 2025 2030 2035 2025 2030 2035 2025 2030 2035 2025 2030 2035
BACKGROUND URBAN 22 18 16 22 17 15 21 16 15 16 11 10
BACKGROUND URBAN 12 8 6 12 8 6 11 7 5 6 2 1
BACKGROUND SUBURBAN 11 7 6 11 7 5 10 6 5 5 2 0
BACKGROUND URBAN 7 4 2 7 3 2 6 2 1 2 0 0
BACKGROUND SUBURBAN 0 0 0 0 0 0 0 0 0 0 0 0
BACKGROUND URBAN 0 0 0 0 0 0 0 0 0 0 0 0
BACKGROUND URBAN 6 5 5 6 5 5 5 5 5 4 4 3
BACKGROUND URBAN 1 1 1 1 1 1 1 1 1 1 1 1
23Table 12 - City of Stuttgart: Ozone Exceedance Days > 25 Days (120µg/m3 threshold) Base Case and Selected Scenarios
Base Case Scenario 7 Scenario 15 Scenario 16
Type Area 2025 2030 2035 2025 2030 2035 2025 2030 2035 2025 2030 2035
BACKGROUND URBAN 23 23 23 23 23 23 23 23 22 23 22 22
Table 13 - City of Warsaw: Ozone Exceedance Days > 25 Days (120µg/m3 threshold) Base Case and Selected Scenarios
Base Case Scenario 7 Scenario 15 Scenario 16
Type Area 2025 2030 2035 2025 2030 2035 2025 2030 2035 2025 2030 2035
BACKGROUND URBAN 5 4 4 5 4 4 5 4 4 4 3 3
BACKGROUND URBAN 8 8 8 8 8 8 8 8 8 8 8 8
BACKGROUND URBAN 2 1 0 2 0 0 1 0 0 1 0 0
24Conclusions
The current AAQD requirements are based on an ozone threshold of 120µg/m3 and a maximum annual
number of 25 days in exceedance of this value. By 2025, with Base Case emissions, about 87% of the
urban/suburban monitoring stations in the EU achieve the non-binding limit on exceedance days. All
the ‘beyond the baseline road transport scenarios’ explored in the study have very limited further
impact on the Base Case situation. This is especially so for further NOX emission reductions due to the
loss of the titrating effect of NO, and its involvement in reducing ozone over urban areas. In contrast
to this, further action to reduce VO emissions from the ‘solvent and product use’ sector was found
to have a more significant impact on compliance. This is in-line with the findings by others as discussed
in the introduction of this report.
At the more stringent ozone threshold in the WHO Guidelines, ozone compliance in 2025 falls to just
2 % of the urban/suburban monitoring stations in the EU. Despite this high level of ‘non-compliance’,
all the ‘beyond the baseline road transport scenarios’ explored at this stage have very limited further
impact on the Base Case situation. Again, in contrast to this, further action to reduce VOC emissions
from the ‘solvent and product use’ sector has a more significant impact on ozone compliance.
The focus on the nine selected cities clearly shows significant reductions in ozone levels in cities and
especially city centres arising from the titration of ozone by the NO component of NOX emissions. This
is visible from the much lower exceedance days in urban traffic stations. This is consistent with the
findings in other studies and with the insights provided through source-receptor relationships derived
from the EMEP model.
Although ozone was modelled in the COVID scenarios considered in this study, given the strong
interannual/monthly variations in concentrations it was difficult to discern the ‘ OVID’ signal from the
Base Case. However, other studies have shown that during lockdown periods ozone levels have
increased, particularly in city centres, due to the loss of the titrating effect of NO emissions.a
The consistent finding of this study, that reducing NOX emissions increases ozone levels and ozone
non-compliance in urban environments, highlights the ‘environmental tension’ between reducing NO2
levels in urban environments and the consequential increase (and potentially significant increases) in
ozone related impacts. As the main study shows, NO2 non-compliance is currently confined to very
limited islands of non-compliance in the EU. Given the demonstrated efficacy of the continuing impact
of Euro 6/VI in further reducing these small islands of non-compliance, the study findings indicate a
better strategy would be to use local measures to address these rather than further EU-wide
measures. Conversely, non-compliance with EU and WHO ozone targets would suggest that reducing
NMVOC emissions from the Solvents and Product Use Sector should be a high priority. However, given
the nature and sources of these emissions it is likely that legislation at an EU level would be necessary
to effectively target this sector and reduce concentrations of ozone.
a
(Lee, et al., 2020) UK surface NO2 levels dropped by 42% during the COVID-19 lockdown: impact on surface
O3
25Appendices
26National Emissions
NOX Base Case Emissions (kt/a)
2005 2010 2015 2020 2025 2030 2035
AT 213 166 139 101 75 63 59
BE 305 241 213 173 141 124 119
BG 145 118 83 79 66 55 51
HR 76 67 62 57 48 43 40
CY 21 17 13 9 7 6 5
CZ 287 219 180 146 119 101 94
DK 177 134 113 89 71 61 59
EE 35 30 30 27 23 19 19
FI 181 171 147 126 109 96 91
FR 1395 1112 937 753 578 461 409
DE 1428 1266 1064 846 681 558 536
GR 373 279 223 191 152 126 121
HU 146 121 106 82 67 56 51
IE 133 84 79 69 54 44 39
IT 1207 905 779 645 501 422 387
LV 44 39 32 30 26 23 22
LT 46 40 41 33 23 20 19
LU 30 22 16 11 7 5 5
MT 9 8 7 4 3 2 2
NL 362 291 240 193 162 142 135
PL 790 823 635 532 426 358 341
PT 247 183 153 135 112 97 90
RO 277 220 196 177 155 137 129
SK 99 79 69 61 55 50 47
SI 51 44 37 26 19 15 13
ES 1385 877 734 624 518 449 415
SE 184 147 125 101 80 68 65
GB 1537 1074 956 727 561 437 409
EU 11183 8778 7406 6047 4838 4041 3770
27NMVOC Base Case Emissions (kt/a)
2005 2010 2015 2020 2025 2030 2035
AT 170 138 129 116 111 105 105
BE 151 128 122 119 118 114 114
BG 128 108 79 67 60 53 53
HR 101 78 71 64 59 56 56
CY 11 9 7 7 6 6 6
CZ 196 167 155 136 127 112 112
DK 112 91 78 66 62 58 58
EE 37 34 33 32 31 28 28
FI 118 100 86 74 67 63 63
FR 1217 849 731 659 617 593 593
DE 1185 1024 944 900 877 818 818
GR 263 199 168 142 135 117 117
HU 130 110 97 85 78 73 73
IE 59 47 46 45 44 41 41
IT 1165 890 811 755 700 670 670
LV 56 47 44 39 36 34 34
LT 80 66 64 60 53 47 47
LU 14 9 8 8 7 7 7
MT 4 3 3 3 3 3 3
NL 172 150 148 143 141 139 139
PL 605 549 502 457 429 403 403
PT 224 171 154 146 143 134 134
RO 394 337 268 231 208 179 179
SK 71 72 64 61 59 56 56
SI 45 40 37 35 34 31 31
ES 871 728 666 637 625 615 615
SE 206 177 160 137 131 125 125
GB 1063 785 711 681 677 673 673
EU 8846 7105 6386 5901 5637 5350 5350
28SOMO35 and Daily Exceedances* at Stations in the Nine Cities (Base
Case)
* Exceedances are daily exceedances of the 120µg/m3 daily maximum of the 8-hour rolling mean as
defined in the AAQD.
Berlin
Daily Exceedances
Type Area 2010 2015 2020 2025 2030 2035
BACKGROUND SUBURBAN 20 16 17 15 13 13
BACKGROUND URBAN 14 19 16 14 12 12
BACKGROUND URBAN 12 14 14 12 11 10
SOMO35
Type Area 2010 2015 2020 2025 2030 2035
BACKGROUND SUBURBAN 2205 2475 1884 1759 1668 1641
BACKGROUND URBAN 2022 1952 1708 1586 1497 1471
BACKGROUND URBAN 1879 2132 1606 1499 1422 1399
Brussels
Daily Exceedances
Type Area 2010 2015 2020 2025 2030 2035
BACKGROUND SUBURBAN 16 11 13 13 13 13
BACKGROUND SUBURBAN 18 11 13 14 13 13
BACKGROUND URBAN 12 9 9 10 9 9
BACKGROUND URBAN 13 6 7 7 7 7
BACKGROUND URBAN 5 6 6 6 6 6
TRAFFIC SUBURBAN 0 0 0 0 0 0
SOMO35
Type Area 2010 2015 2020 2025 2030 2035
BACKGROUND SUBURBAN 1497 1510 1504 1523 1512 1505
BACKGROUND SUBURBAN 1417 1519 1425 1443 1432 1425
BACKGROUND URBAN 1063 1330 1069 1082 1074 1069
BACKGROUND URBAN 844 886 848 859 852 848
BACKGROUND URBAN 780 646 784 794 788 784
TRAFFIC SUBURBAN 532 589 535 542 538 535
29London
Daily Exceedances
Type Area 2010 2015 2020 2025 2030 2035
BACKGROUND URBAN 8 9 9 9 9 9
BACKGROUND URBAN 3 4 4 4 5 5
BACKGROUND URBAN 2 2 3 3 4 4
BACKGROUND URBAN 2 0 0 0 1 1
BACKGROUND URBAN 0 0 0 0 0 0
BACKGROUND SUBURBAN 0 0 0 0 0 0
TRAFFIC URBAN 0 0 0 0 0 0
SOMO35
Type Area 2010 2015 2020 2025 2030 2035
BACKGROUND URBAN 857 1003 1091 1225 1327 1344
BACKGROUND URBAN 783 703 915 997 1060 1069
BACKGROUND URBAN 678 556 792 863 917 925
BACKGROUND URBAN 296 311 377 423 459 464
BACKGROUND URBAN 201 154 235 256 272 274
BACKGROUND SUBURBAN 653 607 663 678 689 689
TRAFFIC URBAN 15 15 17 19 20 20
30Madrid
Daily Exceedances
Type Location 2010 2015 2020 2025 2030 2035
BACKGROUND SUBURBAN 53 29 31 33 33 34
BACKGROUND SUBURBAN 46 55 36 34 33 32
BACKGROUND SUBURBAN 46 53 37 39 40 41
BACKGROUND URBAN 39 43 35 33 32 31
BACKGROUND URBAN 26 33 25 26 27 27
BACKGROUND URBAN 24 49 30 31 32 32
BACKGROUND URBAN 21 25 25 25 26 26
BACKGROUND URBAN 19 40 26 27 28 28
BACKGROUND URBAN 11 15 12 13 14 14
TRAFFIC URBAN 10 24 19 20 20 20
BACKGROUND URBAN 9 4 5 5 6 6
BACKGROUND URBAN 6 28 19 20 21 21
TRAFFIC URBAN 6 11 7 7 7 7
TRAFFIC URBAN 5 6 6 7 7 7
SOMO35
Type Location 2010 2015 2020 2025 2030 2035
BACKGROUND SUBURBAN 3049 3562 3146 3211 3247 3270
BACKGROUND SUBURBAN 3835 4606 3581 3489 3424 3396
BACKGROUND SUBURBAN 3517 3801 3628 3704 3745 3772
BACKGROUND URBAN 3598 3426 3359 3273 3211 3186
BACKGROUND URBAN 2783 2915 2871 2931 2963 2985
BACKGROUND URBAN 3016 3224 3111 3176 3211 3234
BACKGROUND URBAN 2022 2613 2086 2130 2153 2169
BACKGROUND URBAN 2809 3883 2898 2958 2991 3013
BACKGROUND URBAN 2130 2831 2198 2244 2268 2285
TRAFFIC URBAN 2401 3100 2477 2529 2556 2575
BACKGROUND URBAN 1739 2674 1794 1831 1852 1865
BACKGROUND URBAN 2478 2882 2557 2610 2639 2658
TRAFFIC URBAN 1637 2181 1689 1724 1743 1756
TRAFFIC URBAN 1447 1640 1493 1524 1541 1552
31Milan
Daily Exceedances
Type Area 2010 2015 2020 2025 2030 2035
BACKGROUND URBAN 79 64 72 65 60 59
BACKGROUND URBAN 72 35 35 29 25 24
BACKGROUND URBAN 47 41 34 28 24 23
SOMO35
Type Area 2010 2015 2020 2025 2030 2035
BACKGROUND URBAN 4658 5007 4124 3896 3748 3703
BACKGROUND URBAN 3370 2968 2938 2748 2625 2586
BACKGROUND URBAN 3344 3146 2915 2727 2605 2566
Paris
Daily Exceedances
Type Area 2010 2015 2020 2025 2030 2035
BACKGROUND URBAN 12 13 12 10 9 8
BACKGROUND SUBURBAN 10 16 8 6 5 5
BACKGROUND URBAN 11 12 12 13 13 13
BACKGROUND URBAN 13 8 7 5 4 4
BACKGROUND URBAN 9 14 11 12 12 13
BACKGROUND URBAN 10 8 12 13 14 14
BACKGROUND URBAN 5 5 2 3 4 4
BACKGROUND URBAN 0 5 2 3 4 4
BACKGROUND URBAN 8 0 1 2 2 3
SOMO35
Type Area 2010 2015 2020 2025 2030 2035
BACKGROUND URBAN 1687 1709 1449 1354 1288 1264
BACKGROUND SUBURBAN 1831 1773 1573 1469 1397 1372
BACKGROUND URBAN 1391 1578 1507 1601 1660 1696
BACKGROUND URBAN 1700 1680 1461 1365 1298 1274
BACKGROUND URBAN 1289 1848 1396 1483 1538 1571
BACKGROUND URBAN 1220 1185 1322 1404 1456 1488
BACKGROUND URBAN 1076 1041 1166 1239 1284 1312
BACKGROUND URBAN 1065 1081 1153 1225 1270 1298
BACKGROUND URBAN 992 845 1075 1142 1184 1209
32Rome
Daily Exceedances
Type Location 2010 2015 2020 2025 2030 2035
BACKGROUND URBAN 45 37 30 22 18 16
BACKGROUND URBAN 32 25 18 12 8 6
BACKGROUND SUBURBAN 31 24 18 11 7 6
BACKGROUND URBAN 26 23 13 7 4 2
BACKGROUND SUBURBAN 20 10 1 0 0 0
BACKGROUND URBAN 17 14 5 0 0 0
BACKGROUND URBAN 9 8 7 6 5 5
BACKGROUND URBAN 6 2 2 1 1 1
SOMO35
Type Location 2010 2015 2020 2025 2030 2035
BACKGROUND URBAN 3276 3242 2782 2543 2395 2338
BACKGROUND URBAN 2849 2609 2419 2211 2083 2033
BACKGROUND SUBURBAN 2872 3346 2438 2229 2100 2050
BACKGROUND URBAN 2660 3430 2259 2065 1945 1899
BACKGROUND SUBURBAN 3003 3535 2607 2425 2307 2264
BACKGROUND URBAN 2359 1900 2003 1831 1725 1684
BACKGROUND URBAN 1597 2258 1386 1290 1227 1204
BACKGROUND URBAN 1299 1439 1128 1049 998 979
Stuttgart
Daily Exceedances
Type Area 2010 2015 2020 2025 2030 2035
BACKGROUND URBAN 20 23 24 23 23 23
SOMO35
Type Area 2010 2015 2020 2025 2030 2035
BACKGROUND URBAN 2516 2394 2052 1866 1727 1684
Warsaw
Daily Exceedances
Type Area 2010 2015 2020 2025 2030 2035
BACKGROUND URBAN 16 13 7 5 4 4
BACKGROUND URBAN 6 11 9 8 8 8
BACKGROUND URBAN 2 6 4 2 1 0
SOMO35
Type Area 2010 2015 2020 2025 2030 2035
BACKGROUND URBAN 1939 2007 1636 1519 1444 1422
BACKGROUND URBAN 1551 1721 1277 1170 1102 1082
BACKGROUND URBAN 1484 1347 1233 1137 1075 1057
33References
Aeris Europe, 2016. Urban Air Quality Study, #11/16, www.concawe.eu: Concawe.
Aeris Europe, 2021. Euro 7 Impact Assessment: The Outlook for Air Quality Compliance in the EU and the Role
of the Road Transport Sector, s.l.: ACEA.
Concawe, 2018. A comparison of real driving emissions from Euro 6 diesel passenger cars with zero emission
vehicles and their impact on urban air quality compliance, Brussels: Concawe.
Diaz, F. M. R. et al., 2020. Ozone Trends in the United Kingdom over the Last 30 Years. Atmosphere, Volume
11/534.
Directive (EU) 2008/50/EC, 2008. Directive 2008/50/EC Of The European Parliament And Of The Council on
ambient air quality and cleaner air for Europe, COD 2005/0183: European Parliament, Council of the European
Union.
Golomb , D. S. & Fay, J. A., 1989. The Role of Methane in Tropospheric Chemistry (MIT-EL-89-001), s.l.: Energy
Laboratory, Massachusetts Institute of Technology.
Lee, J. D. et al., 2020. UK surface NO2 levels dropped by 42% during the COVID-19 lockdown: impact on surface
O3.
WHO, 2005. WHO Air quality guidelines for particulate matter, ozone, nitrogen dioxide and sulfur dioxide,
Geneva: World Health Organisation.
34You can also read