Planning Scenarios for the Growth of Hervey Bay
←
→
Page content transcription
If your browser does not render page correctly, please read the page content below
Planning Scenarios for the Growth of Hervey Bay

                               Christopher Pettit and David Pullar

                          Department of Geographical Sciences and Planning
                                   The University of Queensland.
                                      St. Lucia. Australia. 4072
                              Phone: 07 3365 6068 Fax: 07 3365 3561
                            Email: christopher.pettit@mailbox.uq.edu.au
                                    D.Pullar@mailbox.uq.edu.au

Abstract. This paper develops a methodology for investigating the question of: how can demographic
(socio-economic) and land-use (physical and environmental) information models may be used to
efficiently plan for future urban growth? A case study approach is undertaken using what-if planning
scenarios for a rapidly growing coastal area in Australia called Hervey Bay. The town and surrounding
area require careful planning of future urban growth between competing land-uses. Three potential
urban growth scenarios are put forth to address this issue. The first scenario is a future trends scenario,
based upon existing regional and urban trends and is examined in some detail in this paper. The other
two scenarios are a ‘maximise employment’ scenario and ‘sustainable development’ scenario. Both of
these scenarios are still in the developmental phase, however the framework for developing and
evaluating each of the three scenarios, namely through use of a goals achievement matrix, is discussed
in the concluding sections of this paper.

Note. This paper is based on Doctoral work in progress being carried out through the Department of
Geographical Sciences and Planning at the University of Queensland, and is funded through the
Australian Research Council – SPIRT program.

Keywords. Geographic information systems, transition rules, accessibility, multiple criteria analysis,
linear programming, urban and regional planning, what-if scenarios, land-use modelling.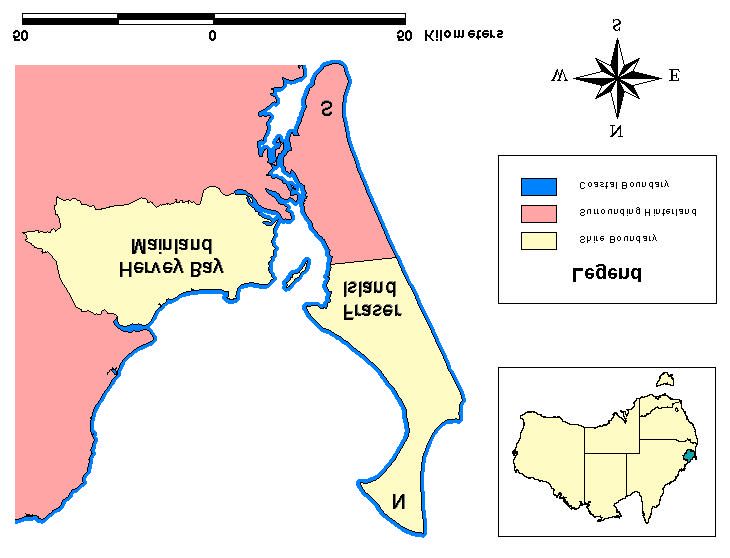
1. INTRODUCTION                                     particularly in the 1960s and 1970s. Some of
                                                    the core planning approaches discussed in the
The principal aim of this paper is to develop a     literature includes; the rational planning
methodology for investigating the research          approach (Yehezkel 1963; Willer 1967; and
question: how demographic (socio-economic)          Faludi 1973), the incrementalist approach
and land-use (physical and environmental)           (Lindblom 1965); the mixed scanning
model may be used to efficiently plan for           approach (Etzioni 1967), and the systems view
future urban growth? In order to validate the       approach (Chadwick 1966; and Chadwick
methodology a case study approach is used to        1978). The methodology developed in this
test a number of what-if planning scenarios.        paper is based upon the scenario planning
                                                    approach as advocated by (Stillwell et al.
The methodology is formulated in terms of a         1999).
number of land-use planning scenarios for the
future growth of Hervey Bay, a rapidly              Scenario planning focuses upon map
urbanising coastal town in Australia. A             representations    developed      through    the
framework to evaluate different planning            employment of analytical ‘what-if’ functions
techniques is described. This includes              and spatial modelling usually undertaken in a
predictions and tactical planning for land-use      GIS. It is closely connected to the view that
change based upon: i) projections from              planning should offer inspired visions of the
existing trends, ii) optimising socio-economic      future, based upon likely or preferred scenarios
output, and iii) decision trade-offs on a variety   which are either founded upon existing
of factors. This paper describes the first          planning policy or used to formulate planning
technique and evaluates impacts as a basis for      policy. As stated by Stillwell et al. (1999):
comparison on the other techniques, which will      scenario planning can be seen as a reaction
be discussed in a future paper. Despite only        against the more procedural and instrumental
covering the one technique, the paper does          orientations that characterised earlier planning
elaborate on the framework for making land-         approaches, as previously mentioned.
use change predictions and evaluating planning
scenarios using spatial analysis in a GIS. These    2.2 The Scenario planning methodology
spatial analysis methods include assessing land
requirements, development constraints, land-        The scenario planning approach applied to the
use transition rules, and urban expansion based     case study area of Hervey Bay is shown in
upon accessibility to services. The evaluation      Figure 1. The principal planning task is to
of planning scenarios uses a goals-achievement      bring about the efficient planning of future
matrix, which brings to light how a particular      urban growth in Hervey Bay. The core
planning scenario performed against local and       objectives and policies which assist in the
state planning policies and objectives.             formulation of different planning scenarios are
                                                    derived from the Wide Bay 2020 Regional
2. THE SCENARIO PLANNING                            Growth Management Framework – RGMF
APPROACH                                            (DCILGPS 1999), and the Hervey Bay Town
                                                    Planning Scheme (HBCC 1996). The
2.1 Selecting a suitable planning approach          objectives from each of these planning
                                                    documents are used later in the methodology to
In order to instigate efficient land-use planning   evaluate the efficiency of each proposed what-
                                                    if planning scenario.
a number of planning approaches have been
developed by various planning theorists,
Planning Task
Policy Objectives
Socio-Economic Data Physical and Environmental
Inputs Data Inputs
Planning Scenarios
‘Future Trends’ ‘Maximise employment’ ‘Sustainable Development’
Scenario Scenario Scenario
Planning technique: Planning technique: Planning Technique:
Model of disaggregation Linear programming Multiple Criteria Analysis
Evaluation of Scenarios
Planning Technique:
Goals-achievement matrix
Final Planning
Scenario
Figure 1: Scenario Planning Approach Methodology
A number of socio-economic, physical and available up until 2021 (DLGP 2001), existing
environmental data inputs are required to drive census data for 1986,1991,1996 (ABS 1997),
the land-use planning scenarios. Core socio- projected industry employment trends up until
economic data inputs include: population 2006 (DEWRSB 2000), and a national share
projections, industry employment projections, ratio (NSR) derived through a shift-share
projected average household size and the analysis using census data from 1986-1996
projected number of dwellings. This data has (Stimson and Davis 1999). These datasets have
been obtained from the Queensland been integrated through linear extrapolation,
Department of Local Government and standardisation and indexing techniques in
Planning and the Australian Bureau of order to produce projected industry
Statistics. It is noted that the industry employment figures (Pettit 2001).
employment projections have been derived
using; the cohort population projection figuresallows decision-makers to assign various
A number of core physical and environmental weightings of importance to different land-use
data inputs are used to formulate the scenarios. factors and examine the results. There are a
The physical data inputs including: cadastral number of planning support systems (PSS) that
land parcels, building footprints, road, sewer, enable planners and decision-makers to
water, and land-use zoning have been obtained formulate MCA based land-use scenarios
from the Hervey Bay City Council. The including: the spatial understanding and
environmental data inputs including: remnant decision support system (SUDSS) (Jankowski
vegetation, national parks, riparian vegetated and Richard 1994); the ‘What-if?’
areas, coastal wetland, areas of prime collaborative planning support system
agricultural land, and existing open space have (Klosterman 1999); the IDRISI decision
been acquired from the Queensland support module (Eastman et al. 1995) the MCE
Environmental Protection Agency, the Planning Arcview extension (Pettit 1999; Pettit
Queensland Department of Local Government and Pullar 1999); and the ModelBuilder
and Planning and the Hervey Bay City Arcview GIS extension (ESRI 2000). After
Council. reviewing each of these systems it is envisaged
that the formulation of the ‘sustainable
The next step of the methodology is to development’ scenario for Hervey Bay will be
formulate possible ‘what-if’ land-use implemented using the What-if? PSS in
scenarios. Three land-use planning scenarios collaboration with the Wide Bay202 project
are formulated for Hervey Bay. The first of team and the Hervey Bay City Council
these makes predictions of land-use change planning division.
based upon existing trends. This is essentially
a ‘do-nothing’ scenario that takes a business as The evaluation of each of the three land-use
usual approach based upon existing regional scenarios is undertaken using the core
and urban trends. The future trends scenario is objectives as outlined in the Wide Bay2020
developed using a model of disaggregation RGMF and the Hervey Bay Town Planning
involving two steps: i) disaggregating data on Scheme. These objectives are used in
socio-economic trends to predict future land- evaluating the efficiency of each proposed
use requirements, and ii) forecasting patterns land-use scenario. The process of evaluation is
of change using land-use transition rules and considered iterative in that the results found
accessibility indices. This scenario for Hervey through preliminary evaluation of the scenarios
Bay is examined in further detail in the can lead to the re-working of a scenario. The
ensuing sections of this paper. decision to use the goals-achievement matrix
(GAM) evaluation technique was done so after
The second scenario (to be described in a the review of a number of available techniques
future paper) focuses upon maximising including: cost benefit analysis (CBA);
employment opportunities within Hervey Bay. planning balance sheets (PBS); and goal-
The main objective of the scenario is to reduce achievement matrices (GAM). The goals-
unemployment through maximising the most achievement matrix was developed by Hill
labour-intensive organisation of existing and (1966) to overcome the lack of reference to
future land-uses. The scenario utilises linear community objectives by the planning balance
programming to maximise the objective, and sheet (Parkin 1993). It was also a reaction
minimise possible constraints which include, against the limitations of the CBA technique,
ecological, technical, and financial namely that with CBA all costs and benefits
considerations. It is envisaged that the are expressed explicitly in monetary terms, it
formulation of the ‘maximise employment’ fails to incorporate intangible items in the
scenario will be based upon the technique put actual calculations of a study area, and has the
forth by Chuvieco (1993) which integrates inability to handle equity considerations
linear programming and GIS for land-use (Lichfield et al. 1975).
modelling.
The end result of the scenario planning
The third scenario (to be described in a future approach is the formulation of a final plan, to
paper) focuses upon the development of a be implemented and reviewed accordingly.
‘sustainable development’ scenario. This
scenario takes into account areas of both
environmental and economic significance and
allows trade-offs to occur between these
sometimes conflicting areas. Multiple Criteria
Analysis (MCA) is a suitable technique whichlisting of Fraser Island and the promotion of
whale watching (Beer et al. 1994). In 1976
3. A FUTURE TRENDS PLANNING Hervey Bay was created as a separate shire,
SCENARIO FOR HERVEY BAY with the status of a town in 1977, and a city in
1984 (Beer et al. 1994). Today the economy of
Hervey Bay is dependant upon the tourism
3.1 Description of Hervey Bay industry and settlement driven by retirees.
Despite having strong population growth, the
The Shire of Hervey Bay is situated within the shire retains a dogmatically high
Wide Bay-Burnett region along the east coast unemployment rate close to 20% (Stimson and
of Australia in the State of Queensland and Davis 1999).
occupies an area of approximately 2,340
square kilometres – see Figure 2. Hervey Bay The planning issues for Hervey Bay are to
includes North Fraser Island (World Heritage support the growth of the area and to provide a
area) and it neighbouring islands, which balanced socio-economic climate. Future
account for nearly half of the shire’s total land development that protects the environmental
area (1,010 square kilometres). quality of the area is consistent with the
tourism industry and also desirable from a
Urban settlement in the Hervey Bay area began sustainable development perspective. The
in the 1870s when residents and framework developed to evaluate planning
businesspersons from Maryborough started to techniques and future growth scenarios are
buy land along the shores of Hervey Bay, sensitive to environmental issues and costs of
building holiday homes, hotels and guest urban expansion. The first of these is explored
houses (Beer et al. 1994). The area developed in this section. The next section evaluates this
an economy on agriculture (sugar cane) and scenario in terms of strategic goals of the
tourism. Hervey Bay’s attractions as a tourist region.
centre increased with the World Heritage
Figure 2: Shire of Hervey Bay Locality Diagram3.2 Model of Disaggregation Technique 3.3 Land-use Requirement Analysis
A regional analysis shows that Hervey Bay Projections for regional population and
will grow significantly over the next twenty employment growth are the main inputs to
years (Pettit 2001). The patterns of land-use determining future land-use requirements.
change and their impacts are of interest to These regional figures need to be
planners. We explore different planning disaggregated and related to land-uses. We
scenarios using a number of planning parameterise the demand for land in terms of
techniques. The first of these is to develop a population-employment and existing land
plausible scenario based upon predictions of usage, and then extrapolate this to future
future expansion from existing trends. demands. The formulation for projected land
Regional predictions of population and required for commercial and industrial
employment growth by industry sector provide purposes is shown in Figure 3. Regional data
the main drivers of change which we wish to used in this part of the model includes
relate to land-use change using a model of projected employment growth figures by
disaggregation. The model involves two steps: industry sector. Land parcel and building
footprint data provide important disaggregated
1. land-use requirements analysis to predict inputs in the formulation of the commercial
the future demand of land required for and industry land formulation. A GIS is used
particular land-uses, to calculate the average coverage ratio for each
2. land-use allocation model that uses of the industrial and commercial land-use
transition rules and spatial analysis to categories. Combined with the industry sector
predict the pattern of land-use change. growth figure components, the total additional
land required for industrial and commercial
Previous usage of this technique includes work land-use has thus been determined – See
carried by Peckol and Erickson (2000) in their Figure 5.
analysis of industrial land supply and demand
in the Central Puget Sound Region of The component of the model which deals with
Washington. An adaptation of some of the the number of additional dwelling units
underlying concepts and transition rules used required to accommodate the predicted
by Peckol and Erickson (2000) in establishing increase in population requires regional
the demand for commercial and industrial land datasets including; population projections,
has been incorporated in the future trends household projections, and average household
scenario. size. Disaggregated data required in calculating
additional residential land is based upon
average residential land parcel size. The
formulation for projected land required for the
different residential land-use categories
(medium density, low density, park, and rural)
are shown in Figure 4.
Land needed = (employment growth) × (building m2 per employee) ÷ (coverage ratio)
where employment growth = adjusted change in employment
m2 per employee = total m2 ÷ total employment
coverage ratio = building footprint ÷ parcel size
Figure 3: Projected requirements for commercial and industrial land
Land needed = average parcel size (m2 ) × number of new dwelling
where av. parcel size = area of existing residential land ÷ number of land parcels
no. of new dwellings = increase in dwellings × avg. dwelling occupancy rate
no. of dwelling units ≅ number of households
dwelling occupancy ≅ household size
Figure 4. Projected requirements for residential landExisting Land Additional Land Total Land Required (m2) Increase 2001-
Land-use (m2) 2001 (m2) 2021 2001-2021 2021
Business Commercial 3,499,764 604,171 4103935.476 17.3%
Light Industry 374,335 147,531 521865.6552 39.4%
General Industry 2,068,459 1,011,258 3079716.436 48.9%
Medium Density Residential 1,006,253 757,132 1763385.533 75.2%
Low Density Residential 14,251,528 12,112,731 26364258.24 85.0%
Park Residential 3,841,212 3,262,677 7103888.856 84.9%
Rural Residential 9,103,411 7,739,839 16843249.68 85.0%
Conservation 1,037,520,382 - - -
Vacant 25,335,598 - - -
Total 1,097,000,940 25,635,339 1,122,636,279 -
Figure 5. Land-use Requirements
The final land-use requirements established parameters: distance to the CBD, distance to
through projected land-use requirements are the harbour, and distance to major roads
shown in Figure 5. These results show that the (arterial and sub-arterial). The accessibility
additional land required for all residential land- index has been formulated within a GIS, using
use categories is expected to increase around programs to calculate distances from each
75-85%. Land required for business and developable land parcel to each of the three
commercial activities is expected to increase attractors using the equation expressed below:
by 17.3%, whilst the land required for both
Acij,ik , il = w j .∑ij Rij + wk .∑ik C ik + wl .∑il H il
light and general industry is expected to
increase between about 40-50%. The results
from the land-use requirement analysis, 1 1 1
(specifically the results contained in column 3 = w j .(∑ij ) + wk .( ∑ik ) + wl .( ∑il )
– additional land use requirements), are used as d ij d ik d il
data inputs into the next part of the model
which determines the most suitable allocation
for each land-use.
Where Ac = accessibility index; i = available
3.4 Land-use Allocation Model land parcel; j = major road; k = Central
Business District; l = Harbour; w = weighting;
R = accessibility to major road; C =
To decide the most suitable allocation of the
accessibility to CBD; H = accessibility to
projected land demand with respect to land
supply in Hervey Bay up until 2021, an Harbour; d = distance.
accessibility index and land transition rules
Another Avenue script has been written to
using a land-use/compatibility matrix have
been employed. Accessibility is a widely used allocate future land in Hervey Bay for each
land-use by specifying for each land-use the
spatial analytic measure defined as the relative
following input parameters: the total required
‘nearness’ of one locality to another and has
been extensively used in a wide range of land- land; the minimum land parcel size (HBCC
1996); a ranking of importance for each land-
use and transportation planning studies (Bell et
use, and a proximity restriction (i.e. outer limit
al. 2000; Jiang et al. 1999; and Guitierrez et al.
1998). for which a particular land-use could be
located from similar existing development).
A simplistic accessibility index has been
The associated parameters entered into the
formulated for the future trends scenario in
Hervey Bay to assist in deciding which land land-use model for the Hervey Bay future
trends scenario are specified below in Figure 6.
parcel to assign to a particular land-use.
Accessibility is measured using threeLand-use Ranking Required Land Minimum Proximity
(m2 ) Parcel Size (m2 ) Restriction (m)
Business / 1 604,171 300 500
Commercial
Light Industry 2 147,531 1800 500
General Industry 3 1,011,258 4000 500
Medium Residential 4 757,132 600 -
Low Residential 5 12,112,731 800 -
Park Residential 6 3,262,677 2000 -
Rural Residential 7 7,739,839 20,000 -
Figure 6: Land-use allocation parameters
The final parameter incorporated into the
allocation model was the land-use / zoning
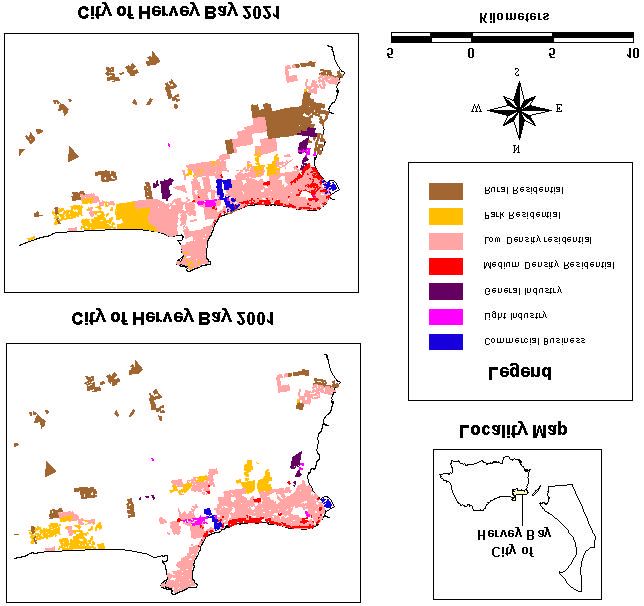
compatibility matrix – see Figure 7. The land 3.5 Scenario Results
use / zoning compatibility matrix allows us to
two perform two tasks. Firstly, as the future The principal result obtained from running the
trends scenario is based upon existing land-use model is a number of spatial land-use
trends and as these trends are subject to local allocation data layers. These spatial layers can
planning instruments, then the zoning plan is be viewed in a GIS and cross-examined with
used to assist in the allocation of future land. other spatial data layers; associated attributes
Secondly, we can use the existing zoning data can be analysed; and a final land-use allocation
layer to measure if sufficient land for each map can be generated depicting the future
land-use is available within the present zoning trends scenario, as shown in Figure 8.
scheme. Using the overlay functionality from a Preliminary analysis of urban growth scenario
GIS the spatial data layer defining the existing for Hervey Bay reveals that the existing
zoning strategy for Hervey Bay is overlayed strategic zoning boundaries are sufficient for
with the land parcel data layer, thus assigning a most land-uses. However, in the case of light
specific zoning attribute to each of the 24,000 industry a portion of the allocated land has
land parcels located within the Shire. The land- been drawn from land outside the existing
use allocation script then consults the matrix of zoning scheme using the land most suitability
compatible land-use when deciding upon as indicated by the accessibility index.
suitable land-use parcels to be allocated for
urban future development.
Land-use
Zoning Commercial Light Ind General Ind Med Res Low Res Park Res Rural Res
Aerodrome X X
Active Open Space
Environmental Open Space
Holiday Village X X X X
Industrial X X
Park Residential X X
Quarry X
Urban Residential X X X
Village X X X X
Waste Treatment Site
No Zoning X
Figure 7. Land-use / Zoning Compatibility MatrixFigure 8: Future Trend for Urban Growth – City of Hervey Bay 2021
4. EVALUATION OF THE FUTURE TRENDS PLANNING SCENARIO
The efficiency of the future trends scenario is environmental data layers within GIS. These
evaluated based upon a number of criteria, criteria are indicative of some of the core
which are derived from key policy objectives objectives outlined in the Wide Bay 2020
outlined in the Wide Bay 2020 RGMF and the RGMF and/or the Hervey Bay Town Planning
Hervey Bay Town Planning Scheme. Scheme. Infrastructure based criteria used to
Ultimately when all three scenarios have been evaluate the scenario include; land serviced by
developed, each will be assigned appropriate an existing road network; land within close
value weights for each of the objectives so that proximity of existing water mains; and land in
a comparative analysis can be undertaken close proximity to existing sewer mains. The
within a GAM as indicated in Figure 9. evaluation of each of these infrastructure
criteria has been undertaken using the
So far a number of criteria have been ‘intersect’ and ‘within distance of’ spatial query
formulated using spatial infrastructure and functionality available within GIS.Scenario 1 Scenario 2 Scenario 3
Source Objectives 'Future Trends' 'Maximise 'Sustainable
Employment’ Development'
1
2
Wide Bay
3
2020 RGMF
4
5
6
7
Hervey Bay 8
Town Plan
9
10
Figure 9: Goals-Achievement Matrix for Evaluation of Planning Scenarios
Similarly the evaluation of the environment infrastructure, where between 30-45% of
based criteria has been undertaken in GIS using proposed urban growth will not be sufficiently
the following available or created data layers: serviced by the respective infrastructure
prime agricultural land; significant remnant networks. Specifically, with respect to the water
vegetation; national parks; coastal wetlands; infrastructure criteria, proposed general
riparian vegetation; and existing open space. A industry, park residential and rural residential
number of spatial operations including land-uses do not measure well. When analysing
buffering and union have been utilised within the breakdown of land-use performance with
GIS to create the coastal wetlands and riparian respect to the sewer infrastructure criteria it can
vegetation data layers, as defined by the be seen that significant additional infrastructure
Queensland Environment Protection Agency will be needed to service projected general
(EPA 2000). The results for each of the criteria industry, low residential, and park residential
with respect to the land-use categories has been development. Another finding revealed through
calculated in Figure 10 as a percentage of land the GAM results shows that 50% of the
which is either not sufficiently serviced by projected medium residential development
existing infrastructure or which negatively conflicts with the existing open space system.
impacts upon land considered environmentally Through the evaluation of the scenario using
significant. the GAM a number of potential land-use
allocation conflicts are brought to light. These
Examination of the GAM results show that the problems can then be addressed through
efficiency of future trends for urban growth appropriate planning and decision-making
scenario are positive for most of the criteria. bodies through the formulation and
However, there is a significant disparity with implementation of suitable policies and plans.
respect to water infrastructure and sewer
Land-use
Criteria Commercial Light Ind General Ind Med Res Low Res Park Res Rural Res Average (%)
Road Infrastructure 2 16 0 0 4 0 1 3
Water Infrastructure 5 16 34 11 15 45 63 37
Sewer infrastructure 2 16 68 10 27 76 0 43
Prime Agriculture 0 0 0 0 0 0 10 1
Remnant Vegetation 0 0 0 0 2 0 11 2
National Park 0 0 0 0 0 0 0 0
Coastal Wetlands 3 0 0 12 8 4 3 4
Riparian Vegetation 5 1 1 1 2 1 0 2
Open Space 5 15 0 50 9 1 2 12
Figure 10: Goals-Achievement Matrix for Scenario5. CONCLUSIONS
Chuvieco, E. (1993) “Integration of linear
This paper has focused upon the development programming and GIs for land-use modelling.”
of a methodology for investigating how International Journal of Geographical
demographic (socio-economic) and land-use Information Science, Vol. 7, no. 11, pp. 71-83.
(physical and environmental) information
models be used to efficiently plan for future DCILGPS (1999) Wide Bay 2020 Regional
urban growth? So far a future trends scenario Growth Management Framework , Wide Bay
has been formulated for Hervey Bay, based 2020 Regional Planning Advisory Committee:
upon a model of disaggregation which used Brisbane.
transition rules, an accessibility index, and GIS
spatial processing functionality. Preliminary DEWRSB (2000) Job Outlook , Department of
evaluation of the scenario has been undertaken Employment, Workplace Relations and Small
using a GAM planning technique. Business: Canberra.
Further work to be undertaken will concentrate DLGP (2001) Demographic Profile for Hervey
on the calibration of the model of Bay City, Planning Information and
disaggregation technique, and the development Forecasting Unit Department of Local
of the ‘maximise employment’ and Government and Planning: Brisbane.
‘sustainable development’ scenarios. Once the
final two scenarios have been developed a Eastman, R. J.; Kyem P.A.; Toledano, J., and
comparative analysis will be undertaken to Jin, W. (1995) “Raster Procedures for Mutli-
investigate the strengths and weaknesses of all Criteria/Mutli-Objective Decisions,”
three scenario and the efficiency of the Photogrammetric Engineering & Remotes
planning techniques employed to formulate Sensing, vol. 61, no. 5, pp. 539-547.
each scenario.
EPA (2000) Draft State Coastal Management
Plan. Environmental Protection Agency,
ACKNOWLEDGEMENTS
Queensland Government: Brisbane.
Both the Queensland Department of Local ESRI (2000) Arcview ModelBuilder Extension.
Government Planning, and the Hervey Bay
Spatial Analyst Version 2.0, ESRI: Redlands,
City Council are acknowledged for their California.
invaluable assistance in supplying digital data
and hard copy reports used in formulating and
Etzioni, A. (1967) “Mixed Scanning: a Third
evaluation the future trends scenario. Approach to Decision-making,” Public
Administrative Review, Vol. 27, 385-392.
BIBLIOGRAPHY
Faludi, A. (1973) A Reader in Planning
ABS (1997) CData96. Australian Bureau of Theory, Pergamon Press: Sydney.
Statistics: Canberra.
Guitierrez, J., Monson, A., and Pinero, J.
Beer, A.; Bolam, A. and Maude, A. (1994) (1998). “Accessibility, network efficiency, and
Beyond the Capitals: Urban Growth in transport infrastructure planning.”
regional Australia. Commonwealth Environment and Planning A, Vol. 30, pp.
Department of Housing and Regional 1337-1350.
Development, Urban Future Research
Program: Canberra. HBCC (1996) Hervey Bay City Planning
Scheme - Planning Study, Hervey Bay City
Bell, M.; Dean, C. and Blake, M. (2000) Council: Hervey Bay.
“Forecasting the pattern of urban growth with
PUP: a wed-based model interfaced with GIS HBCC (1996) Hervey Bay Town Planning
and 3D animation,” Computers, Environment Scheme, Queensland State Government:
and Urban Systems, Vol. 24, pp. 559-581. Brisbane.
Chadwick, G. A. (1978) A Systems View of Hill, M. (1966) A Method for Evaluating
Planning. Pergamon Press: Sydney. Alternative Plans: The Goals-Achievement
Matrix Applied to Transportation Plans, Ph.D.
Chadwick, G. F. (1966) “A Systems View of Thesis, Graduate School of Arts and Science,
Planning,” Journal of the Town Planning University of Pennsylvania: Pennsylvania.
Institute, Vol. 52, No. 5, pp. 184-186.Jankowski, P. and Richard, L. (1994) Stillwell, J.; Geertman, S. and Openshaw, S.
“Integration of GIS-Based Suitability Analysis (1999) "Developments in Geographical
and Multicriteria Evaluation in a Spatial Information and Planning," Chapter in:
Decision Support System for Route Selection,” Geographical Information and Planning. J.
Environment and Planning B: Planning Stillwell, J. Geertman, S. and Openshaw, S.,
Design, vol. 21, pp. 323-340. Springer-Verlag: Berlin, pp. 3-23.
Jiang, B.; Claramunt, C. and Batty M. (1999) Stimson, R. J. and Davis, R. (1999) "Social
“Geometric accessibility and geographic and Economic Change in Queensland Local
information: extending desktop GIS to space Government Areas over the Decade 1986-
syntax.” Computers, Environment and Urban 1996," Western Regional Science Association,
Systems, Vol. 23, pp. 127-146. 38th Annual Meeting, Ojai California.
Klosterman, R. E. (1999) “The What if? Willer, D. F. (1967) Scientific Sociology,
Collaborative planning support system.” Prentice-Hall: Englewood Cliffs, New Jersey.
Environment and Planning B: Planning, vol.
26, pp. 393-408. Yehezkel, D. (1963) “The Planning Process: a
Facet of Design,” International Review of
Lichfield, N.; Kettle, P. and Whitbread, M. Administrative Sciences, Vol. 29, no. 1, pp. 46-
(1975) Evaluation in the Planning Process, 58.
Pergamon Press: Oxford.
Lindblom, C. E. (1965) The Intelligence of
Democracy, Free Press: New York.
Parkin, J. (1993) Judging Plans and Projects,
Avebury: Aldershot.
Peckol, L. and Erickson, M. (2000) "Central
Puget Sound Region, Washington: Study of
Industrial Land Supply and Demand," Chapter
in: Monitoring Land Supply with Geographic
Information Systems. Moudon, A.V. and M.
Hubner, M. (eds.), John Wiley & Sons, Inc.:
Brisbane.
Pettit, C. and Pullar, D. (1999) “An integrated
planning tool based upon multiple criteria
evaluation of spatial information.” Computers,
Environment and Urban Systems, Vol. 23, pp.
339-357.
Pettit, C. (1999) Multiple Criteria Evaluation
in Planning. Master in Regional and Town
Planning Thesis, Department of Geographical
Sciences and Planning, University of
Queensland: Brisbane.
Pettit, C. (2001). "The formulation and
application of a land-use allocation model,"
The Australasian Urban and Regional
Information Systems Association: 29th Annual
Conference, 19-23rd November 2001:
Melbourne.You can also read