Why Has the Stock Market Risen So Much Since the US Presidential Election?
←
→
Page content transcription
If your browser does not render page correctly, please read the page content below
K.7

Why Has the Stock Market Risen So Much Since the
US Presidential Election?
Blanchard, Olivier, Christopher G. Collins, Mohammad R. Jahan-Parvar, Thomas
Pellet, and Beth Anne Wilson

                                        Please cite paper as:
                                        Blanchard, Olivier, Christopher G. Collins, Mohammad R.
                                        Jahan-Parvar, Thomas Pellet, and Beth Anne Wilson. (2018).
                                        Why Has the Stock Market Risen So Much Since the US
                                        Presidential Election? International Finance Discussion Papers
                                        1235.

                                        https://doi.org/10.17016/IFDP.2018.1235

International Finance Discussion Papers
Board of Governors of the Federal Reserve System

Number 1235
August 2018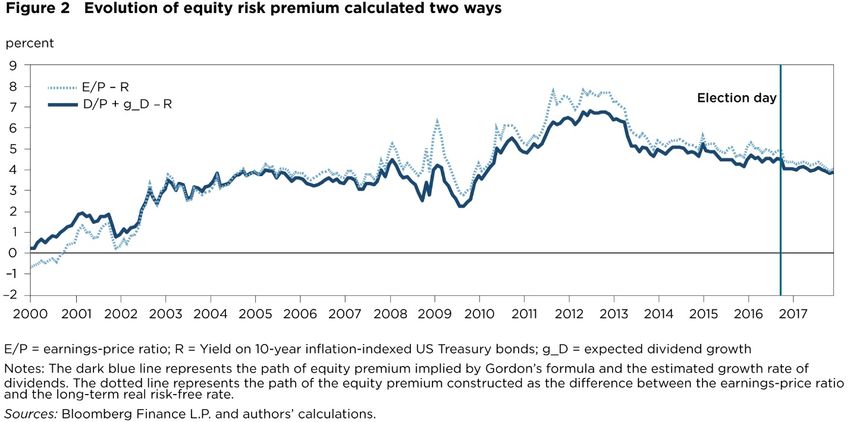
Board of Governors of the Federal Reserve System

                           International Finance Discussion Papers

                                        Number 1235

                                         August 2018

     Why Has the Stock Market Risen So Much Since the US Presidential
                               Election?
  Olivier Blanchard, Christopher G. Collins, Mohammad R. Jahan-Parvar, Thomas Pellet, and
                                     Beth Anne Wilson

NOTE: International Finance Discussion Papers are preliminary materials circulated to stimulate
discussion and critical comment. References to International Finance Discussion Papers (other
than an acknowledgment that the writer has had access to unpublished material) should be
cleared with the author or authors. Recent IFDPs are available on the Web at
www.federalreserve.gov/pubs/ifdp/. This paper can be downloaded without charge from the
Social Science Research Network electronic library at www.ssrn.com.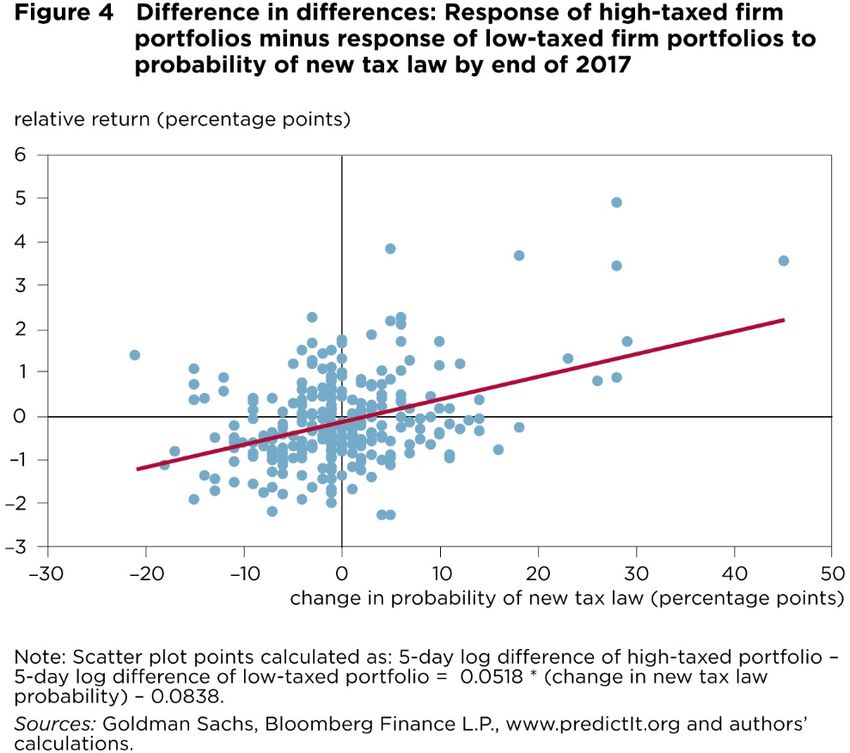
Why Has the Stock Market Risen So Much Since the U.S.
                       Presidential Election?
    Olivier Blanchard, Christopher G. Collins, Mohammad R. Jahan-Parvar, Thomas Pellet, and
                                       Beth Anne Wilson1
                                           August 2018

ABSTRACT
This paper looks at the evolution of U.S. stock prices from the time of the Presidential elections to the end of 2017.
It concludes that a bit more than half of the increase in the aggregate U.S. stock prices from the presidential election
to the end of 2017 can be attributed to higher actual and expected dividends. A general improvement in economic
activity and a decrease in economic policy uncertainty around the world were the main factors behind the stock
market increase. The prospect and the eventual passage of the corporate tax bill nevertheless played a role. And while
part of the rise in stock returns came from a decrease in the equity risk premium, this decrease was relatively limited
and returned the premium to the levels of the first half of the 2000s.

Keywords: dividends, earnings, equity returns, equity premium, Gordon formula, tax reform, U.S. presidential election.
JEL Classifications: G12, G18.

1
 Olivier Blanchard, the C. Fred Bergsten Senior Fellow at the Peterson Institute for International Economics and the Robert M. Solow
Professor of Economics emeritus at MIT, Christopher G. Collins, International Finance Division, Federal Reserve Board of Governors,
Mohammad R. Jahan-Parvar, International Finance Division, Federal Reserve Board of Governors, Thomas Pellet, the Peterson Institute,
Beth Anne Wilson, International Finance Division, Federal Reserve Board of Governors. The authors thank Willem Buiter, William
Cline, Egor Gornostay, Gary Hufbauer, Juan M. Londono, Daniel Michalow, Manmohan Kumar, Ben Snider, and Alexandra Tabova
for help and comments. This paper was originally prepared for the January 2018 meetings of the American Economic Association. The
views expressed herein are personal views of the authors and do not reflect those of the Board of Governors, the Federal Reserve System,
or its staff.

                                                                   0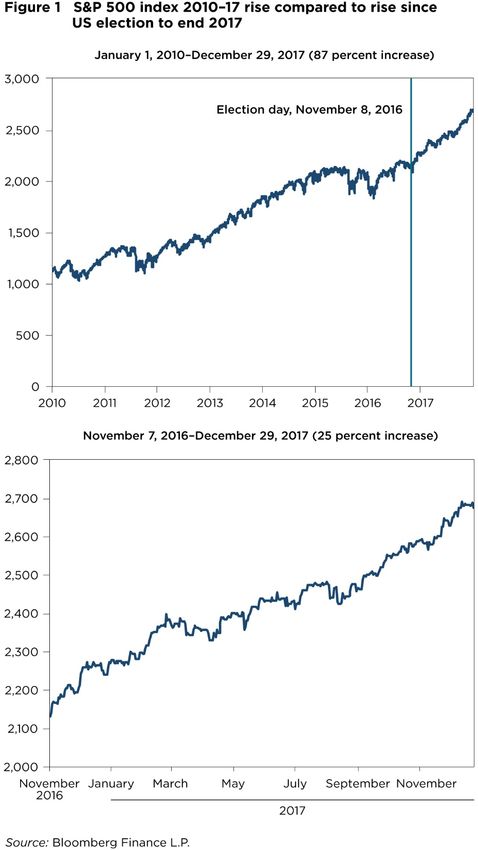
1. INTRODUCTION

Immediately following the U.S. presidential election in November 2016, many economists were concerned that
increased uncertainty over economic policy would lead to a decline in the U.S. stock market. From the time of the
election to the end of 2017, however, the stock market, as measured by the Standard and Poor’s (S&P) 500 index,
increased by about 25%. Price swings since then have led investors and economists to increasingly ask: was the stock
market rise justified by an increase in actual and expected future dividends, or did it reflect unhealthy price
developments, which may reverse in the future?

This article examines the movement of stock market prices from the time of the election to the end of 2017. It
concludes that a bit more than one half of the run-up in the S&P 500 can be explained by an increase in actual and
expected dividends. The effects of the perceived probability that a corporate tax cut bill would pass Congress account
for 2–6% points of this increase. The rest can be attributed to a decrease of less than 100 basis points in the equity
premium, a decrease that leaves it roughly equal to where it was in the mid-2000s. Lower uncertainty in the rest of
the world, in particular in Europe, more than offset the higher policy uncertainty in the United States following the
2016 presidential election and can plausibly justify this decrease in the equity premium.

Our examination of the data is based on Gordon’s formula (Gordon, 1959, Gordon and Shapiro, 1956), a method
of valuing stocks. As a matter of identity, one can think of a stock price as the expected value of future dividends
discounted by the real return investors would get for holding a safe asset plus an equity premium. Gordon’s formula
restates this relation as follows: the difference between the dividend-price ratio and the safe rate is equal to the equity
premium minus the expected growth rate of future dividends. In simpler terms, the fact that the dividend-price ratio
decreased from the time of the election to the end of 2017 while the safe real rate rose implies that either the
expected growth of dividends increased, and/or that the equity premium declined.

We start therefore by constructing series for the expected growth rate of dividends, first leaving aside the potential
effects of the 2017 tax overhaul package. Actual dividends increased substantially during the period, as did earnings.
Given the historical relation between earnings, dividends, and the future growth rate of dividends, we find that,
leaving the effects of the tax package aside, the forecast of future dividend growth did not change much during the
period examined.

The question is, then, how much the anticipation and the eventual passage of the tax package boosted expectations
for future dividends and thus supported stock prices. We use two approaches to measure the effects of the corporate
income tax package. The first is an arithmetic exercise, partly based on the estimates of the change in tax revenues

                                                             1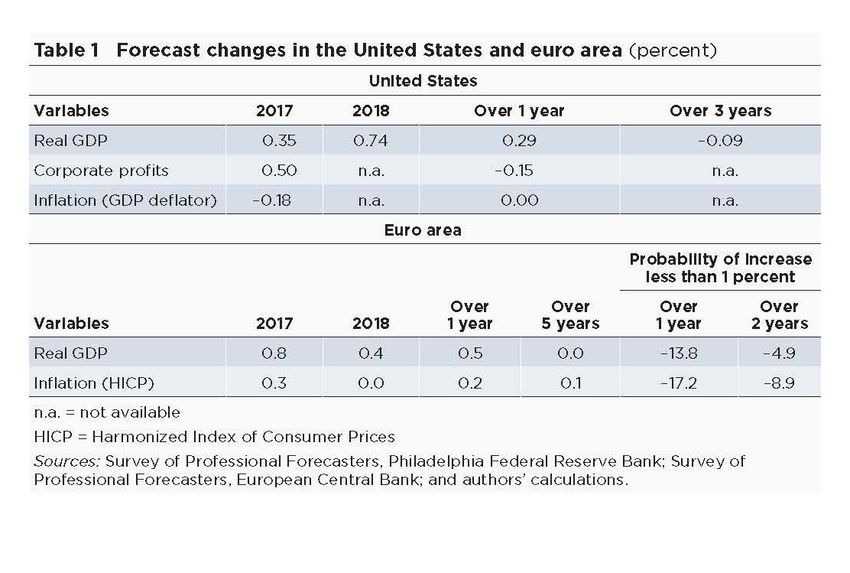
from the package made by the congressional Joint Committee on Taxation, adapted to take into account the
characteristics of the S&P 500 firms; this approach estimates the effects of the corporate tax package on stock prices
at around 4%. The second approach is an econometric exercise, relying on the relation between changes in stock
prices and changes in the probability of passage of the corporate tax package, measured by the odds on the betting
site PredictIt.org, during the period. Controlling for non-tax factors, we find a strong relation between the two.
Given that the tax package has now become law, the econometric estimates suggest its contribution to the increase in
prices since the election ranges from 2 to 6%.

This implies that the actual increase in dividends (9%), plus the anticipation of higher dividends due to the tax
package (2–6%) can explain 11–15% points of the 25% increase in stock prices from the time of the election to the
end of 2017. The rest must be explained by a lower equity premium.

The question then becomes how to reconcile this lower premium with the perceived increase in economic policy
uncertainty. We explore the issue by looking at the relation between our measure of the equity premium and
measures of economic policy uncertainty for the United States and Europe constructed by Baker, Bloom, and Davis
(2016). We find a strong historical relation between the equity premium and both measures of uncertainty—a
finding which may not be surprising, given that foreign sales account for almost half of the revenue of S&P 500
firms. While policy uncertainty increased somewhat in the United States, its effect was more than offset by a decline
in uncertainty in Europe. This finding is only suggestive, as many other factors are surely at work, but it offers a
plausible explanation for why the equity premium has slightly decreased since the U.S. election.

To conclude, a bit more than half of the increase in the aggregate U.S. stock prices from the presidential election to
the end of 2017 can be attributed to higher actual and expected dividends. A general improvement in economic
activity and a decrease in economic policy uncertainty around the world were the main factors behind the stock
market increase. The prospect and the eventual passage of the corporate tax bill nevertheless played a role. And while
part of the rise in stock returns came from a decrease in the equity risk premium, this decrease was relatively limited
and returned the premium to the levels of the first half of the 2000s.

Given the methodology used in this analysis, if a stock market bubble were present, it would manifest itself as a
decrease in the constructed equity risk premium: Investors would be willing to pay more for equities than their
fundamental value. The decrease in the equity premium has been relatively small, however, and as of the end of
2017 the level of the premium did not appear unusually low by historical standards. In other words, if the U.S. stock

                                                           2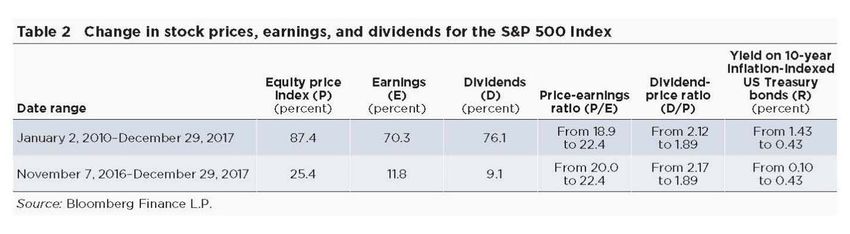
market had a bubble component, this component was not large after the U.S. presidential election through the end
of 2017.

2. THE STOCK MARKET RISE AND ECONOMIC FORECAST CHANGES

The stock market increase from the election to the end of 2017 was clearly a continuation of the steady increase seen
since 2010 (Fig. 1). From the time of the election to the end of 2017, however, stocks rose at a pace of about 22%
per year, double the 11% average annual pace over the 2010–2016 period.

How much of this increase was due to higher current and expected dividends, and how much was due to a decrease
in the required rate of return? Starting with dividends, there is little question that there was good news on economic
activity, and, by implication, presumably good news for current and future earnings and dividends. The economies
of the United States and the rest of the world, Europe especially, performed substantially better than was forecast
immediately before the U.S. election. And, given that nearly half of the sales of S&P 500 firms are foreign sales
(Silverblatt, 2017), improved economic conditions abroad matter for U.S. markets.

As background for a more formal exercise to come later, Table 1 shows the change in forecasts from the U.S. and
ECB Surveys of Professional Forecasters from the fourth quarter of 2016 (finalized before the U.S. election) to the
fourth quarter of 2017.

For the United States, the revisions to the forecasts for 2017 and 2018 (the first two columns) were substantial: up
for real GDP and corporate profits, down for inflation. The longer-run forecasts over 1 and 3 years barely changed
however, suggesting forecasters viewed much of the recent economic strengthening as a cyclical improvement rather
than reflecting higher potential growth.2

For the euro area, the first two columns again give the changes in the forecasts for 2017 and 2018. As for the United
States, the revisions for GDP for both years are substantial (forecasts for corporate profits are not available). The next
two columns show the changes in 1-year and 5-year ahead forecasts.3 The 5-year forecasts for GDP are unchanged,
again indicating that professional forecasters viewed the more positive incoming data as reflecting a faster cyclical
adjustment rather than stronger potential growth. The last two columns show the large decrease in perceived

2
 The forecast revision in the final column is the difference between the forecast made in 2017 Q4 of the change in the level of real GDP
between 2017 and 2020, normalized by real GDP in 2017, and the forecast, as of 2016 Q3, of the change in the level of real GDP
between 2016 and 2019, normalized by GDP in 2016.
3
 Because of differences in the questions asked in the U.S. and euro area surveys, the change in the 5-year forecast is the change in the
forecast growth rate in year 5, rather than the change in the forecast growth rate over the 5 years.

                                                                     3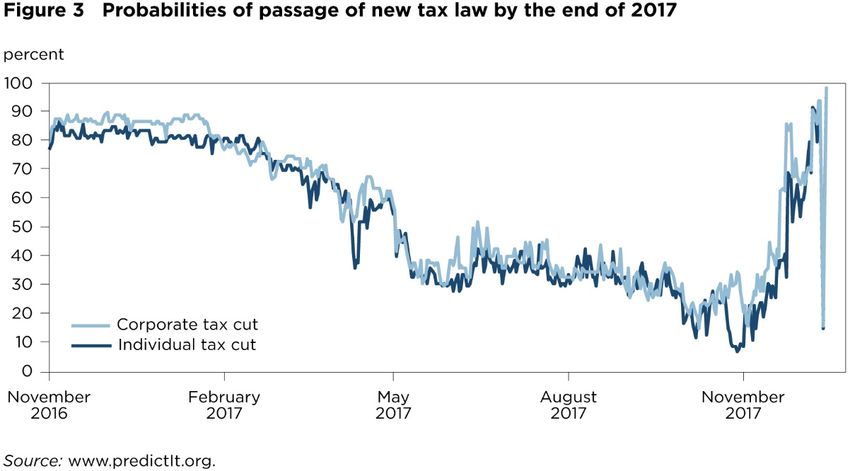
downside risks: For 1-year ahead forecasts, the proportion of those forecasting growth below 1% decreased by 14%
points, and the proportion of those forecasting inflation below 1% decreased by 17% points.4

Another way of making the point that the world recovery was stronger than expected at the time of the U.S.
presidential election is to look at the evolution of stock markets around the world. The MSCI world index
excluding the U.S. stock market increased by 21.4% from the time of the U.S. election to the end of 2017, thus
nearly as much as the S&P 500 index.

These facts make it clear that good news on domestic and international activity was an important factor in the
recent rise of U.S. stock prices. How much of the run-up does this good news explain? How much of the rise can
be attributed to the corporate tax package? What does this imply for the equity premium? The rest of this paper
examines the evidence more formally. Section 3 introduces the framework for interpreting the changes in prices,
dividends, and earnings using Gordon’s formula. Section 4 takes a first pass at computing expected dividends and
the equity premium. Section 5 explores the role of anticipated changes in the tax law. Section 6 focuses on the
evolution of the equity risk premium and its potential determinants, and Section 7 provides conclusions.

3. PRICES, DIVIDENDS, EARNINGS, AND GORDON’S FORMULA

Table 2 shows the percent increase in stock prices, earnings, and dividends for the S&P 500 index; the implied
movements in the price-earnings and dividend-price ratios; and the percent change in the yield on 10-year
inflation-indexed bonds, a measure of the long-term real interest rate, for the date ranges January 2, 2010–
December 29, 2017 (the last day of trading for 2017) and November 7, 2016–December 29, 2017.

From the time of the election to the end of 2017, equity prices rose 25.4%, earnings increased by 11.8%, and
dividends were up 9.1%.5 Thus, from an arithmetic viewpoint, prices increased by about 15% more than can be
accounted for by the increase in actual earnings or dividends. At the same time, the long-term real safe rate

4
 Similar quarterly surveys from professional forecasters are typically not available for the rest of the world. Other sources, however, such
as the International Monetary Fund’s World Economic Outlook (IMF, 2016, 2018), also show positive forecast revisions across
developed and emerging economies.
5
    Net share buybacks were similar in magnitude to dividend payments and increased by 8.1%.

                                                                     4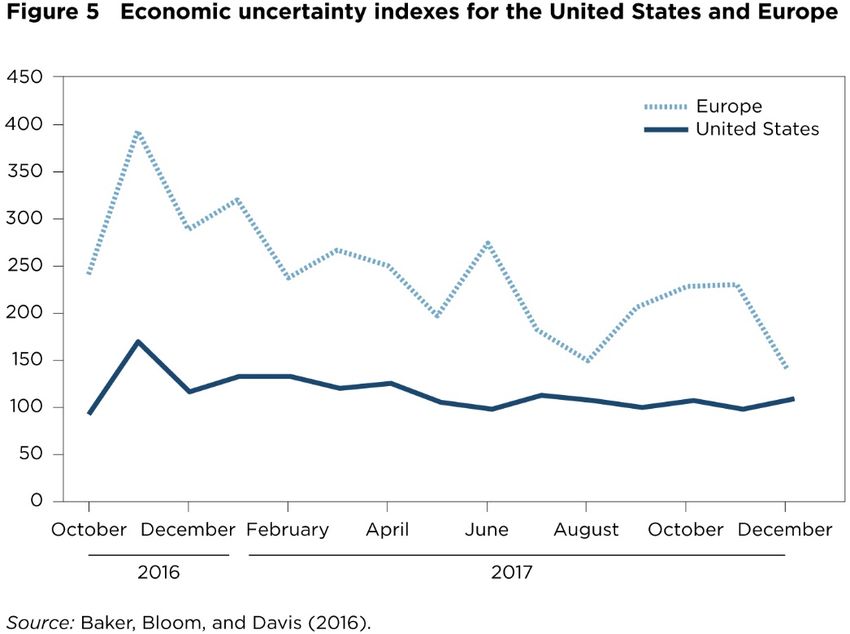
increased from a very low 0.1% at the time of the elections to 0.4% by end 2017. All other things being equal,
such an increase in the safe rate should have led to lower stock prices.

To interpret these evolutions, it is useful to start with Gordon’s formula. Start from the assumption that stock
prices are equal to the present value of expected future dividends, discounted by a rate equal to the safe rate plus an
equity premium. Then the following relation follows:

    (1)                                                          ,

where     is the dividend-price ratio, “expected dividend growth” is a weighted average of future dividend growth

(with the discount rate equal to the safe rate plus the equity premium), R is a weighted average of future real safe
rates, and X is the equity premium. The relation states that the expected rate of return on stocks, on the left-hand
side, is equal to the safe rate plus the equity premium, on the right-hand side.

Rewrite the relation as:

  (2)

This implies that a decrease in the dividend-price ratio together with an increase in the safe rate, the combination
observed since the election, must reflect either higher expected dividend growth or a lower equity premium. The
next step is thus to estimate expected dividend growth, and, by implication, obtain the equity premium.

4. EXPECTED DIVIDENDS AND THE EQUITY PREMIUM

Obtaining reliable forecasts of dividend growth rates is difficult, a fact well documented in studies such as
Campbell and Shiller, 1988a, Campbell and Shiller, 1988b and Cochrane (2008), among others. Several
econometric specifications for constructing expected dividend growth yielded roughly similar conclusions, namely
that the change in expected dividend growth from the time of the elections to the end of 2017, ignoring the impact
of the expected tax law change, was small.

We report the result of estimating one such specification, motivated by the findings of Møller and Sander (2017),
based on the strong predictive properties of earnings yields and dividend yields—taken jointly—for dividend
growth rates:

 (3)       ,               1.8   4.4 ln    /        3.9 ln     /     .

                                                           5
The equation is estimated using monthly data. The dependent variable, gD,t+120, is the realized growth rate of
dividends over 10 years (120 months) starting at t. The right-hand side variables, / and / , are
the logs of the earnings-price ratio and of the dividend-price ratio at time t, respectively. Newey–West corrected
standard errors for the estimated intercept and slope parameters of / and / are 0.6, 0.5, and
0.4, respectively. is equal to 0.53. The estimation sample runs from January 1980 to December 2007 (the last
month for which 10 years of realized growth of dividends are available).
Note that, to a rough approximation (which would be an exact relation if the two coefficients on / and
/ were equal), the realized growth rate of dividends is proportional to the ratio of earnings to dividends.
Using the values of E/P and D/P in December 2017 and November 2016, this regression yields an estimate of
expected dividend growth of 2.42% at the end of 2017 versus 2.39% as of November 2016, thus a very small
increase. Using Gordon’s formula, taking this number at face value (i.e., ignoring for the moment the implications
of the corporate tax package on post-tax earnings and thus on dividends) implies a decrease in the equity premium
of about 0.6% point. This value is obtained by adding the change in implied expected dividend growth (0.03%) to
the change in the dividend-price ratio (1.89%–2.17% = −0.28%, from Table 2) minus the change in the risk-free
rate, proxied by the yield on the real 10-year U.S. Treasury bond (0.43%–0.10% = 0.33%, Table 2) between
November 2016 and December 2017.
Another rough but popular way of estimating the equity premium is simply to compute the difference between the
earnings-price ratio and the long-term safe real rate. Using the numbers in Table 2 implies a decrease in the equity
premium of about 0.9% (the decrease in the inverse of the price-earnings ratio, 5.0%–4.46% = 0.53%, plus the
increase in the safe rate, 0.33%) since the election.
To put this decline in historical context, Fig. 2 shows the evolution of the two equity premia since 2000. Both
measures suggest that the equity premium increased substantially during the global financial crisis that started in
2007, and has steadily declined since 2012. In that light, the decline since the election has been relatively small,
and brings the premium roughly to where it was in the first half of the 2000s.
This econometric approach, which is based on past evidence, does not, however, take into account the potential
effects of the corporate tax package on future post-tax earnings and thus on future dividends. As a result, it likely
6understates future dividends, and, by implication, overstates the decline in the equity premium. Thus, we now turn
to the potential effects of the corporate tax package.
5. EFFECTS OF THE CORPORATE TAX CHANGES
The tax legislation that Congress passed on December 20, 2017, could affect stock prices in two ways.
The first is the expansionary effect that lower taxes in general have on private spending at a given interest rate.
Whether this effect leads to higher or lower stock prices depends, in part, on the reaction of the Federal Reserve. If
the Fed assesses that the economy is already at potential and increases the policy interest rate to offset the shift in
spending, the effect on the stock market may be negative.
The second effect, reflecting the corporate tax rate cuts, is to increase post-tax earnings given pre-tax earnings.
With respect to stock prices, this second effect is likely to dominate.6
To get a sense of the magnitude, it is useful to start with a back-of-the-envelope computation. Under the new tax
law, the statutory federal corporate tax rate falls from 35 to 21%, or a 40% decrease. There are, however, two
reasons to conclude that the decline in the actual rate will be substantially smaller.
First, because of a number of deductions and loopholes, the ratio of corporate tax revenues to profits under the
existing system is lower than the statutory tax rate. Given a federal statutory tax rate of 35% and an average state
statutory tax rate of about 4%, the overall statutory tax rate prior to the new tax law was about 39%. The actual tax
rate paid by the S&P 500 firms over 2014–2016 (constructed as the ratio of the sum of income taxes owed by S&P
500 firms over the sum of their pre-tax income minus special items) was a substantially lower 25%.
Second, the actual decrease in tax rates will be substantially smaller than the decrease in the statutory rate because
this decrease is partly offset by other changes to the law, including limits on net interest deductions and the repeal
of other deductions. Based on the numbers from the Joint Committee on Taxation (2017), federal corporate tax
6
Two contemporaneous and related papers, Wagner, Zeckhauser, and Ziegler (2018a, 2018b), also study the behavior of the U.S.
equities following the 2016 presidential election. Their primary focus is on the differential effects of the corporate tax package on
different firms. Their conclusions are largely similar to those in this article, in particular on the effects on high-taxed versus low-taxed
firms discussed below.
7revenues are slated to fall by 16% over the next 10 years, a far cry from the 40% implied by the change in federal
statutory rates.7
Together, these two numbers suggest that the new tax law will generate an increase in after-tax earnings given pre-
tax earnings of about 4% of pre-tax earnings; thus, the overall effective corporate tax rate on S&P 500 firms should
decrease from about 25% to about 21%.
Were pre-tax earnings to remain unaffected, the implication would be that the corporate tax package would
account for a 4% increase in stock prices. However, pre-tax earnings will be affected. As higher profitability and a
higher Tobin’s Q ratio lead to more investment, after-tax earnings per share will decrease. For a given interest rate,
earnings should eventually revert to levels seen before the tax law changes. If this reversion were to happen rapidly,
and investors were forward looking, it would imply a smaller initial increase in stock prices than the decrease in the
tax rate. That said, other changes such as deregulation may imply a larger increase in pre-tax earnings, even given
aggregate activity, and thus lead to a higher percent increase in stock prices. Such changes as deregulation are,
however, difficult to quantify and assess.
Turning to econometrics, we looked at stock price responses to changes in the probabilities of individual and
corporate tax bill passage by the end of 2017, using information from PredictIt.org, a betting website that reports
daily implied probabilities of various events including various dimensions of the tax reform during 2017.
The probabilities of passage of the individual and corporate sections of the tax package, as proxied by betting odds,
are plotted in Fig. 3. Both probabilities started very high after the election, steadily declined until November 2017,
and then rose sharply until the bill passed in December 2017. Because the bet was conditional on the president
signing a new tax bill into law by the end of 2017, there is a large one-day drop on December 20, when it appeared
that, despite the bill having passed Congress, the president might not sign it until 2018.8 For this reason, the
7
This number is for all corporations; S&P 500 firms may differ somewhat.
8
A new predictit.org market opened in October 2017 for betting on passage by 2018, and the probability associated with that market
did not fall on December 20, 2017.
8regressions in Table 3 below stop on December 19. The market closed on December 22 when the bill was signed,
and the results are roughly invariant to the inclusion of the final three days.
It is clear that the evolution of probabilities of passage of new tax legislation, first down and then up, does not
match the steady increase in stock prices shown in Fig. 1. Other factors were obviously at work, namely good
economic news in general. This leads us to estimate the following specification:
(4) Δ Δ .
is the change in price index i during week t. We examine the behavior of four different indexes: the S&P 500,
the Russell 2000, and high tax and low tax portfolio indexes constructed by Goldman Sachs.
The variables and are the changes in the probabilities (more accurately, the
betting odds) of passage of corporate and individual income tax bills by the end of 2017, respectively. To capture
the effect of economic news unrelated to the tax package, the change in equity markets outside the United States,
measured by the MSCI world stock market index excluding the United States ( ), is included.
We use weekly changes in the variables and estimate the relation from the creation of the relevant markets on
November 9, 2016–December 19, 2017. The results are reported in Table 3.
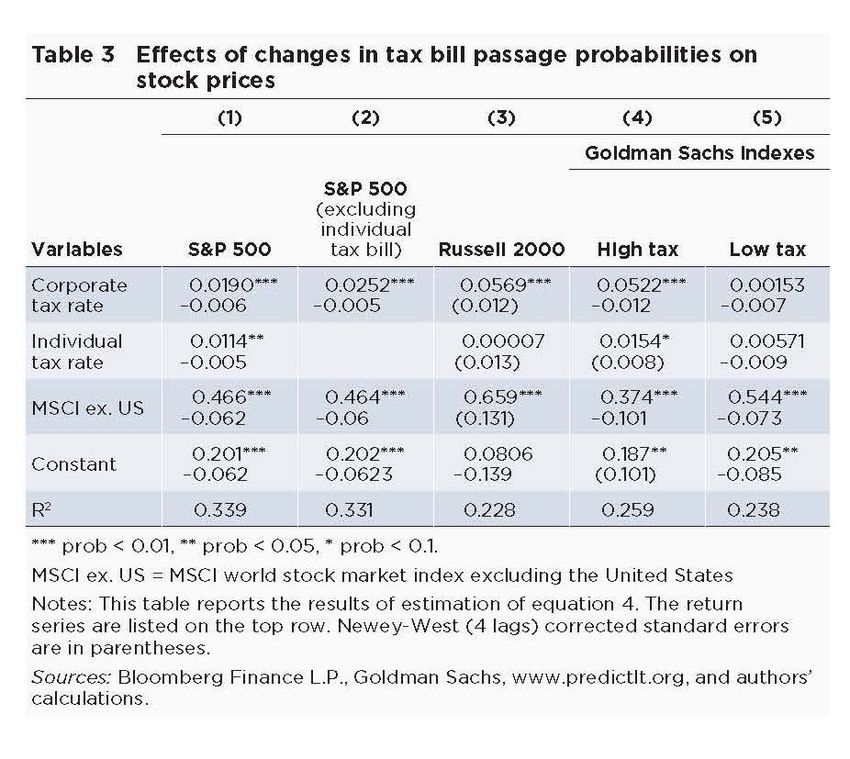
Column 1 shows the effects of changes in the probability of passage of individual and corporate sections of a tax
bill, controlling for movements in the world stock market index; results for the corporate and individual tax rates
are significant at the 1% level and 5% level, respectively.
Column 2 shows the effects of dropping the individual tax rate variable and shows the effect of the corporate tax
rate on stock prices to be slightly stronger.
Column 3 looks at stock price indexes for the Russell 2000, which includes the 2000 smallest firms out of the 3000
firms in the Russell 3000, and thus includes much smaller firms than the S&P 500. Smaller firms paid a higher
effective tax rate than larger firms under the tax laws prior to the new legislation; for example, over 2014–2016, the
firms in the Russell 2000 index had an effective tax rate of 29%, compared to 25% for the firms in the S&P 500. It
has thus been argued that they had more to gain from the new tax bill.9 The coefficient on this index of smaller
9
CNBC, “These stocks will benefit the most from tax reform: Goldman Sachs,” September 28, 2017,
https://www.cnbc.com/2017/09/28/small-cap-stocks-will-benefit-the-most-from-tax-reform-goldman-sachs.html (accessed on February
9, 2018).
9firms is substantially larger than that on the S&P 500, suggesting the anticipation of tax law changes did indeed
have a stronger effect on the stock prices of smaller firms.
Along related lines, it has also been argued that the new tax law will likely benefit high-taxed firms more than low-
taxed firms, which have been better at fiscal optimization and thus have less room to decrease their taxes. With this
in mind, the last two columns report the effects of changes in probability on the stock prices of low- and high-
taxed firms, using the two indexes constructed by Goldman Sachs. The results indeed also support this hypothesis,
with probability changes having a large effect on high-taxed firms and an insignificant one on low-taxed firms.
Another way of looking at the evidence underlying the results in the last two columns is to plot the difference
between changes in stock prices of high- and low-taxed firms in response to a change in the probability of passage
of a corporate tax bill (a difference in difference approach). The results, given in Fig. 4, show that as the probability
of passage rises, the stocks of high-taxed firms outperform those of low-taxed firms. The difference is large and
significant.
Altogether, the evidence suggests that the increasing probability and eventual passage of the corporate tax rate cut
had a clear effect on stock prices. Depending on which of the first four columns one uses, an increase in the
probability from zero to one implies an increase in stock prices of 1.9%–5.7%—encompassing the earlier estimate
of 4%. Putting things together, with the corporate tax package now taken into account, the increase in dividends
since the election (9.1%), the nearly zero change in expected dividend growth based on past evidence derived above
(0.03%), and the increase in stock prices attributable to anticipated corporate tax rate changes (say 4%), account
for about 13% of the increase in stock prices, so a bit more than half of the actual increase of about 25%.
This in turn implies that the rest of the increase must be explained by a decrease in the equity risk premium. Going
back to Gordon’s formula, an assumption that the tax package will shift the path of future dividends up by 4%
increases the estimate of the expected growth of dividends gD by (R + X) times 4%, so about 0.2%. This in turn
implies a decrease in the equity premium of 0.4% (compared to the estimate of 0.6% derived earlier when the tax
package was ignored). Thus, the next section explores what may explain this decrease.
6. EQUITY RISK PREMIUM
Constructing the equity risk premium is a delicate exercise. Identifying the factors driving its evolution is even
more difficult. Nevertheless, one can look either for factors that plausibly affect market risk aversion or for factors
that affect risk itself. Given the current context, and given the proportion of sales of the S&P 500 firms outside the
10United States, we look at the potential effects of economic policy uncertainty, both in the United States and in
Europe, on the equity premium over the last 20 years.
The baseline uncertainty index constructed by Baker et al. (2016) is used for the United States, and the news-based
index from the same source is used for Europe.10 The two series are plotted in Fig. 5, starting in October 2016 and
ending in December 2017.
The figure may look surprising, but one should not read anything into the large absolute differences between the
two series, as the data are normalized in different ways. Economic policy uncertainty, as measured by the index,
increased sharply in the United States following the election but has declined since then, and at the end of
December it was only a touch above its level just before the election. In contrast, the index for Europe, which also
increased sharply at the time of the U.S. election, has since declined steadily and is now much lower than before
the U.S. election.
To the extent that economic policy uncertainty outside of the United States matters for S&P 500 firms, this
decrease may partially explain the decrease in the equity premium. To test this hypothesis, we regressed the equity
premium as computed earlier (X = D/P + gD − R) (i.e., without further adjustment for the potential effects of the
tax package) on these two uncertainty indexes, using monthly data from January 1997 (the earliest date for which
the 10-year inflation indexed risk-free rate is available) to December 2017. The results are:
(5) 0.46 0.013 0.011
where Xt is the equity premium, is the U.S. economic policy uncertainty index, and is the
European equivalent. The fit is surprisingly good, with an R2 of 0.35, and the estimated parameters for both
uncertainty indexes are significant: Newey–West corrected standard errors are 0.66, 0.005, and 0.003, respectively.
Taking the regression results at face value, the evolutions of the two indexes since the U.S. election imply a decrease
in the equity premium of 0.92%, thus more than needed to explain the 0.5% decline derived in the previous
section. This result must be taken with more than the usual grain of salt, but it suggests that the decrease in
uncertainty worldwide may have counteracted the higher political uncertainty in the United States and may explain
part of the decrease in the equity premium.
10
See the Economic Policy Uncertainty website at http://www.policyuncertainty.com/index.html for data and further construction
details. The European index covers France, Germany, Italy, Spain, and the United Kingdom.
117. CONCLUSIONS
To conclude, a bit more than half of the increase in the aggregate U.S. stock prices from the presidential election to
the end of 2017 can be attributed to higher actual and expected dividends. A general improvement in economic
activity and a decrease in economic policy uncertainty around the world—contrary to what was forecast before the
U.S. election—were the main factors behind the stock market increase. The prospect and the eventual passage of
the corporate tax bill nevertheless played a role. And while part of the rise in stock returns came from a decrease in
the equity risk premium, this decrease was limited and returned the premium to the levels of the first half of the
2000s.
Given the methodology used in this analysis, if a stock market bubble were present, it would manifest itself in a
lower constructed equity risk premium: Investors would be willing to pay more for equities than their fundamental
value. The decrease in the equity premium has been relatively small, however, and as of the end of 2017 the level of
the premium did not appear unusually low by historical standards. In other words, if the U.S. stock market had a
bubble component, this component was not particularly large.
However, long periods of steady increases in prices, no matter how justified, often lead to extrapolative
expectations and sometimes to bubbles. The further large increase in January, despite a steepening yield curve, may
have had some of this character, leading in turn to the market sell-off and the adjustments in February.
12REFERENCES
Baker, Scott, Nicolas Bloom, and Steven Davis. 2016. Measuring economic policy uncertainty. Quarterly Journal of
Economics 131(4): 1593–1636.
Campbell, John Y., and Robert J. Shiller. 1988a. The dividend-price ratio and expectations of future dividends and
discount factors. Review of Financial Studies 1(3): 195–228.
Campbell John Y., and Robert J. Shiller. 1988b. Stock prices, earnings, and expected dividends. Journal of Finance
43(3): 661–76.
Cochrane, John H. 2008. The dog that did not bark: A defense of return predictability. Review of Financial Studies
21(4): 1533–75.
Gordon, Myron J. 1959. Dividends, earnings and stock prices. Review of Economics and Statistics 41(2): 99–105.
Gordon, Myron J., and Eli Shapiro. 1956. Capital equipment analysis: The required rate of profit. Management
Science 3(1): 102–110.
IMF (International Monetary Fund). 2016. World Economic Outlook October 2016. Washington.
IMF (International Monetary Fund). 2018. World Economic Outlook Update: Brighter Prospects, Optimistic Markets,
Challenges Ahead (January). Washington.
Møller, Stig V., and Magnus Sander. 2017. Dividends, earnings, and predictability. Journal of Banking and Finance
78: 153–63.
Silverblatt, Howard. 2017. S&P 500 2016: Global sales. S&P Global, pages 1–15.
Joint Committee on Taxation. 2017. Estimated budget effects of the conference agreement for H.R.1, the “Tax
Cuts and Jobs Act.” JCX, 67-17: 1–10. Washington.
Wagner, Alexander F., Richard J. Zeckhauser, and Alexander Ziegler. 2018a. Company stock price reactions to the
2016 election shock: Trump, taxes and trade. Journal of Financial Economics, forthcoming.
Wagner, Alexander F., Richard J. Zeckhauser, and Alexander Ziegler. 2018b. Unequal Rewards to Firms: Stock
Market Responses to the Trump Election and the 2017 Corporate Tax Reform. American Economic Review Papers
and Proceedings, 108: 590-596.
1314
15
16
17
18
You can also read