The 2020 US Elections and the Markets: What Can History Tell Us? - Meketa Investment ...
←
→
Page content transcription
If your browser does not render page correctly, please read the page content below

The 2020 US Elections and the Markets:
     What Can History Tell Us?
                                                                                                      GLOBAL
                                                                                                      MACROECONOMIC
                                                                                                      RESEARCH SERIES
                                                                                                      OCTOBER 2020
                                                                                                      ISSUE TWENTY NINE

    What are some historical predictors of presidential elections?

    Do elections matter to financial markets?
                                                                                                      GLOBAL MACROECONOMIC
    Do elections lead to greater market volatility?                                                   INVESTMENT COMMITTEE
                                                                                                      Richard O’Neill, Chair
                                                                                                      Keith Beaudoin
    Does it matter which party wins the election?                                                     Tom Dunleavy
                                                                                                      Tim Filla
                                                                                                      David Hetzer
    How would Biden’s economic policies differ from Trump’s?                                          Paola Nealon
                                                                                                      David Smith

    What are some unique aspects that may cause the drivers of                                        Orray Taft
                                                                                                      Eric White
    this election to differ considerably from historical precedent?

Every four years, the world’s attention turns to the political spectacle that is the
US presidential election. Key issues affected by this election include healthcare,
immigration, trade policies, taxes, climate change, the Supreme Court composition,
and foreign relations. Voters are inundated with exclamations about how the results
of the upcoming election carry high consequences. With the widening gap in views
between political parties, perhaps the election truly will drive generational change.
In this paper we look to history to provide some context to the election’s impact on
financial markets and the economy. We recognize that the data set for presidential
elections is relatively small, given that elections are held every four years. That
being said, there are some historical relationships among elections, markets, and
the economy that we can observe.

MEKETA.COM | B O STO N C H I C AG O LO N D O N M I A M I N E W YO R K P O RT L A N D SA N D I E G O       PAGE 1 OF 10
                                                                                                          © 2020 MEKETA INVESTMENT GROUP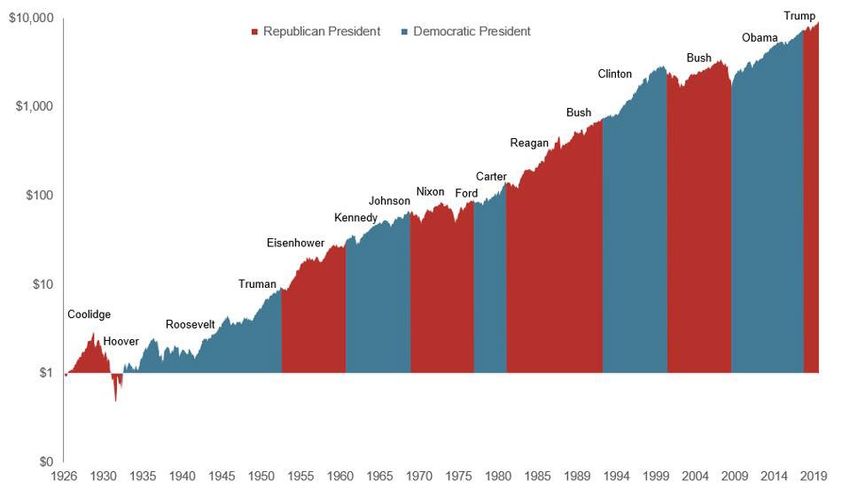
Historical predictors of presidential election
Two of the most reliable predictors of election outcomes are the state of the                                     1
                                                                                                                      https://www.cnbc.com/2020/07/06/
                                                                                                                      head-of-policy-research-at-
economy and the performance of the stock market. In 1992, presidential adviser to                                     strategas-says-the-stock-market-will-
                                                                                                                      determine-the-election-in-november.
Bill Clinton, James Carville, famously said, “It’s the economy, stupid” when referring                                html
to what drives elections. Whether the economy is in a recession or expansion
leading up to a presidential election has had a strong historical correlation with
the outcome of the election. In research conducted by Dan Clifton of Strategas
Research Partners, he points out that over the last 100 years, every incumbent
president who avoided a recession during the two years leading up to an election
was re-elected.1 Further, only one candidate, Calvin Coolidge, was re-elected when
there was a recession in the two years leading up to the election.

The behavior of the stock market in the months leading to the election has likewise
been a good predictor. When returns for the S&P 500 index were positive in the
three-month period ahead of the election, the incumbent party won. If the index
suffered losses in that window, the incumbent lost. According to Clifton, this has
accurately predicted 87% of elections since 1928 and 100% since 1984.

Do elections matter to financial markets?
One area that often gets conflated with the outcome of elections is the
subsequent performance of the stock market. The stock market is often seen
as a discounting mechanism for future expectations for the economy and
corporate earnings. Because the presidency is one of the most, if not the most,
powerful and influential positions in the world, it makes sense that markets would
be influenced by the election. As such, people often point to the performance
of the stock market leading to a presidential election as a proxy for investors’
aggregate expectations for the economic impact of the election’s outcome and
the policies of the winner.

Before proceeding, it is important to reiterate that the data set is limited                                      2
                                                                                                                      The year 1926 is used as the start
                                                                                                                      date as it marks Standard & Poor’s
(i.e., there have only been 23 presidential elections since 19262). Additionally,                                     (S&P) development of their first
                                                                                                                      stock index which was comprised
elections may be influenced by external events such as depressions, pandemics,                                        of 90 stocks and later expanded to
                                                                                                                      500 in 1957.
world wars, and financial crises, which may not have been under the control
of the President. Reviewing the S&P 500 index return during election years
versus non-election years is informative. In an analysis by T. Rowe Price, the
market returned 10.7% during election years and 11.6% in non-election years.
This modest 0.9% differential may indicate that who holds the presidency is not
as important (for the markets) as many voters, and investors, assume.

                                             Election Years               Other Years                 All Years
                                                                                                                  table 1
Count                                                   23                         69                    92       Calendar Year Returns
                                                                                                                  for the S&P 500 Index:
Mean                                                  10.7%                      11.6%                  11.4%     December 31, 1927 through
                                                                                                                  December 31, 2019
                                                                                                                  Source: T. Rowe Price; Data from Bloomberg
Median                                                12.0%                      14.3%                  14.0%     Finance L.P.; S&P 500 Index Returns (gross
                                                                                                                  of dividends). Prior to formal S&P 500 Index
                                                                                                                  inception in 1957, data is sourced from Robert
Standard Deviation                                    16.9%                     20.7%                   19.7%     J. Shiller. (http://www.econ.yale.edu/~shiller/
                                                                                                                  data/chapt26.html)

MEKETA.COM | B O STO N C H I C AG O LO N D O N M I A M I N E W YO R K P O RT L A N D SA N D I E G O                        PAGE 2 OF 10
                                                                                                                           © 2020 MEKETA INVESTMENT GROUP
That said, history appears clear on one point: elections have a greater market
impact when there is a change of political parties. Looking at calendar years
from 1926 through 2019, during years with presidential elections where the
presidency stayed in the same party (either the president was re-elected or
the new president was from the same party), the S&P 500 averaged an annual
return of 16.0%, but when the presidency switched parties, the annual average
return was 5.1%. So history seems to suggest that there is a substantive impact
due to a switch in political parties. However, it is important to remember that if
a weak economy is a primary factor in a change in the party of the president,
it would follow that the new president inherits an economy often in recession.
This could contribute to weak equity market returns depending on where the
economy is in the course of the recession.
Overall, except for a change in parties, it does not appear that presidential
election years have an outsized impact on markets. Rather, as we discussed,
the chain of cause and effect appears to move in the opposite direction: the
markets and economy have a greater impact on who will be elected.
Do elections lead to greater market volatility?
Another commonly held, but historically erroneous assumption, is that elections 3
Source: Vanguard calculations of
S&P 500 Index daily return volatility
cause greater market volatility. This assumption seems intuitive given all the from January 1, 1964, through
December 31, 2019, based on data
uncertainties of an election and its impact on the direction of the economy from Thomson Reuters.
and market. However, looking at the S&P 500 index’s annualized volatility,
Vanguard’s research finds that this assumption is contradicted by the data.
Starting in 1964, the annualized volatility of the S&P 500 index was 13.8% in the
100 days preceding and following a presidential election versus a full sample
period annualized volatility of 15.7%.3 As the volatility around elections is below
the historical average, it points to markets potentially pricing in the anticipated
winner of the election or perhaps that market participants are unwilling to risk
capital until after the election; waiting until there is more clarity on the elected
President’s agenda as well as the make-up of Congress.
Figure 1
Volatility and the Vote:
Markets Tend to Ignore
Elections
Source: Vanguard calculations of S&P
500 Index daily return volatility from
January 1, 1964, through December 31,
2019, based on data from
Thomson Reuters.
MEKETA.COM | B O STO N C H I C AG O LO N D O N M I A M I N E W YO R K P O RT L A N D SA N D I E G O PAGE 3 OF 10
© 2020 MEKETA INVESTMENT GROUPDoes it matter which party wins the election?
In the face of today’s partisan rhetoric, what does history have to say about
the impact of the parties on stock market performance? It is often assumed
that the traditional policies of lower taxes and less regulation of the Republican
Party would benefit the economy and ultimately the markets. This conclusion is
also not borne out in the data.
From 1926 to 2019, there have been 48 years with a Democratic president in
office, while a Republican president has led for 46 years. The return differential
between parties was dramatic, with nearly a 6% per year premium in the
S&P 500 index for periods when a Democratic president held office (15% versus
9% per annum).
Obviously, viewing only which party controls the presidency overlooks the
importance of Congress. Since Congress can aid or check presidential power,
it is critical to look at which party, if either, controls Congress when evaluating
the ability of the president to enact legislation and to spend more freely on
initiatives. From 1926 to 2019, there were an equal number of years of unified
government during which the same party controlled the presidency and
both houses of Congress, and divided government during which at least one
house of Congress was held by the opposition party. During periods of divided
government, the S&P 500 returned 9.7% per year, but during periods of a unified
government, the annual average return was 14.5%.
However a deeper look provides an even more nuanced perspective. There are
four potential states of play: unified Republican, unified Democrat, and divided
with each presidential party. What we find is the political composition that has
experienced the best stock market performance is a divided Congress with
a Democratic President. The opposite - a divided Congress and a Republican
President - has historically produced the worst returns.
S&P 500 Average
Annual Return table 2
S&P 500 Returns by
Political Composition Number of Years (%)
Political Composition
Source: Retirement Researcher. Data
Unified Republican 13 14.5 from 1926 through 2019. Unified
government means that the presidency,
the House of Representatives and the
Unified Democrat 34 14.5 Senate are all controlled by a single
party. Divided government means that
at least one house of Congress or the
presidency is controlled by the other
Divided w/ Republican President 33 7.0 party.
Divided w/ Democrat President 14 15.9
MEKETA.COM | B O STO N C H I C AG O LO N D O N M I A M I N E W YO R K P O RT L A N D SA N D I E G O PAGE 4 OF 10
© 2020 MEKETA INVESTMENT GROUPWe caution against drawing dogmatic conclusions from these data. We note that
while we are looking at close to a century, it covers only 16 presidents (two of
whom started as vice presidents and assumed power). Given such a limited data
set it can be heavily influenced by factors outside of the president’s or Congress’
control. We also note that the measurement period has an outsize effect on the
outcome. Using a narrower measurement period of the past 70 years shows
a unified Republican government producing the best results with a nearly 3%
advantage over a unified Democratic government, and a 5% advantage over a
divided government. We raise this to highlight how sensitive outcomes can be to
changes in sample size when we are already using an extremely limited data set.
How do Biden’s economic policy proposals differ
from Trump’s?
One of the key reasons many argue for the similarities in economic and stock
market performance under Republican and Democratic control is the fact that,
despite the rhetoric, the policy differences between the two parties have been
historically limited. Additionally, with the exception of changes in taxes, most of
the impacts of various policies are long-term in nature.
However, today some argue we are in a new paradigm where the ideological divide
is widening, which may portend a greater differentiation in the performance of
the economy and the stock market.
Figure 2
Democrats and Republicans
More Ideologically Divided
Than in the Past: Distribution
of Democrats and Republicans
on a 10-Item Scale of Political
Values
Source: PEW RESEARCH CENTER Survey
conducted June 8-18, 2017.
Notes: Ideological consistency based on a scale
of 10 political values questions asked on Pew
Research Center surveys going back to 1994 to
gauge the degree to which people hold liberal
or conservative attitudes across many political
values. The blue area in this chart represents
the ideological distribution of Democrats and
Democratic-leaning independents; the red
area of Republicans and Republican-leaning
independents. The overlap of these two
distributions is shaded purple.
In 1994 and 2004, the median Democrat and median Republican had a large
percentage of overlapping political values, as shown in the graph above from the
Pew Research Center. The political views of the two parties have since diverged
significantly, with Republicans skewing further right and Democrats skewing
further left, leaving fewer areas of common ground. This may indicate that the
policy views of the parties have a greater impact than in previous elections.
MEKETA.COM | B O STO N C H I C AG O LO N D O N M I A M I N E W YO R K P O RT L A N D SA N D I E G O PAGE 5 OF 10
© 2020 MEKETA INVESTMENT GROUPTo help better understand the differences between the candidates’ platforms,
we summarized policy views on several key issues in the following table. It is
important to note that President Trump has not formally released many of
his proposed policies, so the table was derived primarily from his 2021 Budget
Proposal. We will also discuss the impacts these policies might have on the
economy and markets.
Policy Area Trump Biden
table 3
Tax Policy Favors lower taxes and lower Increase corporate tax
Key Policy Stances
& Wages capital gains rates; “Made in rates from 21% to 28% (still
America” tax credits; expanded lower than under President
tax breaks for investing in Obama) and implement a
lower-income communities; minimum 15% tax on global
Has indicated support for an income over $100 million;
increased minimum wage but increase the tax rate for
prefers to leave it to States. individuals earning over
$400,000 to 39.6%; Supports
a $15 an hour national
minimum wage.
Infrastructure Allocate over $1 trillion over ten Allocate over $2 trillion to
years to highways and transit, “sustainable infrastructure”
rural broadband, and 5G cell and clean energy, 5G cell
service. service, rural broadband,
and modernize schools.
Government Favors smaller government Favors increased
Reach and and de-regulation; continue to government involvement;
Regulation ease regulation for businesses. strengthen regulation and
oversight.
Trade Policy “America First”, protectionist in “Why America Must Lead
nature, use of tariffs; hard line Again”; coalition forming to
stance with China. confront China.
Immigration Favors restrictive immigration Vowed to reverse President
policies including building Trump’s immigration policies
the southern wall and more including border detention
restrictive visa requirements. and public charge rule.
Climate Change Pulled the US out of the Paris Proposed a $2 trillion
Climate Accord. climate plan with the goal
of achieving an emissions-
free power sector by 2035
and upgrading four million
buildings over four years to
meet the highest standards
for energy efficiency.
MEKETA.COM | B O STO N C H I C AG O LO N D O N M I A M I N E W YO R K P O RT L A N D SA N D I E G O PAGE 6 OF 10
© 2020 MEKETA INVESTMENT GROUPDespite the sizable difference in proposed policies, it is likely the course of the
economy would be similar for at least the first few years, as both candidates have
pledged robust fiscal support to help the economy respond to the pandemic.
Coupled with an exceedingly accommodative monetary policy, it is likely that the
economy will make substantial strides in 2021, especially if an effective vaccine
is developed and dispersed in the first half of the year. Years 3 and 4 of the next
President’s term are likely where the policy differences will become most evident.
President Trump’s economic initiatives are largely a continuation of those
implemented pre-pandemic, focused around low taxes, deregulation, and
protectionist trade policies, with a particularly aggressive stance against China.
By contrast, Mr. Biden’s plans include an increase in taxes for individuals and
high earners, a more collaborative approach with our allies on foreign policy,
broader regulation, and “green” initiatives. The degree to which either candidate
can implement their economic agenda depends largely on the composition
of Congress. Given current projections, a re-elected President Trump would
probably face a divided government, making it difficult to move his proposals
through Congress.
Under a Biden victory, the likely scenario is a Democratic House with uncertainty
about who will control the Senate. If Democrats capture enough seats in the
Senate, and Biden wins, there is the chance for a unified government if Democrats
can continue to hold the House. Even with a unified government, it is still uncertain
whether the more ambitious portions of Biden’s agenda would pass, as the
seat advantage in the Senate would be small and the gap in views within the
Democratic party has widened.
Why might the drivers of this election differ from
historical precedent?
People often choose to ignore the lessons history provides by claiming that
“this time is different”. History, however, tends to show that “this time” is often
truly not that different. That said, there are several unique aspects to this
election that may influence the outcome. The economy is currently in recession
which history would indicate portends a change in the presidency. However,
this recession was driven by the need to shut down the economy to slow the
spread of COVID-19. Prior to the shutdown, the economy was performing
particularly well, with unemployment hitting 50-year lows. Perhaps some voters
will overlook the recession given the unprecedented circumstances and look to
the projected recovery.
MEKETA.COM | B O STO N C H I C AG O LO N D O N M I A M I N E W YO R K P O RT L A N D SA N D I E G O PAGE 7 OF 10
© 2020 MEKETA INVESTMENT GROUPAs we previously discussed, market performance in the three months leading
up to the election has been a relatively reliable guide. While we do not know
the S&P 500 return for the full month of October, we do know that the August
and September period produced a 3.4% return. Therefore, if October’s return
is greater than -3.4%, the markets will have been positive for the three months
heading into the election. However, many analysts attribute much of this equity
market rally to central bank intervention and historically low interest rates.
Given the current level of wealth inequality, and the benefits of stock ownership
not accruing evenly across the population, it may not matter if the market
is strong. Given the widening of views held by each party across a variety of
areas this election may not be solely about the economy and as such market
performance may not be as predictive as it has been in prior elections.
Conclusion
Presidential elections are undoubtedly important events, as they shape the
direction of the country. That said, historically, the election itself has not been
the major disruptive force that many assume it is with many policies not having
immediate impacts. Additionally, the performance of the stock market as a proxy
for the economy and national sentiment has been relatively consistent across
different political party compositions. While some mixes appear more favorable
than others, these apparent differences may be due largely to a limited data set
and one-off exogenous factors more than a specific preference by the market
for one party over another.
Turning to the 2020 Presidential Election, when looking at Mr. Biden’s proposed
economic policies we see an obvious shift away from some of President Trump’s
core policies. We believe President Trump’s policies would remain largely the
same as his first term if he is re-elected. This would lead to an environment of
lower taxes, decreased regulation, a protectionist trade stance, and spending
focused on infrastructure and defense over areas like healthcare. In contrast,
Mr. Biden’s proposed policies focus on healthcare, climate change, re-regulation,
increased taxation, and immigration. Other areas, like infrastructure spending
and a COVID-19 fiscal response, do not appear to differ significantly; that is, the
dollar amount spent will be roughly the same, but what comprises the programs
will be different (e.g., more dollars spent on “green” infrastructure). Additionally,
no matter who is elected, they will inherit an environment of extremely
supportive monetary policy and an economy that needs significant support in
emerging from the pandemic induced recession. As such, the 2020 election
may not be as disruptive as many have assumed and historical precedents may
not prove predictive of the results.
MEKETA.COM | B O STO N C H I C AG O LO N D O N M I A M I N E W YO R K P O RT L A N D SA N D I E G O PAGE 8 OF 10
© 2020 MEKETA INVESTMENT GROUPThe important thing to remember in this charged political climate is that the
economy and the stock market go up and down under all presidents. There
have been periods of tremendous prosperity as well as dire hardship under
both parties, yet over time, the entrepreneurial spirit and dynamism of the
American people has driven long-term economic growth and the trajectory for
the stock market has been positive as shown in the following graph.
Figure 3
Growth of a Dollar
Invested in the S&P 500:
January 1926-December
2019
Source: https://www.forbes.com/sites/
kristinmckenna/2020/08/18/heres-
how-the-stock-market-has-performed-
before-during-and-after-presidential-
elections/#345307c84f86
MEKETA.COM | B O STO N C H I C AG O LO N D O N M I A M I N E W YO R K P O RT L A N D SA N D I E G O PAGE 9 OF 10
© 2020 MEKETA INVESTMENT GROUPDisclaimers
This document is for general information and educational purposes only, and
must not be considered investment advice or a recommendation that the reader
is to engage in, or refrain from taking, a particular investment-related course of
action. Any such advice or recommendation must be tailored to your situation
and objectives. You should consult all available information, investment, legal,
tax and accounting professionals, before making or executing any investment
strategy. You must exercise your own independent judgment when making any
investment decision.
All information contained in this document is provided “as is,” without any
representations or warranties of any kind. We disclaim all express and implied
warranties including those with respect to accuracy, completeness, timeliness,
or fitness for a particular purpose. We assume no responsibility for any losses,
whether direct, indirect, special or consequential, which arise out of the use of
this presentation.
All investments involve risk. There can be no guarantee that the strategies,
tactics, and methods discussed in this document will be successful.
Data contained in this document may be obtained from a variety of sources and
may be subject to change. We disclaim any and all liability for such data, including
without limitation, any express or implied representations or warranties for
information or errors contained in, or omissions from, the information. We shall
not be liable for any loss or liability suffered by you resulting from the provision
to you of such data or your use or reliance in any way thereon.
Nothing in this document should be interpreted to state or imply that past
results are an indication of future performance. Investing involves substantial
risk. It is highly unlikely that the past will repeat itself. Selecting an advisor, fund,
or strategy based solely on past returns is a poor investment strategy. Past
performance does not guarantee future results.
MEKETA.COM | B O STO N C H I C AG O LO N D O N M I A M I N E W YO R K P O RT L A N D SA N D I E G O PAGE 10 OF 10
© 2020 MEKETA INVESTMENT GROUPYou can also read