2016 Global Carbon Budget - Published on 14 November 2016 - Global Carbon Project
←
→
Page content transcription
If your browser does not render page correctly, please read the page content below
Global Carbon Budget

    2016
                Published on 14 November 2016
                   PDF version 1.0 (released 14 November 2016)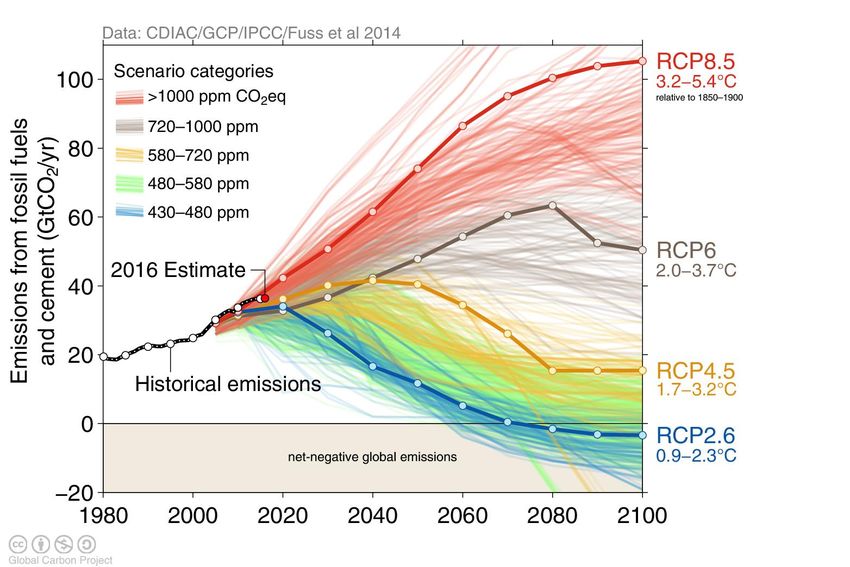
Acknowledgements

 The work presented here has been possible thanks to the enormous observational and
               modelling efforts of the institutions and networks below

Atmospheric CO2 datasets                              Atmospheric inversions
NOAA/ESRL (Dlugokencky and Tans 2016)                 CarbonTracker (Peters et al. 2010)
Scripps (Keeling et al. 1976)                         Jena CarboScope (Rödenbeck et al. 2003)
                                                      MACC (Chevallier et al. 2005)
Fossil Fuels and Industry
CDIAC (Boden et al. 2016)                             Land models
USGS, 2016                                            CABLE-POP | CLASS-CTEM | CLM4.5BGC | DLEM |
UNFCCC, 2016                                          ISAM | JSBACH | JULES | LPJ-GUESS | LPJ | LPX |
BP, 2016                                              OCNv2 | ORCHIDEE | SDGVM | VISIT
                                                      CRU (Harris et al. 2014)
Consumption Emission
Peters et al. 2011                                    Ocean models
GTAP (Narayanan et al. 2015)                          NEMO-PlankTOM5 | NEMO-PISCES (IPSL) | CCSM-BEC
                                                      | MICOM-HAMMOC | NEMO-PISCES (CNRM) | CSIRO
Land-Use Change                                       | MITgem-REcoM2
Houghton et al. 2012
GFED4 (van der Werf et al. 2010)                      Ocean Data products
FAO-FRA and FAOSTAT                                   Jena CarboScope (Rödenbeck et al. 2014)
HYDE (Klein Goldewijk et al. 2011)                    Landschützer et al. 2015
                                                      SOCATv4 (Bakker et al. 2016)

                            Full references provided in Le Quéré et al 2016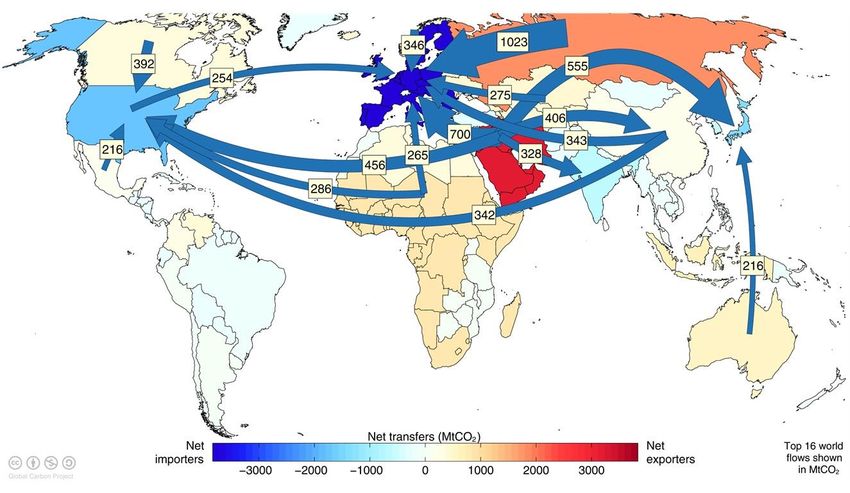
Contributors 74 people | 57 organisations | 14 countries

C Le Quéré UK | RM Andrew Norway | GP Peters Norway | JG Canadell Australia | S Sitch UK | JI Korsbakken
Norway | P Ciais France | P Friedlingstein UK | AC Manning UK
TA Boden USA | PP Tans USA | RA Houghton USA | RF Keeling USA
S Alin USA | OD Andrews UK | P Anthoni USA | L Barbero USA | L Bopp France | F Chevallier France | LP Chini
USA | K Currie New Zealand | C Delire France | SC Doney USA | S Fuss Germany | T Gkritzalis Belgium | I Harris
UK | J Hauck Germany | V Haverd Australia | M Hoppema Germany | R Jackson USA | K Jain USA | E Kato Japan
| K Klein Goldewijk Netherlands | A Körtzinger Germany | P Landschützer Switzerland | N Lefèvre France | A
Lenton Australia | S Lienert Switzerland | D Lombardozzi USA | JR Melton Canada | N Metzl France | F Millero
USA | PMS Monteiro South Africa | DR Munro USA | JEMS Nabel Germany | S-I Nakaoka Japan | N Nakicenovic
Austria | K O'Brien USA | A Olsen Norway | AM Omar Norway | T Ono Japan | D Pierrot USA | B Poulter USA | C
Rödenbeck Germany | J Rogelj Austria | J Salisbury USA | U Schuster UK | J Schwinger Norway | R Séférian
France | I Skjelvan Norway | BD Stocker UK | AJ Sutton USA | T Takahashi USA | H Tian USA | B Tilbrook
Australia | IT van der Laan-Luijkx Netherlands | GR van der Werf Netherlands | N Viovy France | AP Walker USA
| AJ Wiltshire UK | S Zaehle Germany

Atlas Science Committee | Atlas Team Members at LSCE, France (not already mentioned above)
A Peregon | P Peylin | P Brockmann | V Maigné | P Evano | C Nangini

Communications Team
A Minns | O Gaffney | B Woolliams
Data access

More information, data sources and data files:   More information, data sources and data files:
       www.globalcarbonproject.org                        www.globalcarbonatlas.org
       Contact: c.lequere@uea.ac.uk                  (funded in part by BNP Paribas Foundation)
                                                       Contact: philippe.ciais@lsce.ipsl.fr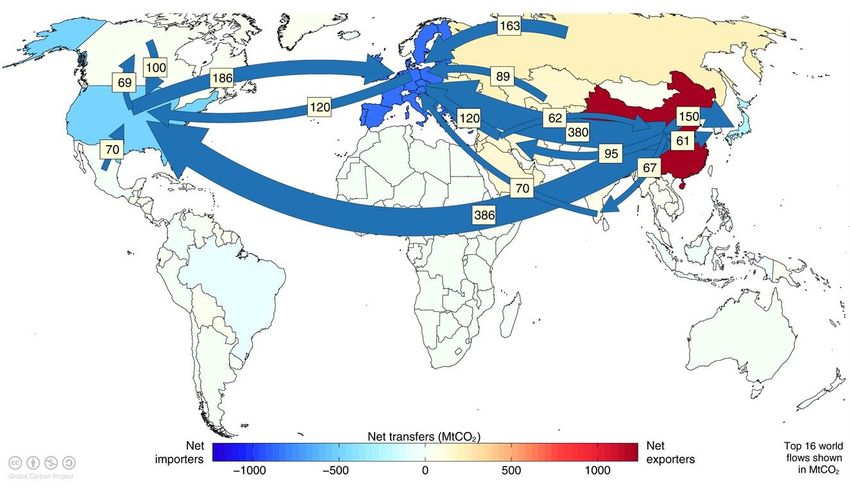
All the data is shown in billion tonnes CO2 (GtCO2)
         1 Gigatonne (Gt) = 1 billion tonnes = 1×10¹⁵g = 1 Petagram (Pg)

                     1 kg carbon (C) = 3.664 kg carbon dioxide (CO2)

                      1 GtC = 3.664 billion tonnes CO2 = 3.664 GtCO2
                   (Figures in units of GtC and GtCO2 are available from http://globalcarbonbudget.org/carbonbudget)

                                                      Disclaimer
    The Global Carbon Budget and the information presented here are intended for those interested in
  learning about the carbon cycle, and how human activities are changing it. The information contained
 herein is provided as a public service, with the understanding that the Global Carbon Project team make
no warranties, either expressed or implied, concerning the accuracy, completeness, reliability, or suitability
                                             of the information.
Anthropogenic perturbation of the global carbon cycle

Perturbation of the global carbon cycle caused by anthropogenic activities,
         averaged globally for the decade 2006–2015 (GtCO2/yr)

       Source: CDIAC; NOAA-ESRL; Le Quéré et al 2016; Global Carbon Budget 2016
Fossil Fuel and Industry Emissions
Emissions from fossil fuel use and industry
Global emissions from fossil fuel and industry: 36.3 ± 1.8 GtCO2 in 2015, 63% over 1990
             Projection for 2016: 36.4 ± 2.3 GtCO2, 0.2% higher than 2015

                                                                                       Uncertainty is ±5% for
                                                                                       one standard deviation
                                                                                        (IPCC “likely” range)

       Estimates for 2014 and 2015 are preliminary. Growth rate is adjusted for the leap year in 2016.
                      Source: CDIAC; Le Quéré et al 2016; Global Carbon Budget 2016
Observed emissions and emissions scenarios

The emission pledges to the Paris Agreement avoid the worst effects of climate change (4-5°C)
  Most studies suggest the pledges give a likely temperature increase of about 3°C in 2100

The IPCC Fifth Assessment Report assessed about 1200 scenarios with detailed climate modelling on four Representative
                                             Concentration Pathways (RCPs)
                Source: Fuss et al 2014; CDIAC; IIASA AR5 Scenario Database; Global Carbon Budget 2016
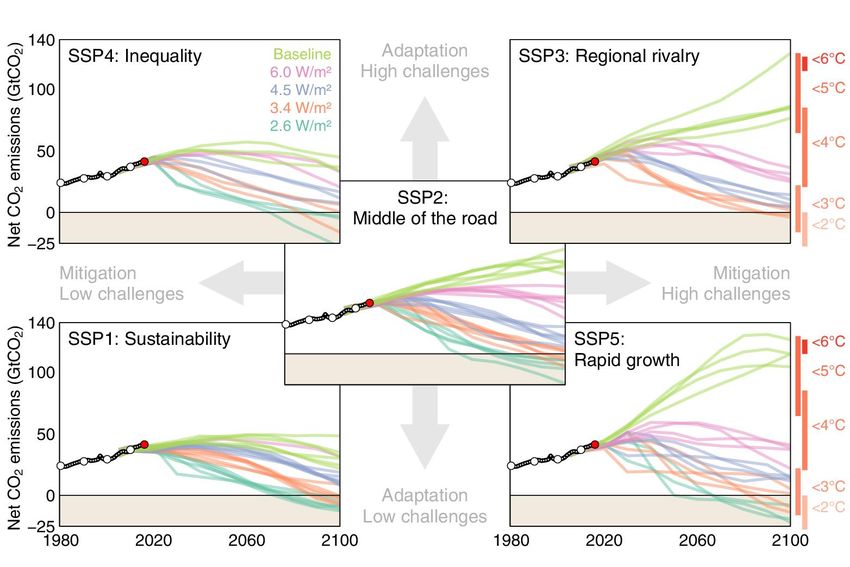
New generation of scenarios

In the lead up to the IPCC’s Sixth Assessment Report new scenarios have been developed to
    more systematically explore key uncertainties in future socioeconomic developments

Five Shared Socioeconomic Pathways (SSPs) have been developed to explore challenges to adaptation and mitigation.
                 Shared Policy Assumptions (SPAs) are used to achieve target forcing levels (W/m2).
                     Source: Riahi et al. 2016; IIASA SSP Database; Global Carbon Budget 2016
Top emitters: fossil fuels and industry (absolute)
The top four emitters in 2015 covered 59% of global emissions
China (29%), United States (15%), EU28 (10%), India (6%)
Bunker fuels are used for international transport is 3.1% of global emissions.
Statistical differences between the global estimates and sum of national totals are 1.2% of global emissions.
Source: CDIAC; Le Quéré et al 2016; Global Carbon Budget 2016Top emitters: fossil fuels and industry (per capita)
Countries have a broad range of per capita emissions reflecting their national circumstances
Source: CDIAC; Le Quéré et al 2016; Global Carbon Budget 2016Top emitters: fossil fuels and industry (per dollar)
Emissions per unit economic output (emissions intensities) generally decline over time
China’s intensity is declining rapidly, but is still much higher than the world average
GDP are measured in purchasing power parity (PPP) terms in 2005 dollars.
Source: CDIAC; IEA 2015 GDP to 2013, IMF 2016 growth rates to 2015; Le Quéré et al 2016; Global Carbon Budget 2016Alternative rankings of countries
Depending on perspective, the significance of individual countries changes
GDP: Gross Domestic Product in Market Exchange Rates (MER) and Purchasing Power Parity (PPP)
Source: CDIAC; United Nations; Le Quéré et al 2016; Global Carbon Budget 2016Emissions from coal, oil, gas, cement
Share of global emissions in 2015:
coal (41%), oil (34%), gas (19%), cement (6%), flaring (1%, not shown)
Source: CDIAC; Le Quéré et al 2016; Global Carbon Budget 2016Energy consumption by energy type
Energy consumption by fuel source from 2000 to 2015, with growth rates indicated for the
more recent period of 2010 to 2015
Source: BP 2016; Jackson et al 2015; Global Carbon Budget 2016Fossil fuel and cement emissions growth
The biggest changes in emissions were from a decline in coal and an increase in oil
Source: CDIAC; Le Quéré et al 2016; Global Carbon Budget 2016Fossil fuel and cement emissions growth
Emissions in the US, China and Russia declined
Emissions in India and all other countries combined increased
Figure shows the top four countries contributing to emissions changes in 2015
Source: CDIAC; Le Quéré et al 2016; Global Carbon Budget 2016Breakdown of global emissions by country
Emissions from Annex B countries have slightly declined since 1990
Emissions from non-Annex B countries have increased rapidly in the last decade
Annex B countries had emission commitments in the Kyoto Protocol (USA did not ratify, Canada withdrew)
Source: CDIAC; Le Quéré et al 2016; Global Carbon Budget 2016Historical cumulative emissions by country
Cumulative emissions from fossil-fuel and cement were distributed (1870–2015):
USA (26%), EU28 (23%), China (13%), Russia (7%), Japan (4%) and India (3%)
Cumulative emissions (1990–2015) were distributed China (21%), USA (20%), EU28 (14%), Russia (6%), India/Japan (4%)
‘All others’ includes all other countries along with bunker fuels and statistical differences
Source: CDIAC; Le Quéré et al 2016; Global Carbon Budget 2016Historical cumulative emissions by continent
Cumulative emissions from fossil-fuel and cement (1870–2015)
North America and Europe responsible for most cumulative emissions, but Asia growing fast
The figure excludes bunker fuels and statistical differences
Source: CDIAC; Le Quéré et al 2016; Global Carbon Budget 2016Carbon intensity of economic activity
Global emissions growth has generally recovered quickly from previous financial crises
It is unclear if the recent slowdown in global emissions is related to the Global Financial Crisis
Economic activity is measured in Purchasing Power Parity
Source: CDIAC; Peters et al 2012; Le Quéré et al 2016; Global Carbon Budget 2016Emissions intensity per unit economic activity
The 10 largest economies have a wide range of emissions intensity of economic production
Emission intensity: CO2 emissions from fossil fuel and industry divided by Gross Domestic Product
Source: Global Carbon Budget 2016Emissions per capita
The 10 most populous countries span a wide range of development and emissions per person
Emission per capita: CO2 emissions from fossil fuel and industry divided by population
Source: Global Carbon Budget 2016Key statistics
Emissions 2015
Per capita Total Growth 2014-15
Region/Country
tCO2 per person GtCO2 % GtCO2 %
Global (with bunkers) 4.9 36.26 100 0.021 0.0
Developed Countries (Annex B)
Annex B 10.6 12.97 35.8 -0.228 -1.7
USA 16.8 5.42 14.9 -0.141 -2.6
EU28 7.0 3.51 9.7 0.048 1.4
Russia 11.3 1.62 4.5 -0.055 -3.3
Japan 9.8 1.24 3.4 -0.028 -2.2
Canada 12.9 0.46 1.3 -0.014 -3.0
Developing Countries (Non-Annex B)
Non-Annex B 3.5 21.72 59.9 0.184 0.9
China 7.5 10.36 28.6 -0.077 -0.7
India 1.7 2.27 6.3 0.113 5.2
Iran 8.2 0.65 1.8 0.010 1.5
Saudi Arabia 19.0 0.60 1.7 0.026 4.4
South Korea 11.8 0.59 1.6 0.001 0.2
International Bunkers
Aviation and Shipping - 1.57 4.3 0.065 4.3
Source: CDIAC; Le Quéré et al 2016; Global Carbon Budget 2016Consumption-based Emissions
Consumption–based emissions allocate emissions to the location that goods and
services are consumed
Consumption-based emissions = Production/Territorial-based emissions minus
emissions embodied in exports plus the emissions embodied in importsConsumption-based emissions (carbon footprint)
Allocating emissions to the consumption of products provides an alternative perspective
USA and EU28 are net importers of embodied emissions, China and India are net exporters
Consumption-based emissions are calculated by adjusting the
standard production-based emissions to account for international trade
Source: Peters et al 2011; Le Quéré et al 2016; Global Carbon Project 2016Consumption-based emissions
Transfers of emissions embodied in trade from non-Annex B countries to Annex B countries grew at
about 19% per year between 1990 and 2007, but have since declined at nearly 4% per year.
Annex B countries were used in the Kyoto Protocol, but this distinction is less relevant in the Paris Agreement
Source: CDIAC; Peters et al 2011; Le Quéré et al 2016; Global Carbon Budget 2016Major flows from production to consumption
Flows from location of generation of emissions to location of
consumption of goods and services
Values for 2011. EU is treated as one region. Units: MtCO2
Source: Peters et al 2012Major flows from extraction to consumption
Flows from location of fossil fuel extraction to location of
consumption of goods and services
Values for 2011. EU is treated as one region. Units: MtCO2
Source: Andrew et al 2013Land-use Change Emissions
Land-use change emissions
      Emissions in the 2000s were lower than earlier decades, but highly uncertain
Higher emissions in 2015 are linked to increased fires during dry El Niño conditions in Asia

                                           Indonesian
                                           fires

                                                             Indonesian
                                                             fires

       Three different estimation methods have been used, indicated here by different shades of grey
                     Land-use change also emits CH4 and N2O which are not shown here
       Source: Houghton et al 2012; Giglio et al 2013; Le Quéré et al 2016; Global Carbon Budget 2016
Total global emissions
Total global emissions: 41.9 ± 2.8 GtCO2 in 2015, 49% over 1990
Percentage land-use change: 36% in 1960, 9% averaged 2006-2015
Three different methods have been used to estimate
land-use change emissions, indicated here by different shades of grey
Source: CDIAC; Houghton et al 2012; Giglio et al 2013; Le Quéré et al 2016; Global Carbon Budget 2016Total global emissions by source
Land-use change was the dominant source of annual CO2 emissions until around 1950
Others: Emissions from cement production and gas flaring
Source: CDIAC; Houghton et al 2012; Giglio et al 2013; Le Quéré et al 2016; Global Carbon Budget 2016Historical cumulative emissions by source
Land-use change represents about 26% of cumulative emissions over 1870–2015,
coal 35%, oil 26%, gas 10%, and others 3%
Others: Emissions from cement production and gas flaring
Source: CDIAC; Houghton et al 2012; Giglio et al 2013; Le Quéré et al 2016; Global Carbon Budget 2016Closing the Global Carbon Budget
Fate of anthropogenic CO2 emissions (2006-2015)
16.4 GtCO2/yr
34.1 GtCO2/yr 44%
91%
Sources = Sinks
31%
11.6 GtCO2/yr
9%
3.5 GtCO2/yr
26%
9.7 GtCO2/yr
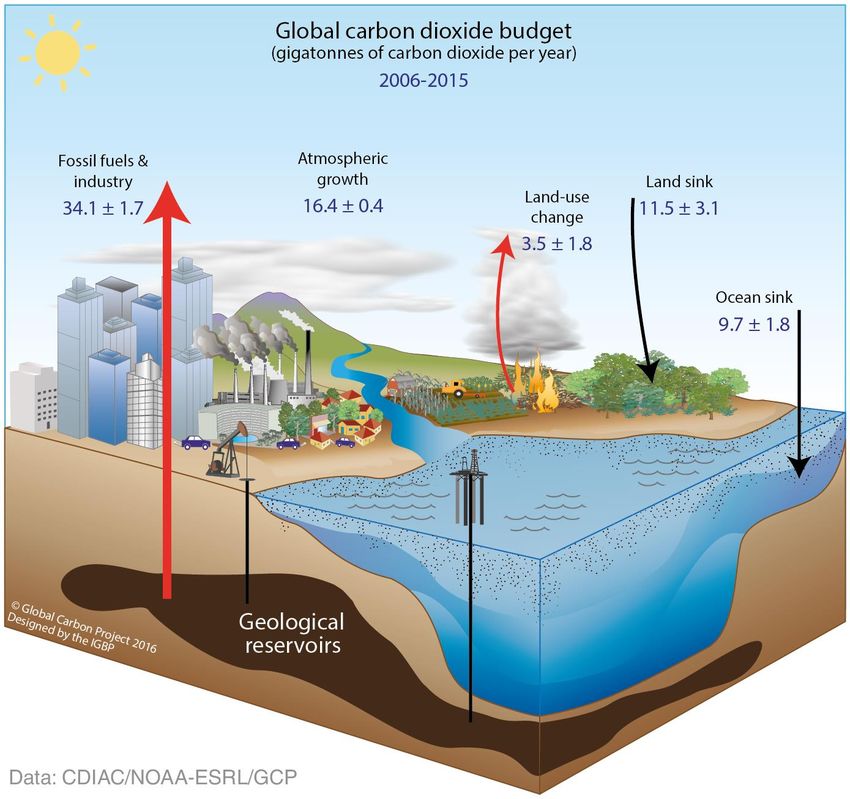
Source: CDIAC; NOAA-ESRL; Houghton et al 2012; Giglio et al 2013; Le Quéré et al 2016; Global Carbon Budget 2016Global carbon budget
The carbon sources from fossil fuels, industry, and land use change emissions are balanced by
the atmosphere and carbon sinks on land and in the ocean
Source: CDIAC; NOAA-ESRL; Houghton et al 2012; Giglio et al 2013; Joos et al 2013; Khatiwala et al 2013;
Le Quéré et al 2016; Global Carbon Budget 2016Changes in the budget over time The sinks have continued to grow with increasing emissions, but climate change will affect carbon cycle processes in a way that will exacerbate the increase of CO2 in the atmosphere Source: CDIAC; NOAA-ESRL; Houghton et al 2012; Giglio et al 2013; Le Quéré et al 2016; Global Carbon Budget 2016
Partitioning of total CO2 emissions

Atmospheric CO2 growth rate was a record high in 2015 in spite of no growth in fossil fuel and
 industry emissions because of a weaker CO2 sink on land from hot & dry El Niño conditions

               The emissions (shown in black) include fossil fuels and industry and land-use change
      Source: CDIAC; NOAA-ESRL; Houghton et al 2012; Giglio et al 2013; Joos et al 2013; Khatiwala et al 2013;
                                Le Quéré et al 2016; Global Carbon Budget 2016
Atmospheric concentration
The atmospheric concentration growth rate has shown a steady increase
The high growth in 1987, 1998, & 2015 reflects a strong El Niño, which weakens the land sink
Source: NOAA-ESRL; Global Carbon Budget 2016Ocean sink
The ocean carbon sink continues to increase
9.7±1.8 GtCO2/yr for 2006-2015 and 11.1±1.8 GtCO2/yr in 2015
this carbon budget
individual ocean models
data products
Source: Le Quéré et al 2016; Global Carbon Budget 2016
Individual estimates from: Aumont and Bopp (2006); Buitenhuis et al. (2010); Doney et al. (2009); Hauck et al. (2016); Landschützer et al. (2015);
Oke et al. (2013); Rödenbeck et al. (2014); Sérérian et al. (2013); Schwinger et al. (2016). Full references provided in Le Quéré et al. (2016).Terrestrial sink
The residual land sink decreased to 6.9±3.2 GtCO2/yr in 2015, due to El Niño conditions
Total CO2 fluxes on land (including land-use change) are constrained by atmospheric inversions
this carbon budget
individual land models
fire-based estimate
this carbon budget
individual land models
this carbon budget
individual land models
atmospheric inversions
Source: Le Quéré et al 2016; Global Carbon Budget 2016
Individual estimates from: Chevallier et al. (2005); Clarke et al. (2011); Jain et al. (2013); Kato et al. (2013); Krinner et al. (2005); Melton and Arora (2016); Oleson et al. (2013);
Peters et al. (2010); Reick et al. (2013); Rodenbeck et al. (2003); Sitch et al. (2003); Smith et al. (2014); Stocker et al. (2013); Tian et al. (2010); Woodward et al. (1995);
Zaehle and Friend (2010); Zhang et al. (2013). Full references provided in Le Quéré et al. (2016).Remaining uncertainty in the global carbon balance
Large uncertainties in the global carbon balance remain
and hinder independent verification of reported CO2 emissions
The remaining uncertainty is the carbon left after adding independent estimates for total emissions, the atmospheric
growth rate, and model-based estimates for the land and ocean carbon sinks
Source: Le Quéré et al 2016; Global Carbon Budget 2016Global carbon budget
The cumulative contributions to the global carbon budget from 1870
Figure concept from Shrink That Footprint
Source: CDIAC; NOAA-ESRL; Houghton et al 2012; Giglio et al 2013; Joos et al 2013; Khatiwala et al 2013;
Le Quéré et al 2016; Global Carbon Budget 2016Atmospheric concentration
The global CO2 concentration increased from ~277ppm in 1750 to 399ppm in 2015 (up 44%)
2016 will be the first full year with concentration above 400ppm
Globally averaged surface atmospheric CO2 concentration. Data from: NOAA-ESRL after 1980;
the Scripps Institution of Oceanography before 1980 (harmonised to recent data by adding 0.542ppm)
Source: NOAA-ESRL; Scripps Institution of Oceanography; Le Quéré et al 2016; Global Carbon Budget 2016Seasonal variation of atmospheric CO2 concentration
Weekly CO2 concentration measured at Mauna Loa will stay above 400ppm throughout 2016
An animation of this figure is available, and another on the drivers of the atmospheric growth
Source: Tans and Keeling (2016), NOAA-ESRL, Scripps Institution of OceanographyCarbon Quotas to Climate Stabilization
Carbon quota for a 66% chance to keep below 2°C
  The total remaining emissions from 2017 to keep global average temperature below 2°C
            (800GtCO2) will be used in around 20 years at current emission rates

Grey: Total CO2-only quota for 2°C with 66% chance. Green: Removed from CO2 only quota. Blue: Remaining CO2 quota.
                The remaining quotas are indicative and vary depending on definition and methodology
                                 Source: Peters et al 2015; Global Carbon Budget 2016
Carbon quota for a >66% chance to keep below 2°C
For a >66% chance to keep global average temperature below 2°C above pre-industrial levels,
society can emit 2900 billion tonnes CO2 from 1870 or about 800 billion tonnes CO2 from 2017
66%
800 Indicative range
450-1050GtCO2
GtCO2
2100
GtCO2
Historical emissions 1870-2016: 2100GtCO2. All values rounded to the nearest 50 GtCO2
The remaining quotas are indicative and vary depending on definition and methodology (Rogelj et al 2016).
Source: IPCC AR5 SYR (Table 2.2); Le Quéré et al 2016; Global Carbon Budget 2016Cumulative global CO2 emissions and temperature
Cumulative global CO2 emissions from fossil fuels, industry, and land use change and four
simplified future pathways compared to probability of exceeding different temperatures
The green boxes show the year that the exceedance budgets are exceeded assuming constant 2016 emission levels
The years are indicative and vary depending on definition and methodology
Source: Jackson et al 2015b; Global Carbon Budget 2016The emission pledges (INDCs) of the top-4 emitters
The emission pledges compared to different ways of sharing the remaining 2°C quota
Equity: Remaining quota shared by current population. Inertia: The remaining quota shared by current emissions.
Source: Peters et al 2015; Global Carbon Budget 2016The emission pledges (INDCs) of the top-4 emitters
The emission pledges from the US, EU, China, and India leave no room for other countries to
emit in a 2°C emission budget (66% chance)
Source: Peters et al 2015; Global Carbon Budget 2016Additional Papers
Negative emissions required for 2°C
To achieve net-negative emissions globally after 2050 requires deployment as early as 2020-2030
If negative emission technologies do not work at scale, society is locked into higher temperatures

                                   Source: Anderson & Peters 2016
Reducing uncertainty through Bayesian analysis
Bayesian optimization decreases the uncertainty in the land sink by 41%, ocean sink by 46%,
land-use change by 47%, while fossil fuel uncertainty is marginally improved
Source: Li et al 2016The Earth system response to negative emissions
Earth system models suggest significant weakening, even potential reversal, of the ocean and
land sinks under future low emission scenarios
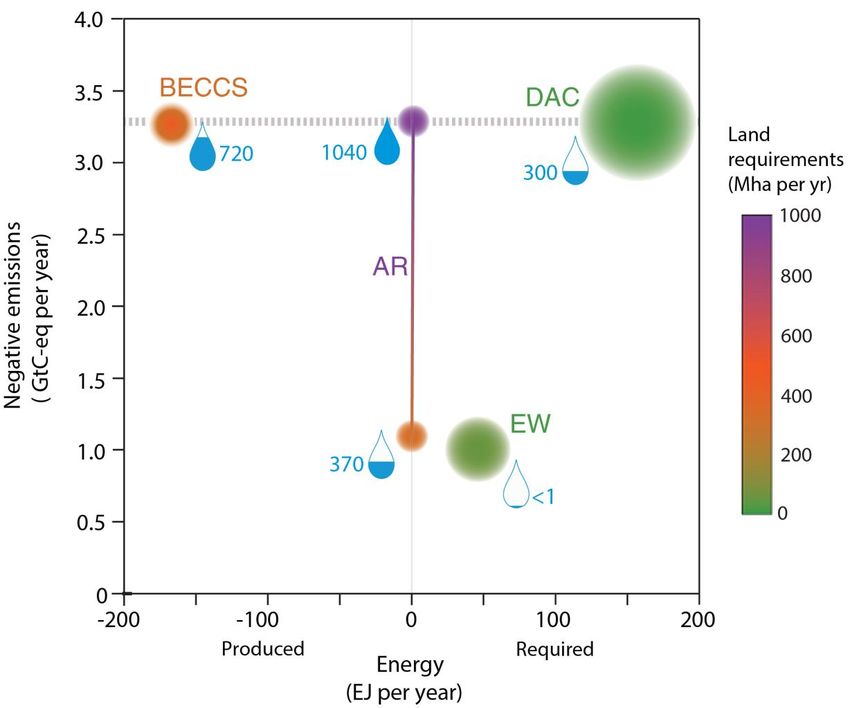
Source: Jones et al 2016Impact/limit summary for Negative Emission Technologies
The impacts and investment requirements of Negative Emissions Technologies
to limit warming to 2°C
Water requirement is shown as water droplets, with quantities in km3 per year.
All values are for the year 2100 except relative costs, which are for 2050
Source: Smith et al 2015; Global Carbon Budget 2016Infographic
References used in this presentation
Global Carbon Budget (2016) More information, data sources and data files at http://www.globalcarbonproject.org/carbonbudget/
Le Quéré, C., Andrew, R. M., Canadell, J. G., Sitch, S., Korsbakken, J. I., Peters, G. P., Manning, A. C., Boden, T. A., Tans, P. P., Houghton, R. A., Keeling, R. F., Alin, S., Andrews, O. D., Anthoni, P.,
    Barbero, L., Bopp, L., Chevallier, F., Chini, L. P., Ciais, P., Currie, K., Delire, C., Doney, S. C., Friedlingstein, P., Gkritzalis, T., Harris, I., Hauck, J., Haverd, V., Hoppema, M., Klein Goldewijk, K.,
    Jain, A. K., Kato, E., Körtzinger, A., Landschützer, P., Lefèvre, N., Lenton, A., Lienert, S., Lombardozzi, D., Melton, J. R., Metzl, N., Millero, F., Monteiro, P. M. S., Munro, D. R., Nabel, J. E. M. S.,
    Nakaoka, S., O’Brien, K., Olsen, A., Omar, A. M., Ono, T., Pierrot, D., Poulter, B., Rödenbeck, C., Salisbury, J., Schuster, U., Schwinger, J., Séférian, R., Skjelvan, I., Stocker, B. D., Sutton, A. J.,
    Takahashi, T., Tian, H., Tilbrook, B., van der Laan-Luijkx, I. T., van der Werf, G. R., Viovy, N., Walker, A. P., Wiltshire, A. J., and Zaehle, S. (2016) “Global Carbon Budget 2016”, Earth System
    Science Data, 8, 605-649, http://dx.doi.org/10.5194/essd-8-605-2016

Anderson K & Peters G (2016) “The trouble with negative emissions” Science, http://dx.doi.org/10.1126/science.aah4567
Andrew, RM, GP Peters & S Davis (2013) “Climate Policy and Dependence on Traded Carbon” Environmental Research Letters, http://dx.doi.org/10.1088/1748-9326/8/3/034011
Boden, T, G Marland & R Andres (2016) “Global, Regional, and National Fossil-Fuel CO2 Emissions in Trends”, Carbon Dioxide Information Analysis Center (CDIAC),
   http://cdiac.ornl.gov/trends/emis/meth_reg.html
BP, “BP Statistical Review of world energy” (2016), http://www.bp.com/en/global/corporate/energy-economics/statistical-review-of-world-energy.html
Dlugokencky, E & P Tans (2016) “Trends in Atmospheric Carbon Dioxide”, National Oceanic & Atmosphere Administration, Earth System Research Laboratory (NOAA-ESRL),
    http://www.esrl.noaa.gov/gmd/ccgg/trends/
Fuss S, Canadell JG, Peters GP, Tavonie M, Andrew RM, Ciais P, Jackson RB, Jones CD, Kraxner F, Nakicenovic N, Le Quéré C, Raupach MR, Sharifik A, Smith P, & Yamagata Y (2014) Betting on Negative
    Emissions. Nature Climate Change 4: 850-853. http://dx.doi.org/10.1038/nclimate2392
Giglio, L, JT Randerson & GR van der Werf (2014) “Analysis of daily, monthly, and annual burned area using the fourth-generation global fire emissions database (GFED4)”, Journal Geophysical Research
     Biogeosciences, http://onlinelibrary.wiley.com/doi/10.1002/jgrg.20042/abstract
Houghton, RA. JI House, J Pongratz, GR van der Werf, RS DeFries, MC Hansen, C Le Quéré & N Ramankutty (2012), “Carbon emissions from land use and land-cover change”,
   http://www.biogeosciences.net/9/5125/2012/bg-9-5125-2012.html, DOI:10.5194/bg-9-5125-2012
Jackson, RB, JG Canadell, C Le Quéré, RM Andrew, JI Korsbakken, GP Peters & N Nakicenovic (2015a), “Reaching peak emissions”, Nature Climate Change, http://dx.doi.org/10.1038/nclimate2892
Jackson, RB , P Friedlingstein, JG Canadell & RM Andrew (2015b) “Two or three degrees: CO2 emissions and global temperature http://folk.uio.no/roberan/docs/Jackson_etal2015-Bridgev45n2.pdf
Joos, F, R Roth, J Fuglestvedt, G Peters, I Enting, W von Bloh, V Brovkin, E Burke, M Eby, N Edwards, T Friedrich, T Frölicher, P Halloran, P Holden, C Jones, T Kleinen, F Mackenzie, K Matsumoto,
    M Meinshausen, G-K Plattner, A Reisinger, J Segschneider, G Shaffer, M Steinacher, K Strassmann, K Tanaka, A Timmermann & A Weaver (2013) “Carbon dioxide and climate impulse response
    functions for the computation of greenhouse gas metrics: a multi-model analysis“, Atmospheric Chemistry and Physics, http://www.atmos-chem-phys.net/13/2793/2013/acp-13-2793-2013.html
Khatiwala, S , T Tanhua, S Mikaloff Fletcher, M Gerber, S Doney, H Graven, N Gruber, G McKinley, A Murata, A Rios & C Sabine (2013), “Global ocean storage of anthropogenic carbon”, Biogeosciences,
   http://www.biogeosciences.net/10/2169/2013/bg-10-2169-2013.html
Peters, GP, J Minx, C Weber & O Edenhofer (2011) “Growth in emission transfers via international trade from 1990 to 2008”, Proceedings of the National Academy of Sciences,
    www.pnas.org/content/108/21/8903
Peters, GP, SJ Davis & RM Andrew (2012) “A synthesis of carbon in international trade”, Biogeosciences, http://www.biogeosciences.net/9/3247/2012/bg-9-3247-2012.html
Smith, P, SJ Davis, F Creutzig, S Fuss, J Minx, B Gabrielle, E Kato, RB Jackson, A Cowie, E Kriegler, DP van Vuuren, J Rogelj, P Ciais, J Milne, JG Canadell, D McCollum, GP Peters, RA Andrew, V Krey, G
    Shrestha, P Friedlingstein, T Gasser, A Grübler, WK Heidug, M Jonas, CD Jones, F Kraxner, E Littleton, J Lowe, JR Moreira, N Nakicenovic, M Obersteiner, A Patwardhan, M Rogner, E Rubin, A Sharifi, A
    Torvanger, Y Yamagata, J Edmonds & C Yongsung (2015). “Biophysical and economic limits to negative CO2 emissions”, Nature Climate Change (online); http://dx.doi.org/10.1038/nclimate2870
UN (2015) United Nations Statistics Division http://unstats.un.org/unsd/default.htm
Acknowledgements
We thank the many funding agencies that supported this release:
European Commission
Australia: National Environmental Science Program – ESCC hub
The work presented in the Global Carbon Budget 2016 France: BNP Paribas Foundation
has been possible thanks to the contributions of Institut National des Sciences de l'Univers
hundreds of people involved in observational networks, Institut Paul Emile Victor
modeling, and synthesis efforts. Institut de recherche pour le développement
Germany: Federal Ministry of Education and Research
We thank the institutions and agencies that provide Research Foundation’s Emmy Noether Program
support for individuals and funding that enable the Max Planck Society
collaborative effort of bringing all components together Helmholtz PostDoc Programme
in the carbon budget effort. Japan: Ministry of Agriculture, Forestry and Fisheries
Ministry of Environment
We also thank the sponsors of the GCP and GCP support New Zealand: National Institute of Water and Atmospheric Research
and liaison offices. Norway: Research Council
Environment Agency
Netherlands Research Fund – Flanders
South Africa: Council for Scientific and Industrial Research
UK: Natural Environment Research Council
Newton Fund
US: NASA
Department of Agriculture
Department of Energy
Department of Commerce
National Science FoundationLicense
Attribution-NonCommercial-ShareAlike 4.0 International (CC BY-NC-SA 4.0)
This deed highlights only some of the key features and terms of the actual license. It is not a license and has no legal value. You should carefully review all of the terms
and conditions of the actual license before using the licensed material. Creative Commons is not a law firm and does not provide legal services. Distributing, displaying,
or linking to this deed or the license that it summarizes does not create a lawyer-client or any other relationship. This is a human-readable summary of (and not a
substitute for) the license.
You are free to:
Share — copy and redistribute the material in any medium or format
Adapt — remix, transform, and build upon the material
The licensor cannot revoke these freedoms as long as you follow the license terms.
Under the following terms:
Attribution — You must give appropriate credit, provide a link to the license, and indicate if changes were made. You may do so in any reasonable manner, but not in
any way that suggests the licensor endorses you or your use. What does "Attribute this work" mean? The page you came from contained embedded licensing metadata,
including how the creator wishes to be attributed for re-use. You can use the HTML here to cite the work. Doing so will also include metadata on your page so that
others can find the original work as well.
NonCommercial — You may not use the material for commercial purposes.
ShareAlike — If you remix, transform, or build upon the material, you must distribute your contributions under the same license as the original.
No additional restrictions — You may not apply legal terms or technological measures that legally restrict others from doing anything the license permits.
You do not have to comply with the license for elements of the material in the public domain or where your use is permitted by an applicable exception or limitation.
No warranties are given. The license may not give you all of the permissions necessary for your intended use. For example, other rights such as publicity, privacy, or
moral rights may limit how you use the material.You can also read