TRANSPORT EMISSIONS: DRIVING DOWN CAR POLLUTION IN CITIES - FACTSHEET - CLIMATECOUNCIL.ORG.AU
←
→
Page content transcription
If your browser does not render page correctly, please read the page content below
FACTSHEET

TRANSPORT
EMISSIONS:
DRIVING DOWN CAR
POLLUTION IN CITIES

CLIMATECOUNCIL.ORG.AU
I   FACTSHEET:
    TRANSPORT EMISSIONS: DRIVING DOWN CAR POLLUTION IN CITIES

    KEY FINDINGS

    ›› Transport is Australia’s third largest    ›› Key climate solutions for transport
       source of greenhouse gas emissions,          involve:
       with the highest rate of growth.
                                                   -- providing viable alternatives to driving,
    ›› Cars are responsible for roughly half          such as expanding access to reliable,
       of Australia’s transport emissions.            comfortable public transport.
       Australian cars emit about the same as
       Queensland’s entire electricity supply.     -- electrifying and powering cars, buses,
                                                      trains and trams with 100% renewable
    ›› An international scorecard ranked              energy.
       Australia second-worst for transport
       energy efficiency.                          -- adopting stringent, mandatory
                                                      greenhouse gas emissions standards
                                                      for cars and other vehicles.

                                                                                     climatecouncil.org.au
II    FACTSHEET:
      TRANSPORT EMISSIONS: DRIVING DOWN CAR POLLUTION IN CITIES

     CONTENTS

     Key Findings...................................................................................................................................................................................... I

     Introduction.......................................................................................................................................................................................1

     How Does Australia Compare on Transport Emissions? ................................................................................................... 3

     Solutions to Reduce Transport Emissions............................................................................................................................... 5

     Shifting Out of Cars and Onto Public Transport................................................................................................................... 6

     100% Renewable Powered Electric Vehicles............................................................................................................................ 8

     Mandatory Emissions Standards.............................................................................................................................................. 10

     Case studies - Cities Sustainable Transport...........................................................................................................................11

     References........................................................................................................................................................................................16

     Image Credits................................................................................................................................................................................. 19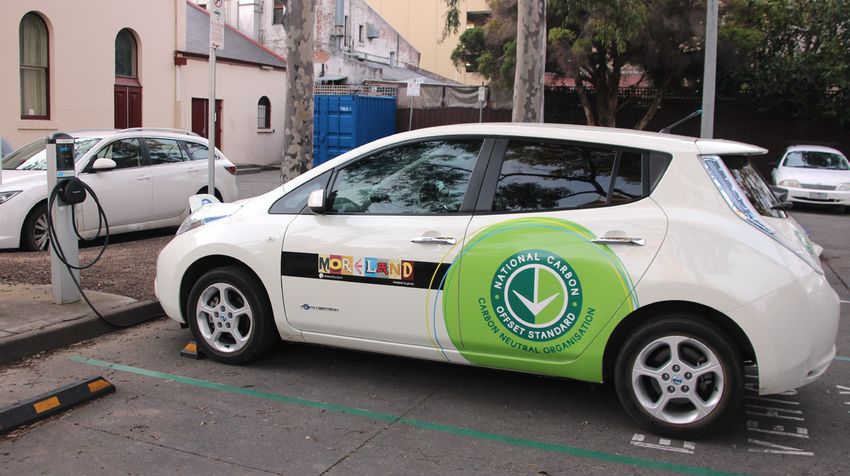
1   FACTSHEET:
    TRANSPORT EMISSIONS: DRIVING DOWN CAR POLLUTION IN CITIES

      FACTSHEET

    Transport Emissions:
    Driving Down Car
    Pollution in Cities
    INTRODUCTION                                    Cars are responsible for roughly half of all
                                                    transport emissions (Australian Government
    Cars are a major source of                      2017b; Figure 1). Collectively, Australian cars
    greenhouse gas pollution in                     emit roughly the same per year (43MtCO2e)
    Australian cities.                              as Queensland’s entire coal and gas fired
                                                    electricity supply (Australian Government
    Transport is Australia’s third largest source   2017b; Queensland Renewable Energy
    of greenhouse gas emissions (96MtCO2e           Expert Panel 2016).
    per year, 17% of total emissions) (Australian
    Government 2017a).                              In ratifying the Paris Agreement, Australia
                                                    committed to rapidly reduce our carbon
    Transport emissions have grown more than        emissions, by reducing emissions by 26-
    any other sector, increasing nearly 60% since   28 percent on 2005 levels by 2030 and
    1990 (Australian Government 2017a).             transitioning to zero emissions before 2050.
                                                    A number of state governments have also
                                                    committed to zero net emissions targets by
                                                    2050. Despite these pledges to tackle climate
                                                    change, Australia’s emissions continue to
                                                    rise, particularly from the transport sector.

    Transport is Australia’s
    third largest emitter,
    highest emissions growth.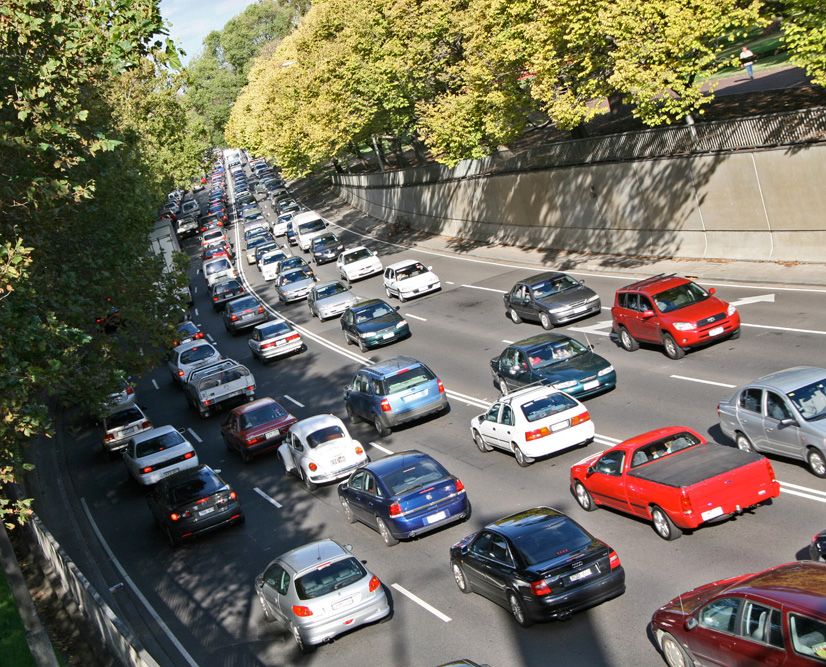
2   FACTSHEET:
    TRANSPORT EMISSIONS: DRIVING DOWN CAR POLLUTION IN CITIES

    Collectively, cars in
    Australia emit the same as
    Queensland’s entire fossil-
    fuelled electricity supply.

    Figure 1: Cars, the major source of transport emissions.
3   FACTSHEET:
    TRANSPORT EMISSIONS: DRIVING DOWN CAR POLLUTION IN CITIES

    HOW DOES AUSTRALIA COMPARE ON TRANSPORT EMISSIONS?

    Australia lags well behind the           An international scorecard comparing 23 of
    global pack on tackling transport        the largest energy-using countries, ranked
    emissions. Australia’s per capita        Australia second-worst for transport energy
    transport emissions are 45% higher       efficiency due to:
    than the OECD average (IEA 2016).
                                             ›› High emitting cars, and the lack of
                                                greenhouse gas emissions standards in
                                                place for cars or heavy vehicles.

                                             ›› The relatively high distances travelled
                                                by car per person, compared to similar
                                                countries.

                                             ›› Low use of public transport (12% of trips).

                                             ›› Low ratio of spending on public transport
                                                compared to roads (ACEEE 2016; Figure 1).

                              TRANSPORT ENERGY EFFICIENCY SCORECARD

              1ST            India                       20TH                   Taiwan

               2ND           Italy                       21ST                   Indonesia

               3RD           Japan                       22ND                   Australia

               4TH           China                       23RD                   Saudi Arabia

               5TH           France

    Source: ACEEE 2016.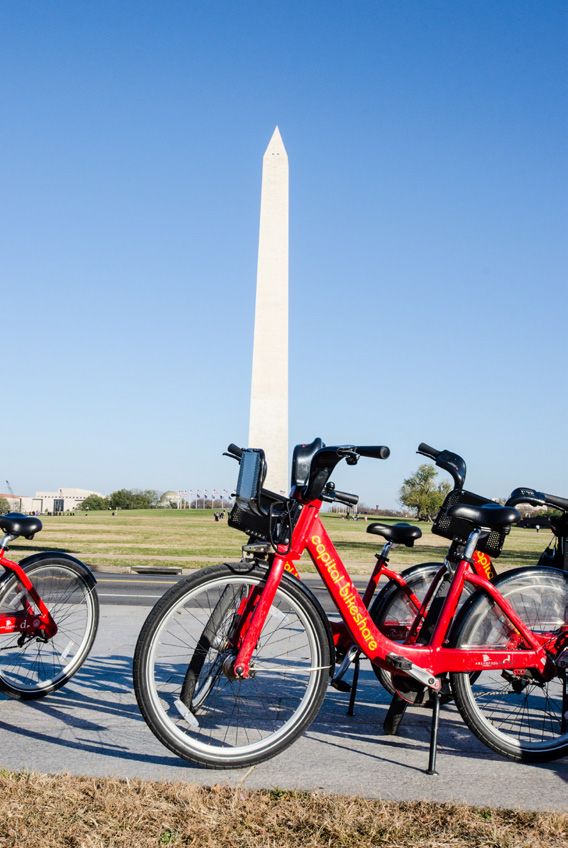
4   FACTSHEET:
    TRANSPORT EMISSIONS: DRIVING DOWN CAR POLLUTION IN CITIES

    Spending money on new roads encourages
    more people to drive and worsens congestion
    (Beck and Bliemer 2015). Australian
    infrastructure data indicates that four dollars
    are spent on roads for every dollar spent on
    rail (Table 1).

    Table 1: 2015-16 Value of engineering construction work by the private sector for ($ billion).

                                                           Roads and Bridges                     Rail

     By the private sector for the public sector           7.48                                  2.32

     By the private sector for the private sector          4.60                                  1.07

     By the public sector for the public sector            3.93                                  0.24

     Total                                                 16.01 (82%)                           3.63 (18%)

    Source: Department of Infrastructure and Regional Development 2016.
5   FACTSHEET:
    TRANSPORT EMISSIONS: DRIVING DOWN CAR POLLUTION IN CITIES

    SOLUTIONS TO REDUCE TRANSPORT EMISSIONS

    Key climate solutions to drive down
    transport emissions involve:

    ›› providing viable alternatives to driving,
       such as expanding access to reliable,
       comfortable public transport, cycling and
       walking alternatives.

    ›› electrifying and powering cars, buses,
       trains and trams with 100% renewable
       energy.

    ›› adopting stringent, mandatory
       greenhouse gas emissions standards for
       cars and other vehicles (and strengthening
       these over time).
6 FACTSHEET:
TRANSPORT EMISSIONS: DRIVING DOWN CAR POLLUTION IN CITIES
SHIFTING OUT OF CARS AND ONTO PUBLIC TRANSPORT
In most large economies, public Research has found a ‘high shift’ approach
transport provides a much greater to transport spending – where investment is
share of transport requirements directed towards public and active transport
(as high as 72% in China) than in and away from roads and parking – found
Australia where buses, trains, trams equivalent mobility can be achieved while
and ferries account for around 10% reducing overall public and private spending
of distance travelled (ACEEE 2016; on transport, and dramatically reducing
BITRE 2014). greenhouse gas emissions (Replogle and
Fulton 2014).
Travel on all forms of public transport involves
fewer emissions per person per kilometre Providing reliable, accessible public transport
than the average Australian car (Table 2). infrastructure (relevant to people’s needs) can
drive significant numbers of people to switch
Expanding access to high quality public from driving to taking the tram, train or bus
transport is a proven way to reduce car use (e.g., Figure 2). Rail based transport is known
and its associated emissions. People who to have the greatest impact on reducing car
live in communities with accessible public use (McIntosh et al 2014).
transport tend to own fewer vehicles, drive
less and rely more on public transport
than other areas (Litman 2010). Rail based
transport (trains and light rail/trams) has the
greatest impact on reducing car dependence
(McIntosh et al 2014).
Table 2: Emissions for different forms of transport.
Transport Average emissions per kilometre (gCO2 /km)
Metro train systems 3-21 (per person)1
Light rail 4-22 (per person)1
Bus rapid transport systems 14-22 (per person)1
Average car sold in 2015 1842
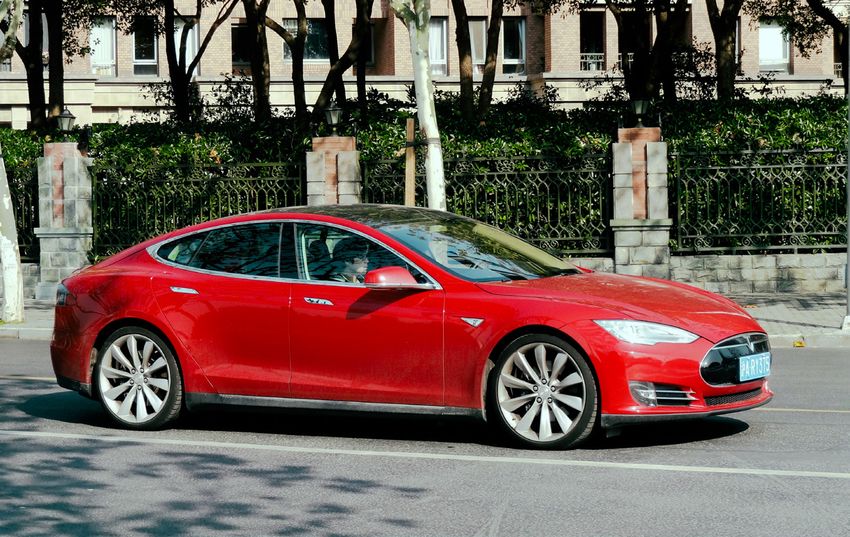
1 Sims et al 2014. 2 National Transport Commission 2016.7 FACTSHEET:
TRANSPORT EMISSIONS: DRIVING DOWN CAR POLLUTION IN CITIES
Emissions from public transport can be Directing investment
reduced even further if operators move
to electric vehicles (trains, trams and to new public transport
buses) powered by 100% renewable energy.
For example, Canberra’s Capital Metro can drive a high shift
Light Rail project will be fully powered
by renewable electricity, as a result of the away from car use and
Australian Capital Territory Government’s
100% renewable energy target (ACT dramatically reduce
Government 2015). Similarly, Melbourne’s
trams will be powered by two new large- greenhouse gas
scale solar plants in regional Victoria –
Bannerton Solar Park and Numurkah Solar emissions.
Farm (Herald Sun 2017).
Figure 2: Melbourne tram.8 FACTSHEET:
TRANSPORT EMISSIONS: DRIVING DOWN CAR POLLUTION IN CITIES
100% RENEWABLE POWERED ELECTRIC VEHICLES
Electrifying our transport, and In addition, charging an electric vehicle with
powering it by 100% renewable renewable energy - be it rooftop solar panels
energy is critical for positioning or 100% GreenPower purchased from an
Australia on the road to zero electricity retailer - is substantially cheaper
emissions by 2050 (ClimateWorks than the cost of fuel for an equivalent petrol
2014). car (AECOM 2015).
Electric cars run on electricity and plug-in The uptake of electric vehicles in Australia is
rechargeable batteries. Globally, the rollout being held back by the lack of policy support
of electric cars is picking up speed, going or incentives, higher upfront cost, choice of
from almost zero cars on the road in 2010, available electric vehicles for sale in Australia,
to passing two million electric cars in 2016. and the availability of public vehicle-
China, the United States, the Netherlands charging infrastructure (Choice 2014; Car
and Norway dominate the electric vehicle Advice 2015; Business Insider 2016; Figure 3).
market (IEA 2017). Falling battery costs
together with supportive government
policies is driving global growth in electric
vehicles (The ICCT 2015). Globally there are more
In Norway, nearly a quarter of cars sold than a million electric
are now electric (IEA 2016). Contrast this
to Australia, where electric vehicles make cars on the road.
up 0.08% of new vehicles sold (National
Transport Commission 2016).
Most electric cars can comfortably cover the
The source of electricity for electric cars average commuting needs (work, shopping,
charging is critical to reducing emissions school pick-ups) for a city driver.
(this is particularly a problem given
Australia’s coal dominated electricity grid).
Electric vehicles powered entirely on
renewable energy have negligible emissions
(as low as 6gCO2/km), compared to an
average new car (184gCO2/km) (The ICCT
2015; National Transport Commission 2016).9 FACTSHEET:
TRANSPORT EMISSIONS: DRIVING DOWN CAR POLLUTION IN CITIES
State governments and industry in Australia
are starting to role out electric vehicle
charging networks, such as the RAC (2016)
Electric Highway between Perth and
Augusta, and Tesla’s (2016) charging stations
along the route between Melbourne, Sydney
and Brisbane. However such charging
infrastructure is well below that available
overseas.
Electric vehicles powered
entirely on renewable energy
are practically zero emissions.
Figure 3: Electric cars run on electricity and plug-in rechargeable batteries.10 FACTSHEET:
TRANSPORT EMISSIONS: DRIVING DOWN CAR POLLUTION IN CITIES
MANDATORY EMISSIONS STANDARDS
Australia is among a small minority The sooner mandatory emissions standards
of countries without mandatory are introduced, and rapidly strengthened,
greenhouse gas emissions standards the greater the impact. If strict standards
in place for cars, despite this being are introduced, Australia can prevent up to
identified as a key action by the 65 MtCO2 of emissions by 2030 (Australian
Federal Government to meet its Government 2017c). Urgency is key.
2030 emissions targets (Australian
Government 2016d). Mandatory emissions standards have wider
benefits, reducing fuel bills for car owners,
Mandatory greenhouse gas emissions saving an estimated $8,500 over a vehicle’s
standards for cars now cover 80% of the lifetime (CCA 2014).
global car market (including the United
States, Europe, Japan, Korea, China, India,
Canada and Mexico) (CCA 2014).
The lack of mandatory emissions standards
here has meant that in 2015, new cars sold
in Australia emitted 43% more CO2/km on
average compared with new cars sold in
Europe (National Transport Commission
2016).
Mandatory greenhouse gas
emissions standards cover 80%
of the global car market, but
are not in place in Australia.11 FACTSHEET:
TRANSPORT EMISSIONS: DRIVING DOWN CAR POLLUTION IN CITIES
CASE STUDIES - CITIES SUSTAINABLE TRANSPORT
International Case Study 13% walk and 4% ride (Alliance for Biking
and Walking 2016). These shares are
Washington, D.C. - transport targets significantly higher than the average mode
and actions shares for Australian cities - 14% by public
transport, 3.8% walk and 1.3% ride on average
Washington DC (population 643,000) is the (Australian Government 2013).
capital city of the United States and its 24th
largest city (Office of the Mayor 2016). In
2012, the city embarked on an ambitious and
comprehensive plan “Sustainable DC”, to
tackle the city’s key sustainability challenges Figure 4: Washington DC Capital bike share scheme.
of jobs and economic growth; health and
wellness; equity and diversity; and climate
and environment (Sustainable DC 2016).
The plan includes a target for 50% of city’s
power use (both council operations and the
community) to come from renewable energy
sources by 2032.
Transportation was identified as one of
the Sustainable DC plan’s seven key areas.
Specific targets were set for trips within the
city by 2032 - with car travel to decrease to
less than 25% of trips, public transport trips
to increase to 50%, and biking and walking
to increase to 25%. The goals and targets
were underpinned by a detailed action plan
(Table 3).
As a result of its actions, 2016 saw
Washington DC become the equal first out
of 50 US cities (tied with Boston) for the
proportion of commuters walking or cycling,
and second best (after New York) when public
transport was included (Alliance for Biking
and Walking 2016). The city was one of two
major cities (with Portland, Oregon) to make
a significant gain in the share of commuters
biking and walking (Alliance for Biking and
Walking 2016).
Nearly 39% of Washington DC residents
now commute by public transport, nearly12 FACTSHEET:
TRANSPORT EMISSIONS: DRIVING DOWN CAR POLLUTION IN CITIES
Table 3: Sustainable DCs Transportation Goals, Targets and Actions.
Goals Targets Actions
Improve connectivity Increase use of public ›› Complete 60 kilometres of tram networks
and accessibility through transit to 50% of all
›› Improve transit connections to employment and activity
efficient, integrated, commuter trips
centers from underserved areas
and affordable transit
systems ›› Define and secure permanent funding for transit planning
and improvements
›› Design transit systems for resilience to extreme weather
events
Expand provision of safe, Increase biking and ›› Develop a citywide, 100-mile bicycle lane network
secure infrastructure for walking to 25% of all
›› Expand the Capital Bikeshare program by 200 stations
cyclists and pedestrians commuter trips
›› Partner with community organizations to deliver bike and
pedestrian safety education
›› Collect data to improve understanding of cyclist and
pedestrian travel patterns
›› Program crosswalks and traffic lights for improved safety
and convenience of pedestrians and cyclists
Reduce traffic Reduce commuter trips ›› Implement an expanded Performance-Based Parking
congestion to improve made by car or taxi to program
mobility 25%
›› Expand car-sharing programs to low-income residents
using financial tools
›› Encourage private businesses to offer incentives for
employee travel by transit, walking, or biking
›› Encourage and promote telecommuting and alternative
work schedules for employees
›› Study the feasibility of a regional congestion fee for travel
during peak hours
Improve air quality along Eliminate all “unhealthy” ›› Strictly limit idling engines.
major transportation air quality index days,
›› Require District Government, and encourage private
routes including “unhealthy for
businesses, to purchase clean fuel, low-emission fleet
sensitive groups”
vehicles
›› Expand electric vehicle charging infrastructure throughout
the city
›› Offer incentives to avoid driving and other emission-
generating activities on predicted Code Red and Orange air
quality days
›› Track and report mileage data from clean fuel, low-emission,
and electric vehicles
Source: Sustainable DC 2016.13 FACTSHEET:
TRANSPORT EMISSIONS: DRIVING DOWN CAR POLLUTION IN CITIES
CASE STUDIES - CITIES SUSTAINABLE TRANSPORT
Australian Case Study 1 vehicle charging station, it now has three
charging points throughout the city, and
Moreland, Victoria - integrated transport is integrating electric cars into its council
strategy fleet (Figure 5). The council has strategies
to encourage walking, cycling and public
The city of Moreland in inner urban transport in Moreland (City of Moreland 2017).
Melbourne has developed an integrated
strategy for transport which aims to achieve
a shift to more environmentally sustainable
travel behaviour; support transport access
for all parts of the community; and improve City of Moreland
safety and support development around
transport hubs (with access to trains, trams, installed Victoria’s
bicycle and walking paths) in Moreland.
first electric vehicle
Moreland supports car sharing services
for residents who don’t own a car. In 2012, charging station.
the council installed Victoria’s first electric
Figure 5: One of Moreland City Council’s electric vehicle charging points.14 FACTSHEET:
TRANSPORT EMISSIONS: DRIVING DOWN CAR POLLUTION IN CITIES
CASE STUDIES - CITIES SUSTAINABLE TRANSPORT
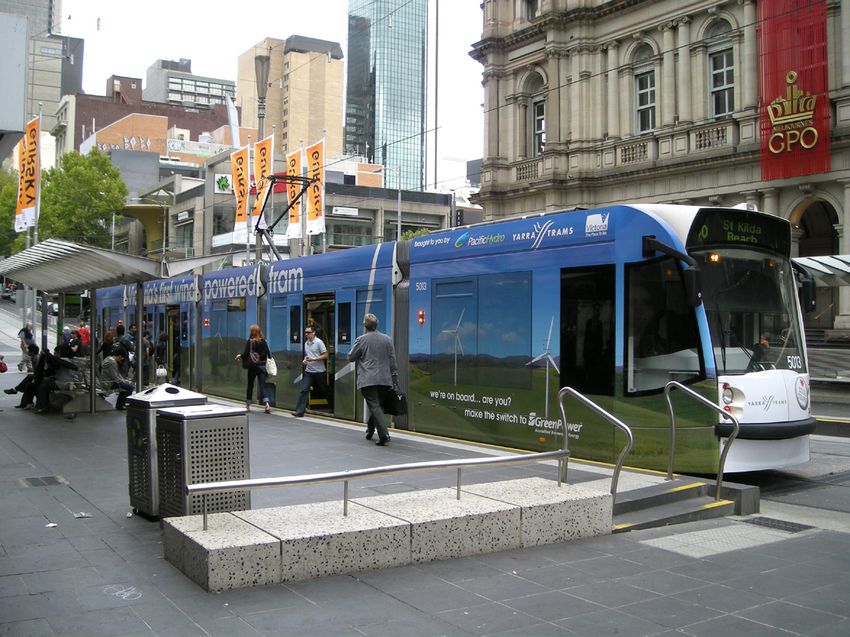
Australian Case Study 2 Since opening in July 2014, the Gold
Coast Light Rail, dubbed “the G”, now has
Gold Coast, Queensland – public transport more passenger trips per month than the
permanent population of the Gold Coast.
Expanding access to high quality public In 2016, patronage reached almost 640,000
transport is a proven way to reduce car use passengers a month – far exceeding
and its associated emissions. People who expectations - and continues to grow (Gold
live in communities with accessible public Linq 2016). Further stages of the project are
transport tend to own fewer vehicles and in development to be completed prior to the
drive less. Commonwealth Games in 2018.
The City of Gold Coast funded a new In addition to the benefits of improved public
13-kilometre light rail project comprising transport access for Gold Coast residents and
16 stops from Broadbeach to Gold Coast visitors, research has found that the new light
University Hospital (Figure 19). The project rail has increased property values near the
was funded by the City of Gold Coast project (Bourke M 2017).
in conjunction with state and federal
governments. The council recoups its
funding for the project through rates and a
public transport levy (Bourke M 2017).
Figure 6: Gold Coast Light Rail.15 FACTSHEET:
TRANSPORT EMISSIONS: DRIVING DOWN CAR POLLUTION IN CITIES
CASE STUDIES - CITIES SUSTAINABLE TRANSPORT
Australian Case Study 3
City of Hobart - electric vehicle charging
and bicycle sharing
The City of Hobart (2016) has installed
electric vehicle charging in the Hobart
Central Carpark, is installing a further
chargepoint at the Argyle Street Carpark, and
is investigating the further roll-out of electric
vehicle charging stations.
Hobart City Council (City of Hobart 2017)
also supports “Artbikes” - a series of free
bicycles available to ride around Hobart, and
bike parking facilities at key cultural and art
institutions. The bicycles come with free
helmets, locks and a map (Figure 7).
Figure 7: “Charlie the Bike Rack” Hobart City Artbikes.16 FACTSHEET:
TRANSPORT EMISSIONS: DRIVING DOWN CAR POLLUTION IN CITIES
REFERENCES
ABS (Australian Bureau of Statistics) (2015) 9208.0 - Survey BITRE (2014) Yearbook 2014 Australian Infrastructure
of Motor Vehicle Use, Australia, 12 months ended 31 Statistics. Accessed at http://www.bitre.gov.au/
October 2014. Accessed at http://www.abs.gov.au/ausstats/ publications/2014/files/BITRE_YEARBOOK_2014_Full_
abs@.nsf/PrimaryMainFeatures/9208.0?OpenDocument. Report.pdf.
ACEEE (American Council for an Energy Efficient BITRE (2015) Australia’s commuting distance: cities and
Economy) (2016) The 2016 International Energy Efficiency regions. Accessed at https://bitre.gov.au/publications/2015/
Scorecard. Accessed at http://aceee.org/research-report/ files/is_073.pdf.
e1602.
Bourke M (2017) Why Gold Coast light rail was worth
Adelaide City Council (2013) Tindo The World’s First Solar it (its about more than patronage). Accessed at https://
Electric Bus. Accessed at http://www.adelaidecitycouncil. theconversation.com/why-gold-coast-light-rail-was-
com/assets/acc/Environment/energy/docs/tindo_fact_ worth-it-its-about-more-than-patronage-78190?sa=google
sheet.pdf. &sq=gold+coast+light+rail&sr=1.
AECOM (2011) Impact of Electric Vehicles and Natural Gas Business Insider (2016) Why Australian dealers don’t want
Vehicles on the Energy Markets. Accessed at http://www. to sell electric cars. Accessed at http://www.businessinsider.
aemc.gov.au/Media/docs/AECOM%20Initial%20Advice- com.au/why-australian-dealers-dont-want-to-sell-electric-
8fff41dd-f3ea-469d-9966-e50ba2a8d17b-0.pdf. cars-2016-1.
ACT Government (2015) Clean, sustainable light rail to run Car Advice (2015) 2015 Toyota Prius C becomes Australia’s
on 100% renewable energy. Accessed at http://www.cmd. most affordable hybrid car. Accessed at http://www.
act.gov.au/open_government/inform/act_government_ caradvice.com.au/335660/2015-toyota-prius-c-becomes-
media_releases/corbell/2015/clean,-sustainable-light-rail- australias-most-affordable-hybrid-car/.
to-run-on-100-renewable-energy.
CCA (Climate Change Authority) (2014) Light Vehicle
Alliance for Biking and Walking (2016) Bicycling and Emissions Standards for Australia. Research Report.
Walking in the United States. 2016 Benchmarking Report. Accessed at http://climatechangeauthority.gov.au/files/
Accessed at http://www.bikewalkalliance.org/storage/ files/Light%20Vehicle%20Report/Lightvehiclesreport.pdf.
documents/reports/2016benchmarkingreport_web.pdf.
Choice (2014) Green Car Buying Guide. Accessed at https://
Australian Government (2013) Walking, Riding and Access www.choice.com.au/transport/cars/eco-friendly/buying-
to Public Transport: Supporting Active Travel in Australian guides/green-cars.
Communities. Accessed at https://infrastructure.gov.au/
City of Hobart (2016) AGENDA Finance Committee Meeting.
infrastructure/pab/active_transport/files/infra1874_mcu_
active_travel_report_final.pdf. City of Hobart (2017) Artbikes - Bike Hubs. Accessed at
http://www.hobartcity.com.au/community/arts_and_
Australian Government (2015) Australia’s emissions
culture/public_art/artbikes.
projections 2014–15. Accessed at https://www.
environment.gov.au/system/files/resources/f4bdfc0e- City of Moreland (2017) Sustainable transport. Accessed
9a05-4c0b-bb04-e628ba4b12fd/files/australias-emissions- at http://www.moreland.vic.gov.au/environment-bins/
projections-2014-15.pdf. environment/sustainable-transport/.
Australian Government (2017a) Quarterly Update of Clean Energy Regulator (2016) Corporate emissions
Australia’s National Greenhouse Gas Inventory: March 2017. and energy data 2014-15. Accessed at http://www.
Accessed at http://www.environment.gov.au/system/files/ cleanenergyregulator.gov.au/NGER/National%20
resources/6cc33ded-14aa-4ddc-b298-b6ffe42f94a1/files/ greenhouse%20and%20energy%20reporting%20
nggi-quarterly-update-march-2017.pdf. data/Corporate%20emissions%20and%20energy%20
data/corporate-emissions-and-energy-data-2014-
Australian Government (2017b) National Inventory Report
15#Greenhouse-and-energy-information-by-controlling-
2015. Accessed at http://www.environment.gov.au/system/
corporation-201415.
files/resources/97197b1e-07b9-4e6f-a08e-0f6145e681e5/
files/national-inventory-report-2015-vol1.pdf. Clean Technica (2016) India’s Largest Subway System
Will Fully Switch To Solar Next Year. Accessed at https://
Australian Government (2017c) Review of climate change
cleantechnica.com/2016/12/23/indias-largest-subway-
policies. Discussion Paper. Accessed at https://www.
system-will-fully-switch-solar-next-year/.
environment.gov.au/system/files/consultations/dcb346e1-
f0c0-4ba4-aa83-047c062b4bbc/files/discussion-paper- ClimateWorks (2014) Pathways to Deep Decarbonisation
review-of-climate-change-policies-2017.pdf. in 2050. How Australia can prosper in a low carbon world.
Accessed at http://climateworks.com.au/sites/default/
Beck, M and Bliemer, M (2015) Do more roads really
files/documents/publications/climateworks_pdd2050_
mean less congestion for commuters. The Conversation.
technicalreport_20140923.pdf.
Accessed at https://theconversation.com/do-more-roads-
really-mean-less-congestion-for-commuters-39508.17 FACTSHEET:
TRANSPORT EMISSIONS: DRIVING DOWN CAR POLLUTION IN CITIES
CSIRO (2016) With the introduction of 100 per cent electric Litman (2010) Raise My Taxes, Please! Evaluating
cars to its national fleet, CSIRO is taking further steps to Household Savings From High Quality Public Transit
reduce its carbon footprint. Accessed at http://www.csiro. Service. Victoria Transport Policy Institute. Accessed at
au/en/News/News-releases/2016/CSIRO-goes-electric- http://www.vtpi.org/raisetaxes.pdf.
with-green-fleet.
McIntosh J, Trubka R, Kenworthy J and Newman P
Department of Infrastructure and Regional Development (2014) The role of urban form and transit in city car
(2016) Yearbook 2016 Australian infrastructure statistics. dependence: Analysis of 26 global cities from 1960 to
Accessed at https://bitre.gov.au/publications/2016/files/ 2000. Transportation Research Part D: Transport and
BITRE_yearbook_2016_statistics_full_report.pdf. Environment Volume 33, December 2014, Pages 95-110.
Deutsche Bahn (2016a) Climate protection at Deutsche Mortimore A (2015) Australia’s weaker emissions
Bahn. Accessed at http://www.deutschebahn.com/en/ standards allow car makers to ‘dump’ polluting cars. The
sustainability/environmental_pioneer/db_and_climate_ Conversation. Accessed at https://theconversation.com/
protection.html. australias-weaker-emissions-standards-allow-car-makers-
to-dump-polluting-cars-48172.
Deutsche Bahn (2016b) Environment Plus:
environmentally-friendly travel using energy from 100% National Transport Commission (2016) Carbon Dioxide
renewable sources (green power). Accessed at https://www. Emissions Intensity for New Australian Light Vehicles
bahn.com/i/view/GBR/en/prices/germany/umwelt_plus. 2015. Accessed at https://www.ntc.gov.au/Media/Reports/
shtml?time=now. (C19AD85F-32EC-4605-886F-8448F1CB00A2).pdf.
Gold Coast Bulletin (2015) Exclusive figures show Gold Office of the Mayor (2016) Washington, DC Population Now
Coast light rail’s first year a success. Accessed at http:// Highest in 40 Years. Accessed at https://mayor.dc.gov/
www.goldcoastbulletin.com.au/news/traffic-reports/link- release/washington-dc-population-now-highest-40-years.
hits-the-g-spot-for-gold-coast-as-exclusive-figures-show-
Queensland Renewable Energy Expert Panel (2016) Credible
light-rails-first-year-a-success/news-story/0f63dbf516307ef
pathways to a 50% renewable energy target for Queensland.
117b1fa815b2dd0a1.
Draft Report. Accessed at http://www.qldrepanel.com.au/
Gold Linq (2016) G: That’s Successful. Accessed at http:// draft-report.
www.goldlinq.com.au/news-and-media/g-that-s-
RAC (2016) The RAC Electric Highway. Accessed at http://
successful.
electrichighway.rac.com.au/.
Hass-Klau, C., G. Crampton and R. Benjari. 2004. Economic
RenewEconomy (2016) NSW tenders for renewable energy
impact of light rail: the results of 15 urban areas in France,
projects to power Sydney Metro rail. Accessed at http://
Germany, UK and North America. Environmental and
reneweconomy.com.au/nsw-tenders-for-renewable-
Transport Planning, Brighton, 220pp. ISBN 9780951962091.
energy-projects-to-power-sydney-metro-rail-63247/.
Herald Sun (2017) Victorian Government to build
Replogle M and Fulton L (2014) A Global High Shift Scenario.
two solar plants to fuel Melbourne’s tram network.
Impacts And Potential For More Public Transport, Walking,
Accessed at http://www.heraldsun.com.au/news/
And Cycling With Lower Car Use. Accessed at https://www.
victoria/victorian-government-to-build-two-solar-
itdp.org/wp-content/uploads/2014/09/A-Global-High-
plants-to-fuel-melbournes-tram-network/news-story/
Shift-Scenario_V2_WEB.pdf.
bb28f0eeca6911165d70ecb863fc9959.
Siemens (2016) Gothenburg’s 100% renewable electricity
IEA (2016) CO2 emissions from fuel combustion.
bus route with Siemens technology. Accessed at http://
Highlights (2016 edition). Accessed at https://www.
www.siemens.com/press/en/feature/2013/infrastructure-
iea.org/publications/freepublications/publication/
cities/rail-systems/2013-07-ebus.php?content[]=MO.
CO2EmissionsfromFuelCombustion_Highlights_2016.pdf.
Sims et al (2014) Sims R., R. Schaeffer, F. Creutzig, X. Cruz-
IEA (2017) Global EV Outlook 2017. Two million and
Núñez, M. D’Agosto, D. Dimitriu, M. J. Figueroa Meza, L.
counting. Accessed at https://www.iea.org/publications/
Fulton, S. Kobayashi, O. Lah, A. McKinnon, P. Newman,
freepublications/publication/GlobalEVOutlook2017.pdf.
M. Ouyang, J. J. Schauer, D. Sperling, and G. Tiwari.
IPCC (2014) Summary for Policymakers. In: Climate (2014) Transport. In: Climate Change 2014: Mitigation of
Change 2014: Mitigation of Climate Change. Contribution Climate Change. Contribution of Working Group III to
of Working Group III to the Fifth Assessment Report of the the Fifth Assessment Report of the Intergovernmental
Intergovernmental Panel on Climate Change [Edenhofer, Panel on Climate Change [Edenhofer, O., R. Pichs-
O., R. Pichs-Madruga, Y. Sokona, E. Farahani, S. Kadner, Madruga, Y. Sokona, E. Farahani, S. Kadner, K. Seyboth, A.
K. Seyboth, A. Adler, I. Baum, S. Brunner, P. Eickemeier, B. Adler, I. Baum, S. Brunner, P. Eickemeier, B. Kriemann, J.
Kriemann, J. Savolainen, S. Schlömer, C. von Stechow, T. Savolainen, S. Schlömer, C. von Stechow, T. Zwickel and
Zwickel and J.C. Minx (eds.)]. Cambridge University Press, J.C. Minx (eds.)].Cambridge University Press, Cambridge,
Cambridge, United Kingdom and New York, NY, USA. United Kingdom and New York, NY, USA.
Kenworthy J (2008) An international review of the Sustainable DC (2016) Sustainable DC. April 2016.
significance of rail in developing more sustainable urban Third Year Progress Report. Accessed at http://www.
transport systems in higher income cities. World Transport sustainabledc.org/wp-content/uploads/2014/04/
Policy and Practice 14 (2): 21-37. SustainableDC2016ProgressReport.pdf.18 FACTSHEET:
TRANSPORT EMISSIONS: DRIVING DOWN CAR POLLUTION IN CITIES
The ICCT (The International Council on Clean
Transportation) (2015) Global passenger vehicle standards.
Accessed at http://www.theicct.org/info-tools/global-
passenger-vehicle-standards.
Tesla (2106) Supercharger. Accessed at https://www.tesla.
com/en_AU/supercharger.19 FACTSHEET:
TRANSPORT EMISSIONS: DRIVING DOWN CAR POLLUTION IN CITIES
IMAGE CREDITS
Cover image: “Windpark Springe/Bennigsen - Windwärts
Energie GmbH” by Flickr user Windwärts Energie licensed
under CC BY-NC-ND 2.0.
Figure 1: Page ?? “Traffic happens” by Flickr user Reinis
Traidas licensed under CC BY 2.0.
Figure 2: Page ?? “DSCN3898” by Flickr user Neal Jennings
licensed under CC BY-SA 2.0.
Figure 3: Page ?? “TESLA Model S¬_9” by Flickr user hans-
johnson licensed under CC BY-ND 2.0.
Figure 4: Page ?? “Capitol Bikeshare + Washington
Monument” by Flickr user Snm01229 licensed under CC BY
2.0.
Figure 5: Page ?? “EV Zero Carbon Evolution Walking Tour”
by Flickr user Takver licensed under CC BY-SA 2.0.
Figure 6: Page ?? “Gold Coast light rail” by Flickr User
Francisco Anzola licensed under CC by 2.0.
Figure 7: Page ?? “Charlie the Bike Rack” by Flickr user Mike
Rowe licensed under CC BY-NC 2.0.Thank you for
supporting the
Climate Council.
The Climate Council is an independent, crowd-funded organisation
providing quality information on climate change to the Australian public.
CLIMATE COUNCIL
facebook.com/climatecouncil
twitter.com/climatecouncil
info@climatecouncil.org.au
climatecouncil.org.au
The Climate Council is a not-for-profit organisation
and does not receive any money from the Federal
Government. We rely upon donations from the
public. We really appreciate your contributions.
DONATE climatecouncil.org.au/donateYou can also read