MI COVID response Data and modeling update August 17, 2021 - State of ...
←
→
Page content transcription
If your browser does not render page correctly, please read the page content below
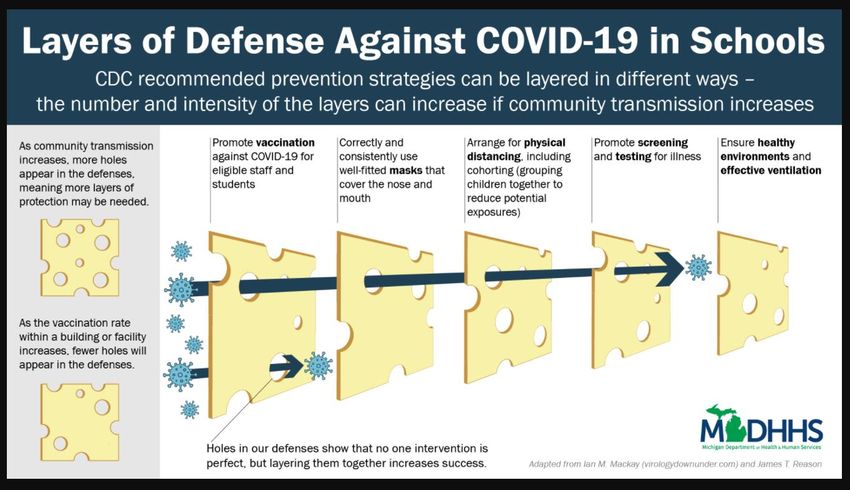
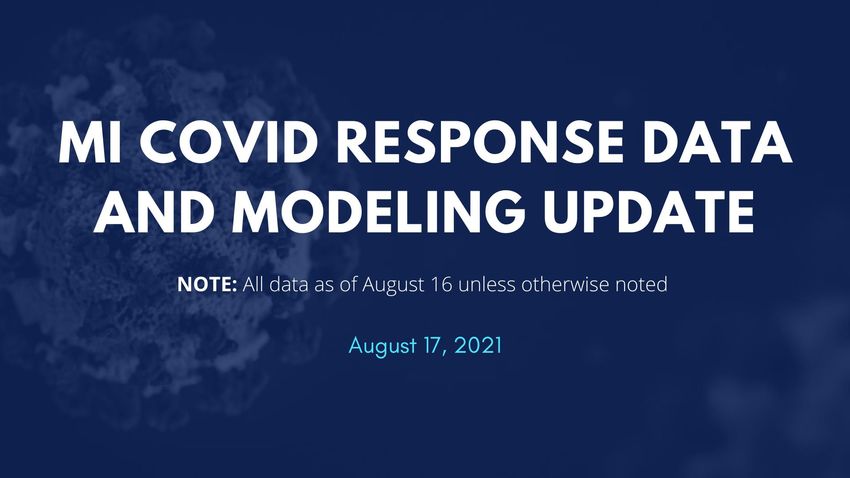
MI COVID response Data and modeling update August 17, 2021
Executive Summary – All Indicators Show Increases
Michigan is now in High Transmission
Percent Positivity (7.7%) is increasing for seven weeks (up from 7.0% last week), and Case Rate (102.0 cases/million) have increased
for over a month (up from 77.2 last week)
Michigan has 30th lowest number of cases (33rd last week), and 5th lowest case rate (9th last week) in the last 7 days
99% of positive tests available for sequencing in Michigan were Delta variant in the last 4 weeks
Percent of inpatient beds occupied by individuals with COVID (4.0%) has increased for four weeks (up from 2.9% last week).
Michigan has 9th lowest inpatient bed utilization (10th last week), and 10th lowest adult ICU bed utilization (10th last week)
Deaths (0.6 deaths/million) are increasing (0.5 deaths/million last week). There were 41 COVID deaths between Aug 3 and Aug 9.
Michigan has the T28th lowest number of deaths (21st last week), and T16th lowest death rate (T6th last week) in the last 7 days
7-day average state testing rate is steady at 2,068.0 tests/million/day. Daily diagnostic tests (PCR) is 20.5K per day, and the weekly
average for PCR and antigen tests conducted in Michigan is 34.3K.
9.98 million COVID-19 vaccine doses reported to CDC, 4.95 million people have completed their vaccine series
Science Round Up
Models are projecting a continued increase in hospitalizations and deaths over the next four to six weeks, maybe longer
Children can be impacted by the spread of COVID-19
A larger proportion of those who become cases (98%), are hospitalized (95%), and died (95%) from COVID are unvaccinated
mRNA vaccine are 96% effective at preventing hospitalizations among elderly
Among individuals previously infected, vaccination provides additional protection to prevent reinfection
Layered mitigation, especially for those not vaccinated and those not yet eligible for vaccination can avoid unnecessary surge in cases
and unintended school closures due to classroom outbreaks
2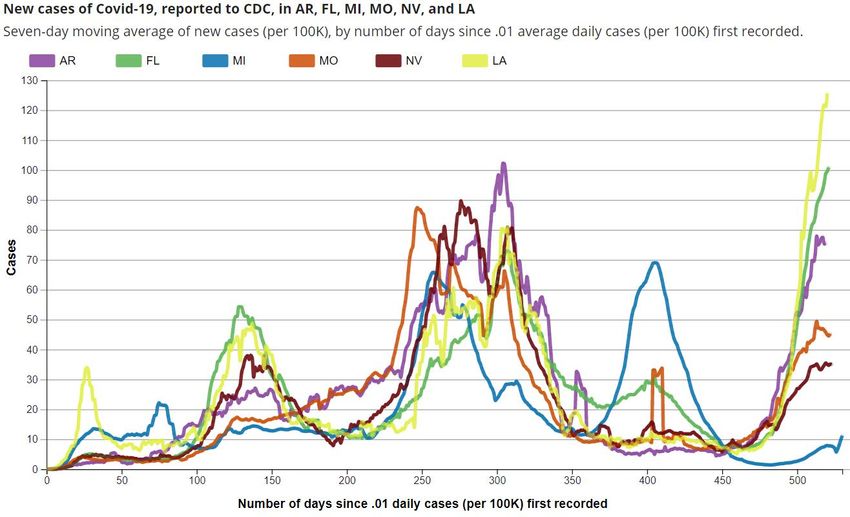
Global and National Comparisons: US cases increasing
 What we see today (data through 8/16):
 •       Globally, 207,366,191 cases and 4,365,541 deaths*
 •       Countries with the highest case count are U.S. (36,681,559), India (1,081,284), and Brazil (987,525)*
 •       Nearly all US jurisdictions have high community transmission
 •       Within the U.S., Rhode Island (14,876/100,000), North Dakota (14,858/100,000), & South Dakota
         (14,327/100,000) lead the nation in cumulative cases/capita

 • Michigan has had 10,300 cases per 100,000 since March 1, 2020
 • Michigan currently has identified 14,922 variants of concern (VOC)*
           – Cumulatively, the vast majority are B.1.1.7 (13,652 which is 91.5%)
                   •   Other VOCs include B.1.351 (0.6%), P.1 (2.2%) and B.1.617.2 (5.7%)
           – 571 VOC reported with specimen date in the 4 most recent weeks
                   •   Delta (B.1.617.2) 99%
                   •   Alpha (B.1.1.7)
State Comparisons: Missouri and Arkansas

                                           4
State Comparisons: Florida and Michigan

                                          5
State Comparisons: Nevada and Louisiana

                                          6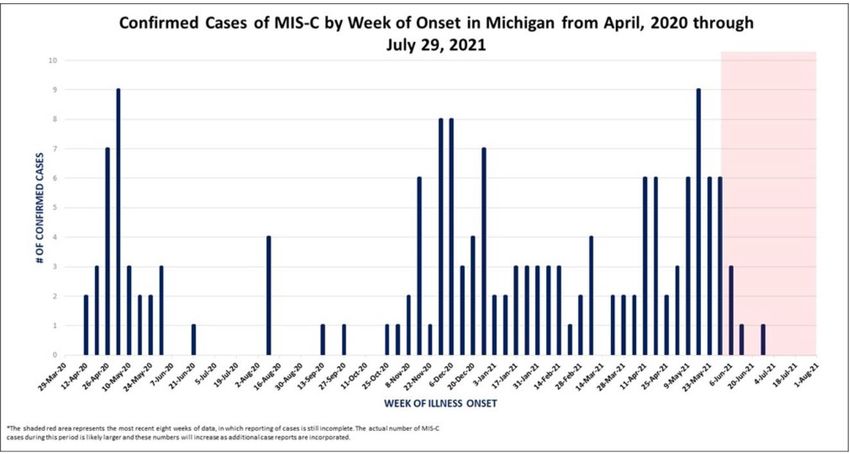
Key Messages: COVID-19 is Spreading Faster with Delta
Statewide positivity has increased to 7.7% (last week: 7.0%)
• One week percent change is up 11% (vs. up 21% last week)
• Increasing for seven weeks (over 6 times higher the Jun 26 low)
• Positivity is increasing in all MERC regions; five regions are >7% and one region > 10%
Case rate (102.0 cases/million) increasing for over a month (last week: 77.2 cases/million)
• One week increase of 15% (vs. 34% increase last week)
• Increasing for over a month (611% increase since Jun 26 low)
• Cases per million are increasing in all MERC regions
• Select variants in Michigan: 13,652 confirmed Alpha (B.1.1.7); 85 confirmed Beta (B.1.351); 329 confirmed Gamma (P.1); and 856
confirmed Delta (B.1.617.2)
Michigan is at High Transmission level
• More than half of the counties in Michigan are at high transmission level
• CDC would recommend all individuals, regardless of vaccination status, should mask indoors
• The U.S. is at high transmission level (252 cases/100,000 in last 7 days) with 54 states/territories in substantial or high transmission
Number of active outbreaks is up 36% from last week
Eighty-six new outbreaks were identified in the past week
Manufacturing/Construction reported the most new and ongoing outbreaks this week
Public Health Other Science
National Comparison Spread Severity
Response Indicators Round-up 7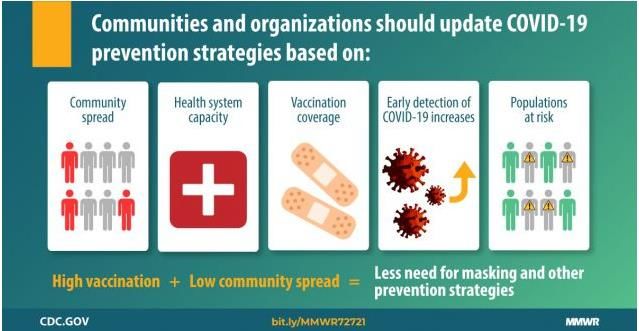
Confirmed and probable case indicators                                                         Risk levels
         Table Date: 8/16/2021 (7 days from date table was produced: 8/9/2021)                Low   A   B       C     D    E

           Cases                                            Positivity

                                                            Public Health          Other                         Science
National Comparison      Spread            Severity                                                                            8
                                                              Response           Indicators                    Round-up        8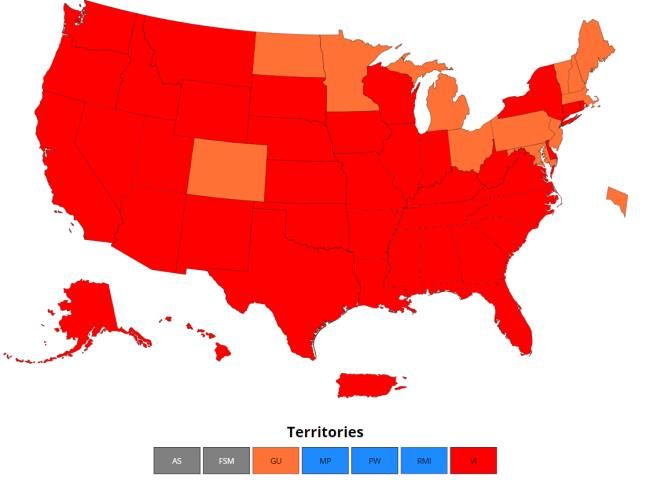
Overview of metrics for individuals
Michigan at High Transmission Level
  Dashboard | CDC | MI Start Map for most recent data by
  reporting date

                                                           Public Health     Other      Science
National Comparison   Spread            Severity                                                   10
                                                            Response       Indicators   Round-up
Cases per Capita Increasing Statewide
Daily new confirmed and probable cases per million (7-day rolling average) by Onset Date
7-day case rate Moderate Threshold
800 52-wk low Substantial Threshold
52-wk high High Threshold
600
400
200
0
3/1 5/1 7/1 9/1 11/1 1/1 3/1 5/1 7/1
• Case rates by onset date in Michigan are in substantial transmission
• Case rates in most counties are above 40 cases per million population
Note: Case information sourced from MDHHS and reflects date of onset of symptoms
Source: MDHHS – Michigan Disease Surveillance System
Public Health Other Science
National Comparison Spread Severity 11
Response Indicators Round-up 11Case Rate Trends are Increasing for All Age Groups
Daily new confirmed and probable cases per million by age group (7-day rolling average)
0-9 30-39 60-69
1000 150
10-19 40-49 70-79
20-29 50-59 80+
750
100
500
50
250
0 0
3/1 5/1 7/1 9/1 11/1 1/1 3/1 5/1 7/1 6/26 7/3 7/10 7/17 7/24 7/31 8/7 8/14
• Case rate trends for all age groups are increasing
• Case rates for all age groups are between 60 and 145 cases per million (through 8/9)
• Case rate trends are highest for 20-29-year-olds followed by 30-39, 40-49, and 10-19
Note: Case information sourced from MDHHS and reflects date of onset of symptoms
Source: MDHHS – Michigan Disease Surveillance System
Public Health Other Science
National Comparison Spread Severity 12
Response Indicators Round-up 12Number of Cases and Case Rates are Increasing for All Age Groups
Daily new confirmed and probable cases per million by age group (7-day rolling average)
Age Average Average One Week • Average daily number of cases (201) is
Group daily cases Daily Case % Change (Δ #) highest for those aged 20-29
Rate
• Avg. daily case rate (145.7 cases/mil) is
0-9 70.3 61.0 19% (+11) currently highest for 20-29
10-19 125.9 100.3 11% (+12) • Case rates for all age groups are between
20-29 201.0 145.7 9% (+16) 60-145 cases per million
30-39 164.6 135.7 13% (+19) • Case rate trends are increasing for all age
40-49 146.4 124.2 18% (+22) groups
50-59 125.4 92.9 16% (+17) • Case rates bottomed out on June 26, 2021
60-69 107.4 84.2 28% (+23)
70-79 54.7 71.4 18% (+8)
80+ 24.7 59.7 21% (+1-5) * Highest 7-day avg. following spring 2021 surge
¶ Total may not reflect state due to missing age data
Total¶ 1022.7 102.0 15% (+133.6)
Note: Case information sourced from MDHHS and reflects date of onset of symptoms
Source: MDHHS – Michigan Disease Surveillance System
Public Health Other Science
National Comparison Spread Severity 13
Response Indicators Round-up 13Racial and Ethnic Case Rates are Increasing
Daily new confirmed and probable cases per million Daily new confirmed and probable cases per
(7 day rolling average) by race category million (7 day rolling average) by ethnicity category
American Indian/Alaska Native Black/African American Hispanic or Latino Not Hispanic or Latino
100 Asian/Pacific Islander White 100
Race Case Rate
American Indian/ 65.2
75 Alaskan Native 75
Asian/Pacific Islander 35.7
Black/African American 66.2
Race Case Rate
50 White 80.0 50
Hispanic/Latino 87.0
Non-Hispanic 78.8
25 25
0 0
6/26 7/3 7/10 7/17 7/24 7/31 8/7 8/14 6/26 7/3 7/10 7/17 7/24 7/31 8/7 8/14
Updates since last week:
• Cases per million are increasing for all races and ethnicities
• Hispanics and Whites have the highest case rates
• In the past 30 days, 17% (↔) of race data and 20% (↔) ethnicity data was either missing or reported as unknown
Note: Case information sourced from MDHHS and reflects date of death of confirmed and probable cases.
Source: MDHHS – Michigan Disease Surveillance System
Public Health Other Science
National Comparison Spread Severity 14
Response Indicators Round-up 14Identified COVID-19 Cases Caused by All Variants of Concern (VOC)
in US and Michigan
Variants Circulating in United States, Jul 18 – Variants of Concern in Michigan, Aug 16
Jul 31 (NOWCAST)
Note: The low number of
specimens recently
submitted for sequencing
limits the ability to estimate
the prevalence of variants in
Michigan
727 cases in Wayne attributed to Detroit
Variant MI Reported Cases¶ # of Counties % Specimens in last 4 wks
B.1.1.7 (alpha) 13,652* 81Number of Outbreaks Reported has Increased
Number of outbreak investigations by site type, week ending Aug 12
Visibility1 Easier to identify outbreak
Site type Outbreaks by ongoing/new classification, # Harder to identify outbreak
Ongoing New Total
MANUFACTURING, CONSTRUCTION 13 18 31 Total number of active
*SOCIAL GATHERING 19 10 29 outbreaks is up 36% from
CHILDCARE/YOUTH PROGRAM 8 14 22 previous week, with 86 new
SNF/LTC/OTHER ASSISTED LIVING 9 13 22 outbreaks identified (20 more
*RESTAURANTS AND BARS 4 8 12 than last week)
OTHER 8 3 11
HEALTHCARE 7 3 10
Manufacturing/ construction
OFFICE SETTING 7 3 10
reported the greatest number
*RELIGIOUS SERVICES 5 3 8
of new outbreaks (18) this
*COMMUNITY EXPOSURE - OUTDOOR 3 2 5
K-12 SCHOOL 2 2 4 week, followed by childcare/
AGRICULTURAL/FOOD PROCESSING 2 2 4 youth programs (14), SNF/LTC
*SHELTERS 40 4 (13), social gatherings (10),
*PERSONAL SERVICES 1 2 3 restaurants/ bars (8), and
*RETAIL 0 3 3 eleven other settings with at
CORRECTIONS 2 1 3 least 1 new outbreak in the last
COLLEGE/UNIVERSITY 10 1 week.
*COMMUNITY EXPOSURE - INDOOR 0 1 1
TOTAL 97 86 183
1. Based on a setting’s level of control and the extent of time patrons/residents spend in the particular setting, different settings have differing levels of ability to ascertain whether a case derived from that setting
NOTE: Many factors, including the lack of ability to conduct effective contact tracing in certain settings, may result in significant underreporting of outbreaks. This chart does not provide a complete picture of
outbreaks in Michigan and the absence of identified outbreaks in a particular setting in no way provides evidence that, in fact, that setting is not having outbreaks.
Source: LHD Weekly Sitreps
Public Health Other Science
National Comparison Spread Severity 16
Response Indicators Round-up 16Key Messages: COVID-19 and Healthcare Capacity and COVID Severity
Hospitalizations and ICU utilization are increasing
2.1% of ED visits are for COVID-like illness (CLI) (up from 1.6% last week)
Hospital admissions are increasing for all age groups under 80 years this week
Hospitalizations up 23% since last week (vs. 52% increase week prior)
All regions are showing increasing trends in hospitalization trends this week, except Region 7
▪ Hospitalization for COVID-19 is highest in Regions 2N, 2S, 3 and 6
▪ Fastest growth is in Regions 3, 6 and 8
Volume of COVID-19 patients in intensive care has increased 15% since last week (vs. 57% increase last week)
Death rate is 0.6 daily deaths per million people
Death rate has increased two weeks
41% increase since Jul 22 low
30-day proportion of deaths among those under 60 years of age is steady from the prior week
Public Health Other Science
National Comparison Spread Severity
Response Indicators Round-up 17Michigan Trends in Emergency Department (ED) Visits for COVID-19-Like
Illness (CLI) saw the largest increase in over 3 months
2.1%
• Trends for ED visits have increased to 2.1% since last week (up from 1.6% week prior)
• Trends vary by age groups with all age groups seeing an increase
• Over the past week, those 40-49 years have seen the highest number of avg. daily ED CLI visits, but those between 25 and 49 are all above the state average
Source: https://covid.cdc.gov/covid-data-tracker/#ed-visits
Public Health Other Science
National Comparison Spread Severity
Response Indicators Round-up 18Average Hospital Admissions Are Increase for all Age Groups
25
20
15
10
5
0
7/11 7/18 7/25 8/1 8/8 8/15
Peds 18 - 19 20 - 29 30 - 39 40 - 49 50 - 59 60 - 69 70 - 79 80+ Age
Unkn
Source: CHECC & EM Resource
• Trends for daily average hospital admissions have increased 28% since last week (vs. 68% increase prior week)
• This week, all age groups under 80 have experienced increases in daily hospital admissions
• Over the past week, those 60-69 years have seen the highest number of avg. daily hospital admissions (25 admissions)
Public Health Other Science
National Comparison Spread Severity 19
Response Indicators Round-up 19Statewide Hospitalization Trends: Total COVID+ Census
Hospitalization Trends 3/1/2021 – 8/16/2021 COVID+ census in hospitals has
Confirmed Positive & Persons Under Investigation (PUI) increased 23% from last week (previous
week was up 52%). The rate of growth
in hospitalizations has slowed from last
Confirmed Positive
week.
Hospitalized COVID Positive Long Term
Trend (beginning March 2020)
PUI
20Statewide Hospitalization Trends: Regional COVID+ Census
All regions except Region 7 show increasing
Hospitalization Trends 3/1/2021 – 8/16/2021
hospitalization trends this week. The fastest
Confirmed Positive by Region
growth is in Regions 3, 6 and 8.
Region 1
Region 2N
All regions except Region 8 are above 50/M
Region 2S population hospitalized with Regions 2S, 2N
Region 3 and 3 approaching 100/M.
Region 5
Region 6
Region 7 Region COVID+ COVID+
Region 8 Hospitalizations (% Δ Hospitalizations
from last week) / MM
Region 1 65 (7%) 60/M
Region 2N 217 (23%) 98/M
Region 2S 214 (13%) 96/M
Region 3 112 (60%) 99/M
Region 5 66 (5%) 69/M
Region 6 102 (52%) 70/M
Region 7 32 (-9%) 64/M
Region 8 15 (200%) 48/M
21Statewide Hospitalization Trends: ICU COVID+ Census
Hospitalization Trends 3/1/2021 – 8/16/2021 Overall, the census of COVID+ patients in ICUs has
Confirmed Positive in ICUs increased by 15% from last week.
6 regions have increasing ICU COVID+ hospital census
from last week. Region 1 and 6 have 10%+ of ICU
beds occupied with COVID+ patients.
Region Adult COVID+ in Adult ICU % of Adult ICU
ICU (% Δ from Occupancy beds COVID+
last week)
Region 1 19 (19%) 81% 10%
Region 2N 47 (24%) 69% 8%
Region 2S 55 (10%) 78% 8%
Region 3 28 (100%) 82% 9%
Region 5 12 (-20%) 60% 6%
Confirmed Region 6 25 (4%) 75% 11%
Positive in ICU
Region 7 6 (-50%) 60% 3%
Region 8 3 (50%) 57% 4%
22Average and total new deaths, by age group
Daily confirmed and probable deaths per million by Total confirmed and probable deaths by age group
age group (7 day rolling average) (past 30 days, ending 8/9/2021)
0-19 40-49 70-79 • 26% of deaths below age sixty
20-29 50-59 80+
30-39 60-69 Total
30
51
20
34 39
19
10
13
7
0 1-5
0
5/20 6/3 6/17 7/1 7/15 7/29 8/12 0-19 20-29 30-39 40-49 50-59 60-69 70-79 80+
• Overall trends for daily average deaths are increasing since last week
• Through 8/9, the 7-day avg. death rate is below 1.0 daily deaths per million people for those under the age of 70
Note: Death information sourced from MDHHS and reflects date of death of confirmed and probable cases.
Source: MDHHS – Michigan Disease Surveillance System
Public Health Other Science
National Comparison Spread Severity 23
Response Indicators Round-up 2330-day rolling average daily deaths per million people by race and
ethnicity
Average daily deaths per million people by race Average daily deaths per million people by
ethnicity
American Indian/Alaska Native Black/African American 15 Hispanic or Latino Not Hispanic or Latino
15 Asian/Pacific Islander White
10
10
5
5
0 0
5/20 6/3 6/17 7/1 7/15 7/29 8/12 5/20 6/3 6/17 7/1 7/15 7/29 8/12
• Additional reviews of vital records death data were performed the weeks of 7/6 and 8/9 to search for race and ethnicity
• This review has resulted in an adjustment of deaths for American Indian and Alaskan Natives from previous weeks
• Currently, American Indian/Alaskan Natives have the highest death rate
Note: Death information sourced from MDHHS and reflects date of death of confirmed and probable cases.
Source: MDHHS – Michigan Disease Surveillance System
Public Health Other Science
National Comparison Spread Severity 24
Response Indicators Round-up• `
COVID-19 Vaccination
Administration (doses administered)
• 3,994 first doses administered each day (7 day rolling average*)
• Most administered frequently by pharmacies, local health departments, and hospitals
Coverage (people vaccinated)
• 65.4% (+0.6) of aged 18+ have had first dose of vaccine; 86.5% (+0.3) of aged 65+ have had first dose
• 4,955,984 people in Michigan have completed vaccination series (4,916,256 and 4,890,859 last 2 weeks)
• Initiation highest among Asian, Native Hawaiian or Pacific Islander and American Indian/Alaskan Native
individuals (MI COVID Vaccine Dashboard 8/10/21)
• Less than 1% of Vaccinated Individuals Later Tested Positive for COVID-19 (Number of cases who are fully
vaccinated (n= 12,121)
*https://covid.cdc.gov/covid-data-tracker/#vaccination-trends_vacctrends-onedose-daily
Public Health Other Science
National Comparison Spread Severity
Response Indicators Round-up 25• `
Doses Administered as of 8/16/2021
12,199,070 doses delivered to providers and 9,893,319
doses administered (CDC tracker)
• 44,903 doses administered week ending 8/14 week
• 3,994 first doses/day on average
Aug 8 – Aug 14 (inclusive), doses were most frequently
administered by
- Pharmacies (30.6K)
- LHD (4.2K) and hospitals (3.2K)
- Family practice (2.1K), and FQHCs (1.7K), and
Pediatricians (790)
Public Health Other Science
National Comparison Spread Severity
Response Indicators Round-up 26Over 4.9 Million Michiganders fully vaccinated
4.96 million people in the state are fully Vaccination Coverage in Michigan as of 8/17/21
vaccinated
82.2% of people aged 65 and older have Age Group % At Least % Fully Number Fully
completed the series
One Dose Vaccinated Vaccinated
Race/Ethnicity for those 12 years and older:
Total Population 54.3 49.6 4,955,984
• Initiation coverage highest among those
of Non-Hispanic (NH) Asian, Native ≥ 12 years 63.1 57.7 4,955,844
Hawaiian or Pacific Islander Race
(53.1%), then NH American Indian ≥ 18 years 65.4 60.1 4,714,549
(49.4%), NH White (46.2%), NH Black
or African American Races (35.2%). ≥ 65 years 86.5 82.2 1,450,355
• Initiation is at 46.3% for those of
Hispanic ethnicity
• Completion follows the same pattern
• 20.7% data missing or unknown
Public Health Other Science
National Comparison Spread Severity
Response Indicators Round-up 27`
Potential COVID-19 Vaccination Breakthrough Cases
Michigan part of CDC’s nationwide investigation (COVID-19 Breakthrough Case Investigations and Reporting | CDC)
Michigan Data (1/1/21 through 8/10/21):
• 12,121 cases met criteria based on a positive test 14 or more days after being fully vaccinated
• Less than 1% of people who were fully vaccinated met this case definition
• Includes 247 deaths (217 in persons ages 65 years or older)
• 711 cases were hospitalized
• Vaccine breakthrough cases are expected. COVID-19 vaccines are effective and are a critical tool to bring the pandemic under control.
However, no vaccines are 100% effective at preventing illness in vaccinated people. There will be a small percentage of fully vaccinated
people who still get sick, are hospitalized, or die from COVID-19.
• More than 166 million people in the United States have been fully vaccinated as of August 9, 2021. Like with other vaccines, vaccine
breakthrough cases will occur, even though the vaccines are working as expected. Asymptomatic infections among vaccinated people will
also occur.
• There is some evidence that vaccination may make illness less severe for those who are vaccinated and still get sick.
• Current data suggest that COVID-19 vaccines authorized for use in the United States offer protection against most SARS-CoV-2 variants
currently circulating in the United States. However, variants will cause some vaccine breakthrough cases.
Public Health Other Science
National Comparison Spread Severity
Response Indicators Round-up 28Science Round Up
What is delta and what does it mean?
• Delta variant has led to high transmission throughout the U.S. with some states experiencing highest COVID-19 cases and
hospitalizations to date
• In Michigan, delta has quickly become the predominant variant and cause for the current increase in cases and hospitalizations
• Models are projecting a continued increase in hospitalizations and deaths over the next four to six weeks, maybe longer
• With return to school year, lack of layered mitigation measures will likely mean increases in cases and severe outcomes among
children (e.g., hospitalizations, MIS-C, and long-COVID)
Are vaccinations working?
• A larger proportion of those who become cases (98%), are hospitalized (95%), and died (95%) from COVID are unvaccinated
• mRNA vaccine are 96% effective at preventing hospitalizations among elderly
• Among individuals previously infected, vaccination provides additional protection to prevent reinfection
What can we do about case increases?
• Layered mitigation, especially for those not vaccinated and those not yet eligible for vaccination can avoid unnecessary surge in
cases and unintended school closures due to classroom outbreaks
• Treatment when exposed: FDA revised EUA for REGEN-COV for post-exposure prophylaxis is a new tool for preventing severe
COVID-19 outcomes
Public Health Other Science
National Comparison Spread Severity
Response Indicators Round-up 29What does Delta Variant mean
for Michigan
30Cumulative COVID-19 Case Rates: States with high Delta Comparison
Michigan
• Average daily incidence per 100,000 cases in Michigan is currently lower than other states experiencing a surge in delta cases
Source: CDC COVID Data Tracker – State Trend Comparison
Public Health Other Science
National Comparison Spread Severity 31
Response Indicators Round-up 31What if Scenarios: Hospitalizations if we follow Wave 2 or 3
If this wave continues to grow and follows growth patterns of prior Michigan waves, we would
450
face growing hospitalizations through September with a peak in late September/early October.
400
Magnitude of 4th wave
350
here is assumed to
Hospitalizations per million population
parallel prior waves for
300
illustration purposes
250 1-Oct-2021 only; There is insufficient
data to estimate the
200 magnitude of any fourth
wave at this time
150
= 5-Mar-2021
100 Wave 2 (winter)
= 13-Oct-2020
50
16-Aug-2021
Wave 3 (spring)
0
0 20 40 60 80 100 120 140 160 180
Days since beginning of wave (aligned)
32Total projected
Modeling scenarios for Current vaccination &
social contact trends
deaths Aug-Nov:
3937 - 6177
Michigan: COVID surge Deaths observed
Mar-Jun: 4391
on the horizon
Spring surge
• If vaccination slowing and
increased social contact rates Median
continue, model simulations (dashed)
project a surge is likely,
Best-fit (solid)
potentially similar size to spring
• If contact rates return to low
levels and/or vaccinations Current vaccination rate, April vaccination rate,
lower contact rate current contact rate
increase to April uptake, the
surge can be reduced/stopped Total projected deaths Total projected deaths
Aug-Nov: 433 Aug-Nov: 2430 - 2851
Model projections are scenarios rather than forecasts—actual
contact patterns may not reflect the projected scenarios.
Model calibrated to MDSS case data (through 7/16, as of
7/23), using mobility data (Unacast encounter rate), increased
transmission probability in June for the Delta variant.
Vaccination rates based on MCIR. Uncertainty: top 10% of
1000 parameter estimates.How do these cases translate to hospitalizations?
• Projected hospital admissions, based on Age group Projected total
hospital admissions
the model simulations and fraction of Aug-Nov
hospital admissions for different age 0-17 204 – 428
groups over March-May
18-19 110 – 229
• These projections assume the same age 20-29 959 – 2007
distribution of cases and hospitalizations 30-39 1217 – 2547
as the spring surge 40-49 1463 – 3061
• Projected hospital admissions ranges are 50-59 2256 – 4722
based only on the best fit and median 60-69 2550 – 5336
simulations (not the full uncertainty range) 70-79 2041 – 4271
80+ 1592 – 3331
Model calibrated to MDSS case data (through 7/16, as of 7/23), using Total 12,186 – 25,505
mobility data (Unacast encounter rate), increased transmission probability
in June for the Delta variant. Vaccination rates based on MCIR.
Uncertainty: top 10% of 1000 parameter estimates.Delta will increase transmission in Children: SARS-CoV-2 can Negatively
Impact Children Directly and Indirectly
➢ Children can get infected with SARS-CoV-2: proportion of kids getting sick with COVID-19 is increasing
25% Cumulative
Last Month
20%
15%
10%
5%
0%
0-9 10-19 20-29 30-39 40-49 50-59 60-69 70-79 80+
➢ Children can transmit the virus to others and can be sources for outbreaks
Sources: Case data: MDSS; Kim C, et al. Characteristics of COVID-19 Cases and Outbreaks at Child Care Facilities — District of Columbia, July–December 2020. MMWR Morb Mortal Wkly Rep 2021;70; Szablewski CM, et al. SARS-CoV-2
Transmission and Infection Among Attendees of an Overnight Camp — Georgia, June 2020. MMWR Morb Mortal Wkly Rep 2020;69
Public Health Other Science
National Comparison Spread
Response Indicators Round-upSARS-CoV-2 can Negatively Impact Children Directly and Indirectly
• Missed in person school negatively impacts children and can occur from statewide lockdowns or
large uncontrolled outbreaks within schools
• Remote learning disproportionately affects minorities and lower income children
• Children can experience severe outcomes from COVID-19 including MIS-C, Hospitalization, and Death
• A JAMA study reported MIS-C incidence was 5.1 persons per 1,000,000 person-months and 316 persons
per 1,000,000 SARS-CoV-2 infections in persons younger than 21 years
• Incidence was higher among Black, Hispanic or Latino, and Asian or Pacific Islander persons compared
with White persons and in younger persons compared with older persons
Sources: Verlenden JV, Pampati S, Rasberry CN, et al. Association of Children’s Mode of School Instruction with Child and Parent Experiences and Well-Being During the COVID-19 Pandemic — COVID Experiences Survey, United States, October 8–
November 13, 2020. MMWR Morb Mortal Wkly Rep 2021;70; Payne AB, et al. Incidence of Multisystem Inflammatory Syndrome in Children Among US Persons Infected With SARS-CoV-2. JAMA Netw Open. 2021;4(6)
Public Health Other Science
National Comparison Spread
Response Indicators Round-upSARS-CoV-2 can Negatively Impact Children Directly and Indirectly
• Children can experience severe health outcomes from COVID-19 including MIS-C and Hospitalization
• Hospitalizations among children nationwide is higher than it’s ever been*
• Nearly half of children hospitalized have no reported underlying conditions†
United States Hospital Admissions | 0 -17 years U.S. Pediatric Hospitalizations | Underlying Medical Conditions
46.6%
Sources: * CDC COVID Data Tracker > New Hospital Admissions; † COVIDNET
Public Health Other Science
National Comparison Spread
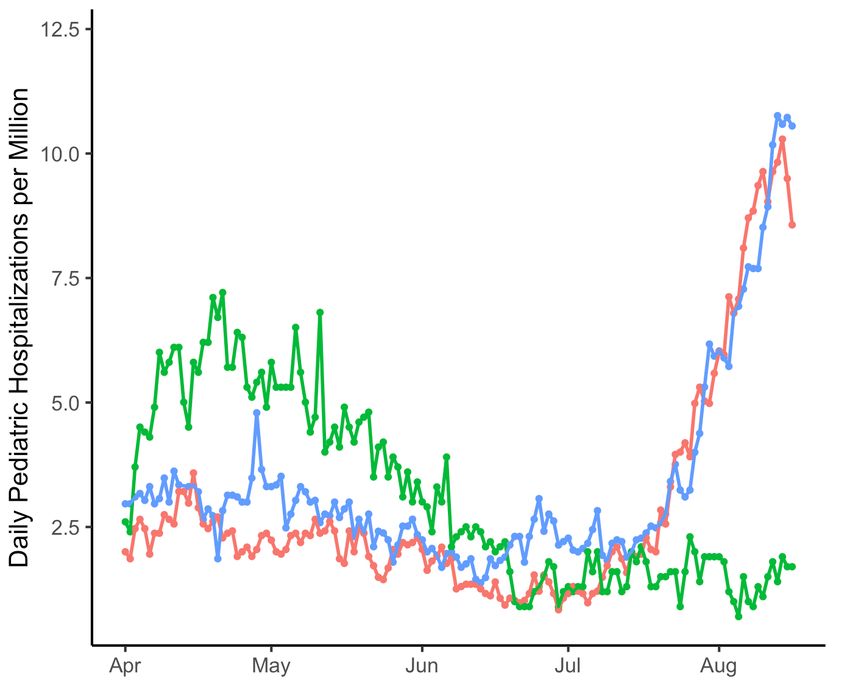
Response Indicators Round-upMultiple states are experiencing a sharp increase in
pediatric hospitalizations
• States across the southern US
have seen extremely rapid and
concerning surges in pediatric
hospitalization rates
• Highest pediatric COVID
hospitalization rates seen so far in
the pandemic for many areas
• Potential for a similar surge in
Michigan as cases and
hospitalizations rise
Source: CDC hospital admissions data trackerSick kids running out of room at Omaha-area hospitals as start of school, COVID loom
RSV + COVID: “At Oklahoma Children's Hospital, available pediatric beds are
scarce as RSV surges”
Baton Rouge: Kids sick with Covid are filling up children’s hospitals in areas seeing spikes
Louisiana remains COVID-19 capital of U.S. as hospitals struggle to find beds and
staff
‘All of them': Tennessee health chief says children's hospitals will fill up as the delta variant
surges: “on pace to completely fill children's hospitals across the state by the end of next week.”
After record admissions, Arkansas ICUs down to last 8 beds
Dallas County has no pediatric ICU beds left, county judge says
Quote from county judge Clay Jenkins: "That means if your child's in a car wreck, if your child has a
congenital heart defect or something and needs an ICU bed, or more likely if they have Covid and
need an ICU bed, we don't have one. Your child will wait for another child to die," Jenkins said. "Your
child will just not get on the ventilator, your child will be CareFlighted to Temple or Oklahoma City or
wherever we can find them a bed, but they won't be getting one here unless one clears."SARS-CoV-2 can Negatively Impact Children Directly and Indirectly
Multisystem Inflammatory Syndrome in Children (MIS-C)
• Higher community transmissions is followed by higher incidence of MIS-C cases
Source: MDHHS and MIS-C Data and Reporting
Public Health Other Science
National Comparison Spread
Response Indicators Round-upSARS-CoV-2 can Negatively Impact Children Directly and Indirectly
Multisystem Inflammatory Syndrome in Children (MIS-C)
• Higher community transmissions is followed by higher incidence of MIS-C cases
• Many of those who experience MIS-C in Michigan are admitted to intensive care, school age, and
are Black/African American
• 70.6% of MIS-C cases admitted to ICU
• 44% of MIS-C cases are black or African American Children
Source: MDHHS and MIS-C Data and Reporting
Public Health Other Science
National Comparison Spread
Response Indicators Round-upSARS-CoV-2 can Negatively Impact Children Directly and Indirectly
• While many school-aged children fully recover from COVID-19, 1 in 20 can experience symptoms last
longer than four weeks and 1 in 50 can experience symptoms for more than 8 weeks
• Children experience many Indirect Impacts when there is uncontrolled spread of SARS-CoV-2
• Loss of loved ones/caregivers: more than 136,000 children in the US lost a primary or secondary care
giver (orphanhood-report.pdf (cdc.gov))
• Adverse outcome to mental and physical health
• Interferences with developmental milestones
Sources: Aerosol Dynamics Model for Estimating the Risk from Short-Range Airborne Transmission and Inhalation of Expiratory Droplets of SARS-CoV-2; Southern Nevada Health District; LA County; Retraction Notice.
Public Health Other Science
National Comparison Spread
Response Indicators Round-upAre Vaccinations Working?
43COVID-19 in Michigan: Cases by Vaccination Status, January 15 – July 28
Fully Vaccinated People (4,631,476)
Cases Hospitalization Deaths
Percent of Cases In People Not Percent of Hospitalizations In People Percent of Deaths In People Not
Fully Vaccinated Not Fully Vaccinated Fully Vaccinated
(388,584 / 398,302) (11,048 / 11,691) (4,642 / 4,888)
97.6% 94.5% 95.0%
388,584 11,048 4,642
Total Cases Not Fully Vaccinated Total Hospitalized Not Fully Vaccinated Total Deaths Not Fully Vaccinated
Total Breakthrough Cases Total Breakthrough Hospitalizations Total Breakthrough Deaths
9,718 643 246
0.210% 0.014% 0.005%
Percent of Fully Vaccinated People who Percent of Fully Vaccinated People Who Were Percent of Fully Vaccinated People Who Died of
Developed COVID-19 (9,718 / 4,631,476) Hospitalized for COVID-19 (643 / 4,631,476) COVID-19 (246 / 4,631,476)
2.4% 5.5% 5.0%
Percent of Cases Who Were Fully Vaccinated Percent of Hospitalizations Who Were Fully Percent of Deaths Who Were Fully Vaccinated
(9,718 / 398,302) Vaccinated (643 / 11,691) (246 / 4,888)
Total Cases: 398,302 Total Hospitalizations: 11,691 Total Deaths: 4,888
Michigan Disease Surveillance System may underestimate the frequency of COVID-19 hospitalizations:
- Case investigation and follow-up is more difficult for individuals who get vaccinated (e.g., they are too ill to speak to investigators, don’t answer their phone, or otherwise).
- These hospitalizations include individuals who are hospitalized for issues other than COVID19 (the same as breakthrough COVID-19).
- Individuals who get hospitalization will lag after infection and may occur after case investigation.
Public Health Other Science
National Comparison Spread Severity
Response Indicators Round-up 44`
Potential COVID-19 Vaccination Breakthrough Cases
1200 Breakthrough Case Rate vs. Unvaccinated Rate Breakthrough Death Rate vs. Unvaccinated Death Rate
Case Rate among Fully Vaccinated 12
1000
Case Rate among Unvaccinated
10
800
8
600
6
400
4
200 2
0 0
1/25 2/25 3/25 4/25 5/25 6/25 7/25 1/25 2/25 3/25 4/25 5/25 6/25 7/25
• Trends over time show that both the case rate and death rate among the vaccinated (aka breakthrough infections and deaths) are lower
than the unvaccinated rated in Michigan
• The proportion of breakthrough cases and deaths among all cases and deaths has shown some increases as a more people become fully
vaccinated
• However, the risk of infection and death remains significantly lower among the unvaccinated
• This principle indicates that the absolutely number or the proportion of absolute number of breakthrough alone is not sufficient to
measure, especially as more people become vaccinated. Instead, proportion among appropriate denominator is preferred.
Public Health Other Science
National Comparison Spread Severity
Response Indicators Round-up 45All three vaccines effective at preventing hospitalization
Effectiveness of COVID-19 Vaccines in Preventing Hospitalization Among Adults Aged ≥65 Years — COVID-NET, 13
States, February–April 2021
COVID-NET: data on laboratory-confirmed COVID-19–
associated hospitalizations in 99 U.S. counties in 13
states including Michigan.
Among adults aged 65–74 years, effectiveness of
full vaccination for preventing hospitalization was
96% for Pfizer-BioNTech, 96% for Moderna, and
84% for Janssen COVID-19 vaccines
Among adults aged ≥75 years, effectiveness of full
vaccination for preventing hospitalization was
91% for Pfizer-BioNTech, 96% for Moderna, and
85% for Janssen COVID-19 vaccines.
Moline HL, Whitaker M, Deng L, et al. Effectiveness of COVID-19 Vaccines in Preventing Hospitalization Among Adults Aged ≥65 Years — COVID-NET, 13 States, February–April 2021. MMWR
Morb Mortal Wkly Rep. ePub: 6 August 2021. DOI: http://dx.doi.org/10.15585/mmwr.mm7032e3external icon.
Public Health Other Science
National Comparison Spread Severity
Response Indicators Round-up 46Understanding breakthrough cases: When more people are
vaccinated, more cases will come from the vaccinated
population—even if the vaccine is working
Scenario 1: 50% Vaccinated Scenario 2: 90% Vaccinated
Unvaccinated
Unvaccinated
More cases are
25 vaccinated! But
More cases are the vaccine is 5
unvaccinated still working
9
5
Vaccinated
Vaccinated
20 infections 36 infections
stopped by stopped by
vaccination vaccination
Both Scenarios: Vaccine reduces disease by 80%, 2.5% infection level, 2000 total peopleLaboratory evidence suggests that antibody responses
after COVID-19 vaccination provide better neutralization
than natural infection, however few epidemiologic studies
Among previously under real world conditions have been completed
infected individuals:
being unvaccinated Recent report from a case control study in Kentucky:
Among those infected with SARS-CoV-2 in 2020, being
is associated with unvaccinated was associated with 2.34 times the odds of
significantly higher reinfection compared with being fully vaccinated
odds of reinfection
compared with being
fully vaccinated Among individuals previously infected, full vaccination
provides additional protection against reinfection
Source: Cavanaugh et al., Reduced Risk of Reinfection with SARS-CoV-2 After COVID-19 Vaccination — Kentucky, May–June 2021. MMWR 2021How many people in Michigan have been either
vaccinated or previously infected?
Michiganders • 28% of Michiganders have been previously infected
with COVID based on seroprevalence (nucleocapsid -
measures previous infection only)
• 54% of Michiganders (all ages) have received at least
one dose; 49% fully vaccinated
Vaccinated
• If people are equally likely to get vaccinated whether
they have been previously infected or not, then:
• ~67% would either received at least one dose or
previously infected (estimate)
• ~63% would either fully vaccinated or previously
Vaccinated
infected (estimate)
and previously Previous infection • Uncertainty around protection from previous infection
infected
Is this enough to prevent another surge? Puerto
Sources: CDC seroprevalence & vaccination Rico provides comparison point—
levels as of 8/8/21.Puerto Rico: 74.8% of the population has either been
previously infected or vaccinated—but they are currently
at high transmission levels
• 75% of Puerto Ricans have either
been vaccinated or previously
infected based on seroprevalence
(spike protein – measures vaccination or
previous infection)
• 70% of Puerto Ricans (all ages) have
received at least one dose; 61%
fully vaccinated
Cases per 100K in PR
• However, Puerto Rico is seeing a
rapid surge similar to spring peak,
reaching CDC high transmission
levels
Sources: CDC cases, seroprevalence, &
vaccination levels as of 8/8/21.What Can We Do About Case
Increases?
51• Layered strategy: high adherence to masking + classroom cohorting and other measures—but classroom
seats were a median of 3 ft apart
• “In a high community transmission setting, low school-associated transmission was observed with a 0.7%
secondary attack rate.”
Layered prevention strategies including masking
Secondary transmission in only 2 of 102 close contacts tested
Five of the nine transmission clusters involved inadequate mask use by studentsModeling: Masks can substantially reduce transmission
in school settings, even with delta variant
If 1 infectious child attends a class of 25 students, how long does it take for
there to be a >50% chance of transmission occurring?
3h
Elementary
24 h
120 h
2h
High School
18 h
89 h
Estimates from the COVID-19 Indoor Safety Guideline, based on Bazant and Bush, A guideline to limit indoor airborne transmission of COVID-19, PNAS
2021. Simulations assume: delta strain, normal talking (not singing/etc.), with child age group for elementary and average between adult and child age
groups for high school. Vaccine coverage was assumed to be 0% for elementary and 33% for high school, based on age-specific coverage rates as of
8/6/21. We assumed 95% mask fit/compliance for ‘Complete Masking’ and 75% for ‘Imperfect Masking’.Modeling study in NC: Masking and testing in K-12
schools can prevent 40-70% of new infections
• Children under 12 are not
yet eligible for vaccines
and so are at higher risk
• Without masks or testing
up to 90% of susceptible
students may become
infected by the end of the
semester (if only 30% have
protection due to previous
infection or vaccination)
• Masking reduces
projected infections by
40-75% in for elementary,
middle, and high schoolsMask mandates implemented after delta surge saw slower rates of
increases in jurisdictions compared to those who didn’t require masking
Southern NV (LV) businesses
issues mask requirement
Los Angeles County (LAC)
St. Louis County (STL) issues mask mandate
• Delta variant contributed to surges in several U.S. states in July issues mask mandate
• Several states prohibited local masks mandates 1200
•
7-day Avg. Cases per 1,000,000
To date, there have been no national universal mask mandates
regardless of vaccinations, only recommendations
800
• Several local jurisdictions passed mask mandates for indoor settings,
regardless of vaccination status, in response to spread of the delta
variant
• Three were: LA County (LAC), St. Louis (STL), and Southern 400
Nevada Health District (NV) including Clark County (Las Vegas)
• In contrast, Orleans Parish (Louisiana), Pulaski County (Little
Rock, Arkansas), and Duval County (Jacksonville, Florida) had
no such mandates 0
6/1 6/8 6/15 6/22 6/29 7/6 7/13 7/20 7/27 8/3 8/10
• While other factors could have also contributed to lower case
rates, jurisdictions with mask mandates have experienced lower
spread of COVID-19 during the delta surge Clark County (Las Vegas) LA County (LA) St Louis County (STL)
Orleans Parish (NO) Duval County (Jacksonville) Pulaski County (Little Rock)
Sources: St. Louis City COVID-19 dashboard; LA County COVID-19 dashboard, CDC COVID Data Tracker; population sizes from CDC Wonder Bridged Race Estimates
Public Health Other Science
National Comparison Spread Severity
Response Indicators Round-up 56MONOCLONAL ANTIBODY POST EXPOSURE PROPHYLAXIS: FDA
revision of Emergency Use Authorization of REGEN-COV
Post-exposure prophylaxis using REGEN-COV in individuals 12 years and older
who are
- Are at high risk for progression to severe COVID-19, and
- Are not fully vaccinated or are not expected to mount an adequate immune
response, and
- Have been exposed to an individual infected with SARS-CoV-2 as close contact
or because of COVID-19 infection in other individuals in same institutional
setting (for example, nursing homes or prisons)
Use is in addition to prior authorization to treat non-hospitalized patients with
mild to moderate COVID-19 in adult and pediatric patients, with positive SARS-
CoV-2 viral testing, and who are at high risk for progression to severe COVID 19.
REGEN-COV is expected to be effective against circulating variants.
Post-exposure prophylaxis is not a substitute for vaccination against COVID-19.
Additional information on monoclonal antibody therapy is available at
www.michigan.gov/covidtherapy.
Public Health Other Science
National Comparison Spread Severity
Response Indicators Round-up 57CDC Guidance for Implementing COVID-19 Prevention Strategies in the
Context of Varying Community Transmission Levels and Vaccination
Coverage
Public health system needs to assess use of prevention strategies to
avoid stressing health care capacity to provide adequate COVID-19 and
non–COVID-19 care
CDC recommends five critical factors be considered to inform local
decision making:
1) Level of SARS-CoV-2 community transmission
2) Health system capacity
3) COVID-19 vaccination coverage
4) Capacity for early detection of increases in COVID-19 cases
5) Populations at increased risk for severe outcomes from COVID-19
Proven effective strategies against transmission, beyond vaccination:
1) Using masks consistently and correctly
2) Maximizing ventilation
3) Maintaining physical distance and avoiding crowds
4) Staying home when sick
5) Handwashing
6) Regular cleaning of high-touch surfaces
Prevention strategies should be strengthened or added if transmission
worsens.
Prevention strategies should only be relaxed after several weeks of
continuous improvement in level of community transmission
Sources: Guidance for Implementing COVID-19 Prevention Strategies in the Context of Varying Community Transmission Levels and Vaccination Coverage
Public Health Other Science
National Comparison Spread Severity
Response Indicators Round-up 58Appendix
Nearly all States and Territories are at High CDC Transmission Level
    •   2 jurisdictions have substantial transmission (orange
        states); down 12 from 7 days ago
    •   52 jurisdictions have high transmission (red states);
        up 12 from 7 days ago
    •   CDC recommends masking when indoor public
        spaces; regardless of vaccination status

                      Last Week

                                                                     Public Health     Other      Science
National Comparison               Spread                  Severity
                                                                      Response       Indicators   Round-up   60
Cumulative COVID-19 Case Rates: Midwest Comparison
Michigan
• Cumulative incidence per 100,000 cases in Michigan has been lower than other states in the Midwest following spring 2020 surge
• Michigan’s mitigation policies helped control the spread of SARS-CoV-2 relative to other states in the Midwest, particular during surge in
November and December
• The current trajectory in Michigan continues to be in the range of cumulative case rates of our Midwest neighbors
Public Health Other Science
National Comparison Spread Severity 61
Response Indicators Round-up 61Most Michigan Counties at Substantial or High Transmission Levels (CDC)
Transmission # of counties This week
This Week, 8/15
Last week
Levels
Last week, 8/8 Low 1
4
Moderate 10
20
Substantial 34
42
High 38
17
Updates since last week:
• 1 of 83 counties met low transmission level this
week, a 3 county decrease from last week
• 10 of 83 counties met moderate transmission
classification, a 10 county decrease
• 34 of 83 counties met substantial transmission
classification, an 8 county decrease
• 38 of 83 counties met high transmission
classification, a 21 county increase from last week
Public Health Other Science
National Comparison Spread Severity 62
Response Indicators Round-up 62Comparing CDC community transmission thresholds to MI levels
Case Rate*†
Low A B C D E
MI*Cases per Capita Increasing Within All MERC Regions
Detroit Kalamazoo Traverse City
1000
Grand Rapids Lansing Upper Peninsula
Jackson Saginaw
750
500
250
0
3/1 4/1 5/1 6/1 7/1 8/1 9/1 10/1 11/1 12/1 1/1 2/1 3/1 4/1 5/1 6/1 7/1 8/1
• Case rate trends for all regions are increasing
• Kalamazoo, Jackson, and Saginaw currently have the highest case rates
Public Health Other Science
National Comparison Spread Severity 64
Response Indicators Round-up 64Note: The low number of
Identified COVID-19 Delta Variants by County specimens recently
submitted for sequencing
This week (Aug 16, 2021)* Last week (Aug 9, 2021) limits the ability to
estimate the prevalence
of variants in Michigan
Data last updated Aug 16, 2021 * Delta found in wastewater surveillance samples
Source: MDSS
Public Health Other Science
National Comparison Spread Severity
Response Indicators Round-up 656
Comparing COVID hospitalization growth rates across states
Michigan Wave 2 (Fall/Winter) and Wave 3 (Spring) vs. Other states current summer 2021 waves
800
The growth rate of hospitalizations in
700
other states in this wave appears to be FL
similar to the Michigan growth rates in
Hospitalizations per million population
600
Fall (wave 2) and Spring (wave 3) LA
MS
500 Several states show possible plateau AL
type patterns this week with duration AR
400 of ascent of approximately 7-8 weeks. NV
MO MI Wave 2 (Winter)
300
200
MI Wave 3 (Spring)
100
Updated through Aug 15th, 2021
0
0 10 20 30 40 50 60 70 80 90
Days since beginning of wave (aligned)CDC model projections for
Michigan: increasing
hospitalizations and deaths
• Ensemble model suggests increasing
trends for hospitalizations and deaths
• Uncertainty ranges from flat to
increasing
• Case data projections also range from
flat to increasing (not shown) and recent
data has shown increases
• Individual models shown as grey lines, ensemble shown
in red
Data Sources: CDC mathematical model
forecasting, CovidComplete Data Center model
forecast evaluationsUnderstanding breakthrough cases: as more people are
infected, there will be more cases among both vaccinated
and unvaccinated people
Scenario 2: 2.5% of unvaccinated people infected Scenario 3: 5% of unvaccinated people infected
5 10
Vaccine still More cases in
preventing both groups as More
80% of 9 36 transmission 72 infections
infection increases
18 prevented by
vaccination—
the vaccine is
still working
equally well
Both Scenarios: 90% Vaccinated, Vaccine reduces disease by 80%, 2000 total peopleYou can also read