Who uses NHS Direct? Investigating the impact of ethnicity on the uptake of telephone based healthcare
←
→
Page content transcription
If your browser does not render page correctly, please read the page content below
Cook et al. International Journal for Equity in Health 2014, 13:99
http://www.equityhealthj.com/content/13/1/99

 RESEARCH                                                                                                                                        Open Access

Who uses NHS Direct? Investigating the impact of
ethnicity on the uptake of telephone based
healthcare
Erica J Cook1*†, Gurch Randhawa2†, Shirley Large3, Andy Guppy1†, Angel M Chater4 and Dong Pang2

  Abstract
  Introduction: NHS Direct, a leading telephone healthcare provider worldwide, provided 24/7 health care advice
  and information to the public in England and Wales (1998-2014). The fundamental aim of this service was to
  increase accessibility, however, research has suggested a disparity in the utilisation of this service related to
  ethnicity. This research presents the first national study to determine how the diverse population in England have
  engaged with this service.
  Methods: NHS Direct call data from the combined months of July, 2010 October, 2010, January 2011 and April,
  2011 was analysed (N = 1,342, 245) for all 0845 4647 NHS Direct core service calls in England. Expected usage of
  NHS Direct was determined for each ethnic group of the population by age and gender and compared by actual
  usage using Chi-square analysis. A one-way analysis of variance (ANOVA) was used to determine variations of
  uptake by ethnic group and Index for Multiple Deprivation (IMD) 2010 rank.
  Results: Results confirmed that all mixed ethnic groups (White and Black Caribbean, White and Black African, White
  and Asian) had a higher than expected uptake of NHS Direct which held consistent across all age groups. Lower
  than expected uptake was found for Black (African/Caribbean) and Asian (Bangladeshi/Indian/Chinese) ethnic group
  which held consistent by age and gender. For the Pakistani ethnic group usage was higher than expected in adults
  aged 40 years and older although was lower than expected in younger age groups (0–39).
  Conclusion: Findings support previous research suggesting a variation in usage of NHS Direct influenced by
  ethnicity, which is evidenced on a national level. Further research is now required to examine the underlying
  barriers that contribute to the ethnic variation in uptake of this service.
  Keywords: NHS Direct, Ethnicity, Remote healthcare, Telephone triage, Healthcare equity, Deprivation

Introduction                                                                           replaced by the new non-emergency NHS 111 telephone
NHS Direct, (1998-2014) provided 24/7 nurse-led tele-                                  based service, However, understanding patterns of NHS
phone based health care advice and information [1] to                                  Direct usage provides a useful opportunity to learn valu-
the public in England and Wales. This service supported                                able lessons about telephone healthcare services which
patients to self-manage symptoms, and where applicable,                                can be applied to other similar models of remote health-
directed them to the most appropriate form of care.                                    care delivery [5-8].
NHS Direct soon became a popular service, handling                                       A core aim of NHS Direct was to increase accessibility
around 12,000 calls per day, serving nearly 5 million                                  to healthcare, reducing demand on overstretched NHS
calls per year [2] which was also supported by high levels                             services [1,9]. However, research has revealed a wide vari-
of patient satisfaction [3,4]. NHS Direct has since been                               ation in use by ethnicity, with research suggesting that
                                                                                       NHS Direct is underutilised by ethnic minority groups
                                                                                       [10,11]. Shah and Cook [10] investigated the socio-
* Correspondence: erica.cook@beds.ac.uk
†
 Equal contributors                                                                    economic determinants of A&E and NHS Direct use
1
 Department of Psychology, University of Bedfordshire, Park Square, Luton, UK          through the analysis of 2004–5 British General Household
Full list of author information is available at the end of the article

                                          © 2014 Cook et al.; licensee BioMed Central Ltd. This is an Open Access article distributed under the terms of the Creative
                                          Commons Attribution License (http://creativecommons.org/licenses/by/4.0), which permits unrestricted use, distribution, and
                                          reproduction in any medium, provided the original work is properly credited. The Creative Commons Public Domain
                                          Dedication waiver (http://creativecommons.org/publicdomain/zero/1.0/) applies to the data made available in this article,
                                          unless otherwise stated.
Cook et al. International Journal for Equity in Health 2014, 13:99 Page 2 of 9
http://www.equityhealthj.com/content/13/1/99
Survey. The results suggested that households where the cases missing which were subsequently excluded from
head of the household was not White or born outside the analysis.
United Kingdom (UK) were significantly less likely to use Ethnicity was categorised in line with the census 2001
NHS Direct compared to those of White British ethnic ori- [19] (see Table 1) as these were the same ethnic group-
gin [10]. ings that were used by NHS Direct and the Office for
Investigations of ethnic variation have also uncovered National Statistics (ONS) which allowed for the statis-
an interplay of gender and ethnicity factors which could tical comparison of uptake using population statistics.
impact on the uptake of NHS Direct. Bibi, Attwell, For age, data was split into five age groups, which in-
Fairhurst & Powell [11] analysed NHS Direct call data cluded 0–5 years (N = 262,253; 19.8%), 5–19 years (N =
(2001–2) against the population structure for the City of 166,771; 12.6%), 20–29 years (N = 260,254; 20.3%), 30–
Preston, England. For example, white females used the 39 years (N = 189,429; 14.3%), 40–59 years (N = 231,480;
service more than expected, whereby, females from all 17.5%) and 60 years and above (N = 205,333; 15.5%).
other ethnic groups used the service less than predicted. A Chi-Square goodness of fit test was chosen to com-
However, for males, Black-African, Indian, Pakistani, pare the NHS Direct categorical demographic call data
Bangladeshi, and Asian used NHS Direct more than ex- (ethnicity and ethnicity by age) with general population
pected, with particularly high usage found in Indian and data. Observed (O) frequencies of callers were compared
Pakistani groups. with expected (E) frequencies. Expected frequencies for
Nevertheless, research which has explored the vari- uptake by ethnicity were based on the known percentages
ation of ethnicity have been met by marked criticism. of each ethnic group derived from ONS current data esti-
Firstly, NHS Direct utilisation studies have not consist- mates for population by ethnic group [20] and population
ently reported ethnicity [12]. A reason for this may be by age and ethnic group [21]. To analyse ethnicity by
because most NHS Direct utilisation studies have pub- deprivation unit postcodes of included calls were matched
lished studies using call data pre 2003, the point at to the 2010 Index for Multiple Deprivation (IMD) [22]. A
which NHS Direct began recording ethnicity [13]. More- one-way analysis of variance (ANOVA) was conducted to
over, published studies which have reported ethnicity compare ethnic group by 2010 IMD rankb. All statistics
[10,11,14-17] have relied on small population samples were completed using IBM SPSS Version 21 [23].
using postal survey methods [14,15,17] and has not re- The University of Bedfordshire and NHS Direct ap-
ported significant ethnic variation of use. More rigorous proved the study. NHS ethical approval was obtained from
studies which have explored the data providing details the Essex Research Ethics Committee Ref: 10/H0301/29.
on uptake by ethnicity are now dated [10,11] and have Ethical approval was provided for the retrospective ana-
either been localised studies [11] or relied on non NHS lysis of anonymized data. Whilst individual written or ver-
Direct secondary data [10] both of which have lacked bal consent could not be obtained all patients who phone
national representation. NHS Direct provide on the phone and internet a fair
The presented research therefore endeavours to ex-
plore the impact of gender and ethnicity on the uptake Table 1 2001 Census groupings for ethnicity
of NHS Direct. Through focusing on the national popu- White White: British
lation in England this study aims to provide a more de- White: Irish
tailed understanding of how the diverse population in White: Other White
England have engaged with a telephone based healthcare
Mixed Mixed: White and Black Caribbean
service.
Mixed: White and Black African
Methods Mixed: White and Asian
NHS Direct anonymised call data was collected from the Mixed: Other Mixed
Clinical Assessment System (CAS)a [18] for all 0845 Asian or Asian British Asian: Indian
4647 calls made in England for the combined months of Asian: Pakistani
July 2010, October 2010, January 2011 and April 2011.
Asian: Bangladeshi
There was a total of 1,415,472 calls made, however, all
missing cases were excluded from analysis. Ethnicity by Other Asian
gender was available for 85.3% (N = 1,207,046) of all calls Black or Black British Black Caribbean
with 14.7% (N = 208,426) of cases missing (Males Black African
541,880; Females 665,166). Ethnicity by age was available Other Black
for 1,206,526 (85.2%) of all calls with 14.8% (208,946) of Chinese or other ethnic group Chinese
cases missing, and a total of 1,209,589 cases were avail-
Other
able for ethnicity by deprivation with a total of 205,883Cook et al. International Journal for Equity in Health 2014, 13:99 Page 3 of 9
http://www.equityhealthj.com/content/13/1/99
processing message which clearly states that anonymised African (−42.33) and White Irish (−31.64) and British
call records may be used for research purposes. This mes- (−15.57).
sage provided the caller detailed instructions on how they For females calls were similarly over represented for
can withdraw their data from being used. In the case of all mixed ethnic groups (White and Black Caribbean,
children it is the parents/guardians responsibility to re- White and Black African, White and Asian, and other)
move call records if required. (Table 3). Highest over representation was found for
mixed White and Asian, White and Black African and
Results mixed other with reported standardised residuals of
Ethnicity and gender 445.35, 51.07 and 74.26 respectively.
To identify if the ethnicity of both male and female pa- Similarly, as found for males, under representation
tients was representative of the population in England chi- was found for females who were White (British and
square goodness of fit statistical analysis was performed. Irish), Asian or Asian British (Indian, Pakistani and
Chi-square analysis confirmed that calls were not repre- Bangladeshi), Black or Black British (Caribbean and
sentative of the total population in England for ethnicity African) alongside Chinese subgroups.
distribution for neither males (Χ2 = 109291.10, df = 15, The greatest under representation was found for
p < .001) or females (Χ2 = 215875.52, df = 15, p < .001). Chinese, White British, African and Irish ethnic groups
For males (Table 2) chi square statistics highlighted with standardised residuals of −50.74, −31.24, −39.35
that calls for and on behalf of all mixed ethnic groups and −29.89 respectively.
(White and Black Caribbean, White and Black African,
White and Asian, and other) were higher than expected. Ethnicity and age
Mixed White and Asian ethnic sub-group presented the To identify if the ethnicity of all users across all age groups
highest over representation with a standardised residual was representative of the population in England chi-square
of 305.73. This was followed by mixed (other) and mixed goodness of fit statistical analysis was performed. Chi-
white and Black African with standardised residuals of square analysis confirmed that calls were not represen-
73.94 and 54.74 respectively. tative of the total population in England for patients
However, there was an under representation found on across all age groups including 0–4 years (Χ2 =
behalf of males who were White (British and Irish), Black 19977.48, df = 15, p < .001), 5–19 years (Χ2 = 30603.76,
(African and Caribbean), Asian (Indian, Bangladeshi and df = 15, p < .001), 20–29 years (Χ2 = 70677.71, df = 15,
Pakistani) and Chinese. Chi square analysis suggested the p < .001), 30–39 years (Χ2 = 64118.65, df = 15, p < .001),
lowest representation was found for Chinese (−47.90) 40–59 years (Χ2 = 49390.81, df = 15, p < .001) and patients
Table 2 Chi-square comparison of expected and actual NHS Direct uptake for males compared to the ethnic
distribution of the population of England
ETHNICITY Observed (O) Expected (E) (O-E) (O-E/√E) Uptake rate Sig
White: British 441459 451927.9 −0468.9 −15.57 0.98 ***
White: Irish 3951 6502.6 −2551.6 −31.64 0.61 ***
White: Other 18741 18965.8 −224.8 −1.63 0.99 ***
Mixed: White and Black Caribbean 4190 3251.3 938.7 16.46 1.29 ***
Mixed: White and Black African 2886 1083.8 1802.2 54.74 2.66 ***
Mixed: White and Asian 18623 2709.4 15913.6 305.73 6.87 ***
Mixed: Other 5610 2167.5 3442.5 73.94 2.59 ***
Asian or Asian British: Indian 12702 14088.9 −1386.9 −11.68 0.90 ***
Asian or Asian British: Pakistani 10429 10295.7 133.3 1.31 1.01 NS
Asian or Asian British: Bangladeshi 2450 3793.2 −1343.2 −21.81 0.65 ***
Asian or Asian British: Other 4342 3793.2 548.8 8.91 1.14 ***
Black or Black British: Caribbean 4367 5960.7 −1593.7 −20.64 0.73 ***
Black or Black British: African 4312 8128.2 −3816.2 −42.33 0.53 ***
Black or Black British: Other 1478 1083.8 394.2 11.97 1.36 ***
Other ethnic groups: Chinese 1181 4335.0 −3154.0 −47.90 0.27 ***
Other ethnic group 5159 3793.2 1365.8 22.18 1.36 ***
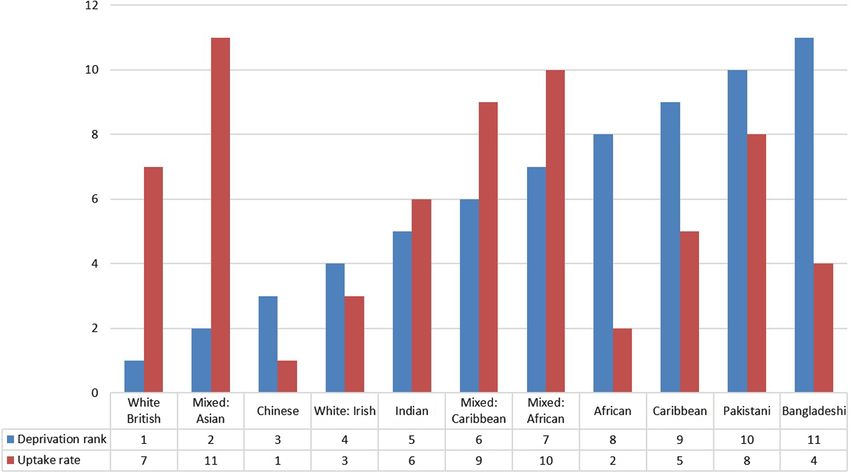
p < 0.001***.Cook et al. International Journal for Equity in Health 2014, 13:99 Page 4 of 9 http://www.equityhealthj.com/content/13/1/99 Table 3 Chi-square comparison of expected and actual NHS Direct uptake for females compared to the ethnic distribution of the population of England ETHNICITY Observed (O) Expected (E) (O-E) (O-E/√E) Uptake rate Sig White: British 534087 557409.1 −3322.1 −31.24 0.96 *** White: Irish 5312 7982.0 −2670.0 −29.89 0.67 *** White: Other 25365 23280.8 2084.2 13.66 1.09 *** Mixed: White and Black Caribbean 5619 3991.0 1628.0 25.77 1.41 *** Mixed: White and Black African 3193 1330.3 1862.7 51.07 2.40 *** Mixed: White and Asian 29009 3325.8 25683.2 445.35 8.72 *** Mixed: Other 6491 2660.7 3830.3 74.26 2.44 *** Asian or Asian British: Indian 15003 16629.2 −1626.2 −12.61 0.90 *** Asian or Asian British: Pakistani 11761 11307.8 453.2 4.26 1.04 *** Asian or Asian British: Bangladeshi 2810 4656.2 −1846.2 −27.06 0.60 *** Asian or Asian British: Other 4946 3991.0 955.0 15.12 1.24 *** Black or Black British: Caribbean 6067 7982.0 −1915.0 −21.43 0.76 *** Black or Black British: African 5515 9312.3 −3797.3 −39.35 0.59 *** Black or Black British: Other 2042 1330.3 711.7 19.51 1.53 *** Other ethnic groups: Chinese 1620 5321.3 −3701.3 −50.74 0.30 *** Other ethnic group 6326 4656.2 1669.8 24.47 1.36 *** p < 0.001***. who were 60 years and older (Χ2 = 6659.98, df = 15, years (0.76), 20–29 years (0.80), and 30–39 years p < .001). (0.86). The pattern continued with over representation Observed usage was divided by expected uptake to de- found in patients aged 40–59 years (1.04) and 60 years termine call rate and standardised residuals were calcu- and older (1.18). lated to provide significance values (Table 4). For White For Black Caribbean patients lower than expected up- British uptake rate was lower than expected for children take rate was found across all ages. The uptake rate ranged aged 0–4 (0.98) and 5–19 (0.97) years old. However, call from 0.72-0.76 (p < .001) in patients aged 0–59 years with rate was either as expected or above for all patients aged the lowest uptake rate found in patients aged 60 years and 19 years and older. Other White ethnic groups (Irish older (0.56, p < .001). Black Africans highlighted lower and White other) showed a variation of uptake by age. than expected uptake rate (0.45-0.52) consistently across For example, higher than expected uptake was found for all age groups (p < .001) showing limited variation of up- calls on behalf of White (other) children aged 0–4 years, take by age group. Finally, Chinese patients highlighted the and White Irish patients aged 0–29 years old. However, lowest uptake compared to all ethnic groups, which lower than expected uptake was revealed in all older age remained consistent across all age groups (p < .001). The groups. For Mixed ethnic groups who consistently lowest uptake rate was found for Chinese patients aged reported a higher than expected uptake across all age 20–29 years (0.18; p < .001) with all other age groups groups. showing an uptake rate range of 0.24-0.35 (p < .001). For Asian (Bangladeshi and Indian) ethnic groups there was a lower than expected uptake rate across all age Ethnicity and deprivation groups (p < .001). Highest uptake rate was found for both A one-way ANOVA was conducted to determine mean Bangladeshi and Indian patients who were 60 years and difference of 2010 IMD rank by ethnicity. The analysis older, with an uptake rate of 0.82 and 0.94 respectively was significant (F(15, 1 209,573) =2416.60 p < .001), (p < .001). However, lowest uptake rate was found in Bonferroni post-hoc tests was used to look at between children aged four years and younger (0.45, p < .001) for group differences. Figure 1 presents the ranked order of Bangladeshi patients and for patients aged 20–29 (0.61, deprivation and ranked order of uptake by ethnic group, p < .001) for Indian patients. whereby a deprivation rank of 1 is the lowest deprived A pattern emerged for Pakistani patients, whereby the rank across all ethnic groups and the uptake rank of 1 is older the patient the higher the uptake rate. For ex- lowest uptake rate rank across all ethnic groups. ample, uptake rate for children aged 0–4 years was 0.66, Bangladeshi (M = 5211; SD = 7432.69) Pakistani (M = which subsequently increased for patients aged 5–19 8188.58; SD = 7666.72), African (M = 9421.21; SD =
http://www.equityhealthj.com/content/13/1/99
                                                                                                                                                                                              Cook et al. International Journal for Equity in Health 2014, 13:99
Table 4 Chi-square comparison of expected and actual NHS Direct uptake for age groups compared to the ethnic distribution of the population of England
Ethnicity                                     0-4                     5-19                    20-29                   30-39                   40-59                   60+
                                              N        Uptake   Sig   N        Uptake   Sig   N        Uptake   Sig   N        Uptake   Sig   N        Uptake   Sig   N        Uptake   Sig
                                                       rate                    rate                    rate                    rate                    rate                    rate
White: British                                185267   0.98     ***   121137   0.97     ***   188761   1.03     ***   130402   1.00     NS    176923   1.00     NS    168110   1.01     *
White: Irish                                  889      1.02     NS    844      1.79     ***   1936     1.36     ***   1444     0.88     ***   1724     0.65     ***   2385     0.64     ***
White: Other                                  13694    2.40     ***   3819     0.98     NS    10170    0.73     ***   9476     0.86     ***   5703     0.80     ***   3528     0.95     ***
Mixed: White and Black Caribbean              3867     1.08     ***   1768     0.83     ***   2287     1.15     ***   1148     1.62     ***   892      1.86     ***   226      1.77     ***
Mixed: White and Black African                2195     1.15     ***   1189     1.81     ***   1478     2.00     ***   662      1.53     ***   502      1.72     ***   99       1.36     ***
Mixed: White and Asian                        9070     1.58     ***   9026     4.74     ***   14467    6.00     ***   9569     8.14     ***   6287     9.15     ***   1217     5.55     ***
Mixed: Other                                  5501     1.63     ***   2154     1.83     ***   2111     1.43     ***   1185     1.52     ***   895      1.72     ***   242      1.33     ***
Asian or Asian British: Indian                5937     0.89     ***   3070     0.80     ***   6392     0.61     ***   5646     0.82     ***   4343     0.80     ***   2285     0.94     **
Asian or Asian British: Pakistani             5268     0.66     ***   3154     0.76     ***   5885     0.80     ***   3899     0.86     ***   2794     1.04     **    1185     1.18     ***
Asian or Asian British: Bangladeshi           1384     0.45     ***   775      0.45     ***   1471     0.49     ***   887      0.49     ***   469      0.52     ***   271      0.82     ***
Asian or Asian British: Other                 2149     0.90     ***   1121     1.04     NS    2165     0.77     ***   1836     0.97     NS    1400     1.02     NS    598      1.17     ***
Black or Black British: Caribbean             1702     0.72     ***   1451     0.85     ***   2447     0.81     ***   1571     0.79     ***   2360     0.76     ***   894      0.56     ***
Black or Black British: African               2324     0.45     ***   1276     0.46     ***   2504     0.44     ***   2062     0.52     ***   1390     0.48     ***   265      0.45     ***
Black or Black British: Other                 774      0.65     ***   547      0.94     NS    876      1.08     *     541      1.30     ***   625      1.50     ***   147      1.61     ***
Other ethnic groups: Chinese                  585      0.33     ***   261      0.30     ***   799      0.18     ***   605      0.23     ***   365      0.24     ***   172      0.35     ***
Other ethnic group                            2355     1.71     ***   1182     1.27     ***   2838     0.75     ***   2259     0.92     ***   1744     1.12     ***   972      2.31     ***
p < 0.05* p < 0.01** p < 0.001*** NS > .05.

                                                                                                                                                                                                                                Page 5 of 9
Cook et al. International Journal for Equity in Health 2014, 13:99 Page 6 of 9
http://www.equityhealthj.com/content/13/1/99
Figure 1 Deprivation and uptake rank across all ethnic groups.
78.27) and Caribbean (M = 9077.79; SD = 7007.32) ethnic [10,11]. However, this study revealed that this ethnic group
groups had significantly higher levels of deprivation had lower representation than expected. This finding may
compared to all other ethnic groups (p < .001). All of an artifact of age, deprivation and geographic factors which
these groups (except Pakistani for older age groups) pre- have been found to impact on uptake of this service. For
sented a lower than expected uptake rate. example, the older population have been shown to be the
However, in contrast Chinese (M = 15081.26; SD = lowest users and yet represent a large section of the na-
9272.80) and Indian ethnic groups (M = 13380.35; SD = tional population [17]. Research has also shown that there
8703.52) who had lower than expected uptake rate of is a variation of usage of NHS Direct by deprivation and
NHS Direct had lower levels of deprivation. White geographic location [12,24,25]. Low representation was
British (M = 15789.55 SD = 9300.28) and Mixed White also found for Asian and Black ethnic minority groups,
and Asian (M = 15627.60; SD = 9352.58) who represent with lowest observed usage found for Chinese and Black
expected or higher than expected uptake of NHS Direct African male and female ethnic sub-groups. This finding is
across all age groups had the lowest levels of deprivation supported by previous research which has also highlighted
compared to all ethnic groups (p < .001). lower observed uptake of NHS Direct in ethnic minority
groups that were of Asian and Black ethnic origin [10].
Discussion For all White ethnic groups there was a variation of
Main findings of this study uptake by age. For example, White British uptake rate
The research presented here highlights that across a na- was lower than expected for calls relating to young chil-
tional representation of NHS Direct users there is a vari- dren (0–4) with expected or higher than expected usage
ation to uptake by ethnicity which holds consistent by found for all other age groups. Conversely, analysis re-
gender. The findings revealed that there was higher rep- vealed that Irish and White Other ethnic groups showed
resentation of uptake for all mixed ethnic groups (White highest uptake in calls relating to young children (0–4)
and Black Caribbean, White and Black African, White with lower than expected uptake was revealed in all older
and Asian, and other) for both males and females. This age groups.
was particularly evident for the mixed White and Asian The findings also revealed that the lowest users of
which accounted for the greatest over representation NHS Direct (Chinese, Bangladeshi, Black African and
across all ethnic groups. Caribbean) had low uptake rates across all age groups.
The White British population in England have been con- However, interestingly, whilst the Pakistani ethnic group
sistently shown to be the highest users of NHS Direct showed higher than expected uptake across both gendersCook et al. International Journal for Equity in Health 2014, 13:99 Page 7 of 9
http://www.equityhealthj.com/content/13/1/99
uptake varied by age group, whereby increased age was as- ethnic groups. For example, whilst the Pakistani ethnic
sociated with increased uptake. Whilst previous research group have shown higher than expected uptake this is not
has suggested that uptake of NHS Direct is lower in older consistent across age groups with lower than expected
age groups the impact of ethnicity has not been evaluated, uptake found for younger age groups. Therefore, it re-
therefore this has emerged as a positive public health find- mains an important priority to determine accessibility is-
ing [24,26]. Moreover, this finding provides a useful avenue sues for minority ethnic groups. Particularly for South
for further research to understand why uptake is lower Asian (Indian/Bangladeshi/Pakistani) and Black (African/
than expected in younger age groups (0–39). Caribbean) ethnic sub-groups as they continue to repre-
For deprivation it was found that the lowest users of sent the highest users of both primary healthcare services
NHS Direct had the highest levels of deprivation and the for both in-hours and out-of-hours healthcare [30-32].
highest users of NHS Direct had the lowest levels of The differences in uptake in previous studies that have
deprivation (White British and Mixed White and Asian). looked at healthcare utilisation have related ethnic varia-
However, this was not the case for Indian and Chinese tions to differences in health-seeking behaviour, or diffi-
ethnic groups who despite having lower levels of culties in accessing high-quality primary care services
deprivation they demonstrated lower than expected uptake [32]. The fact that NHS Direct provided an interpreter
rate which held consistent for age and gender. Whilst it is service through ‘language line’ may not be well recog-
know that deprivation has impacted on NHS Direct up- nised and it is unclear how this was promoted. There-
take [24,25] the current research highlights variation of fore, future research could explore the knowledge of this
uptake by levels of deprivation related to ethnicity. in communities who are not native English speakers.
Moreover, further exploration is needed to understand
What is already known on this topic the fundamental barriers and facilitators which impact
Previous research has highlighted that individual’s from on utilisation of telephone based healthcare and essen-
minority ethnic groups within the UK have experienced tially the factors that may impact on the uptake of NHS
poorer health and barriers in accessing certain health Direct which will be applicable to the new ‘111’ service.
care services [27,28]. Furthermore, different levels of use
of healthcare services are evident, which has become an Limitations of this study
important priority for governments worldwide to over- There are some limitations that should be considered.
come [29]. However, there has been limited research There was a significant proportion of data missing which
which has explored ethnic distribution on the uptake of was excluded from analysis. For example, there was a total
NHS Direct. Previous studies have highlighted that this of 208,426 cases missing for ethnicity and gender and
service is under-used by certain ethnic groups with this 208,946 cases missing for ethnicity and age. Missing data
difference depending on gender [11]. For example, fe- represents a key challenge to the analysis of secondary data
males from all ethnic groups combined have been asso- [33] and as such a detailed overview of data missing by
ciated with lower uptake. Conversely, males who are ethnicity and gender was made before deciding on exclu-
Black African, Indian, Pakistani, Bangladeshi and Asian sion. After investigation the main reason for the missing
groups have been associated with higher uptake [11]. call data which explained 80.5% (N = 167,782) of all miss-
ing cases for gender and ethnicity was due to ‘quick calls’.
What this study adds These are calls which are mainly dealt with by the health
This research attempts to engage with current debate in advisor whereby no further action is needed. After exclud-
how individuals engage with telephone based healthcare, ing these calls there was a total of 40,644 calls missing
and highlights how a relatively new innovative service which only contributed to 3.0% of the total data. Missing
has engaged ethnic sub-groups of the population since cases can also be attributed urgent or emergency calls, or
its inception. This is the first study that has adopted a periods of very high demand when question deliberately
national sample to examine how ethnicity by age, gender not asked. After a detailed validation of the remaining
and deprivation interact to explain uptake of NHS Dir- missing cases they were not shown to be systematically dif-
ect, a national telephone based healthcare service. ferent from those with complete data. Therefore it was
In contrast to previous research, this study has uncov- concluded that these calls were Missing Completely at
ered that mixed ethnic groups are engaging with this Random (MCAR) and could be an artefact of data entry
service more than expected, with this finding consistent error and consistency in data recording practices across
across both genders. This study has also provided useful the NHS Direct call centres. Nevertheless, there remained
information about how uptake across the diverse popu- a large number of calls included in analysis which repre-
lation in England is influenced by age. Whilst there are sented over 85% of all calls made across the four months.
ethnic groups who are not engaging with this service Therefore the excluded calls was not felt to impact on the
across all age groups this finding is not consistent for all statistical interpretation of analysis.Cook et al. International Journal for Equity in Health 2014, 13:99 Page 8 of 9
http://www.equityhealthj.com/content/13/1/99
The way ethnicity is measured has changed from the Acknowledgements
2001 census [19] to the 2011 census [34]. The latest cen- We would like to thank NHS Direct for the support of this study.
sus now includes ‘Gypsy or Irish Traveller’ with a write Author details
in option for ‘other’ categories. Whilst it would have 1
Department of Psychology, University of Bedfordshire, Park Square, Luton, UK.
2
been preferable to use more accurate and current popu- Institute for Health Research, University of Bedfordshire, Putteridge Bury, Hitchin
Road, Luton, UK. 3NHS England, Horley, Surrey, UK. 4UCL School of Pharmacy,
lation statistics the first data extraction was before the BMA House, Tavistock Square, London, UK.
2011 census so the data was restricted to the 2001 cen-
sus ethnicity groupings. Whilst the current research has Received: 1 May 2014 Accepted: 12 October 2014
explored ethnicity by gender, ethnicity by age and ethni-
city by deprivation it has not explored the interaction of
ethnicity by age by deprivation. This would provide a References
1. Department of Health: A modern and Dependable NHS. London: HMSO; 1997.
useful avenue for future research to explore if older
2. Winter surge in patients going online for trusted health information.
people from certain ethnic backgrounds behave differ- [https://www.gov.uk/government/news/winter-surge-in-patients-going-
ently to second and third generations who are younger. online-for-trusted-health-information]
3. George S: NHS direct audited: customer satisfaction, but at what price.
BMJ 2002, 324:558–559.
Conclusions 4. O'Cathain A, Munro J, Nicholl J, Knowles E: How helpful is NHS Direct?
This research has provided a fuller understanding of how Postal survey of callers. BMJ 2000, 320:1035.
5. College of Nurses of Ontario: Practice Guideline: Telepractice. Ontorio:
the population in England engage with NHS Direct, Standards of Care; 2009.
highlighting that there are certain sections of the popula- 6. Stacey D, Noorani HZ, Fisher A, Robinson D, Joyce J, Pong RW: Telephone
tion who were found to be low users compared to other Triage Services: Systematic Review and a Survey of Canadian Call Centre
Programs. Ottawa: Canadian Coordinating Office for Health Technology
sections of the population. Importantly, this research has Assessment; 2003.
uncovered that that both male and female Pakistani’s 7. Roland M: Nurse-led telephone advice. Med J Aust 2002, 176:96.
alongside mixed ethnic groups have shown higher uptake 8. Goodwin S: Telephone nursing: an emerging practice area. Nurs Leadersh
2007, 20:37–45.
than previous research, demonstrating a positive public 9. Department of Health: A Plan for Investment- A Plan for Reform. London:
health finding. This has important implications for tele- HMSO; 2000.
phone based healthcare both nationally, including the 10. Shah SM, Cook DG: Socio-economic determinants of casualty and NHS
Direct use. J Publ Health 2008, 30:75–81.
future national health applications, such as the new
11. Bibi M, Attwell RW, Fairhurst RJ, Powell SC: The usage of NHS Direct by
NHS 111 service [35] and internationally where telephone different ethnic and gender groups in an urban population. J Chronic Dis
based health care systems have become the model of 2008, 23:235–241.
12. Cook E: Who uses NHS Direct? Factors that impact on telephone based
international healthcare e.g. Ontario in Canada [5,6],
healthcare. In: University of Bedfordshire, Institute for Health Research; 2013.
and Health Direct in Australia [7]. Research is now 13. Cooper D, Chinemana F: NHS Direct derived data: an exciting new
needed to explore ethnic sub-groups of the population opportunity or an epidemiological headache? J Publ Health 2004, 26:158–160.
that are considered low users of NHS Direct to explore 14. Byrne G, Morgan J, Kendall S, Saberi D: A survey of NHS Direct callers’ use
of health services and the interventions they received. Prim Health Care
perceptions and attitudes towards telephone based health- Res Dev 2007, 8:91–100.
care to determine barriers and facilitators of uptake. 15. Ring F, Jones M: NHS Direct usage in a GP population of children under
5 years: is NHS Direct used by people with the greatest health need?
Br J Gen Pract 2004, 54:211–213.
Endnotes 16. Goode J, Hanlon G, Luff D, O'Cathain A, Strangleman T, Greatbatch D: Male
a callers to NHS Direct: the assertive carer, the new dad and the reluctant
CAS is an evidence-based algorithm tool used by
patient. Health 2004, 8:311–328.
NHS Direct nurses to assist the triage of patients. 17. David OJ: NHS Direct and older people. Age Ageing 2005, 34:499–501.
b
All 32,482 lower super output areas in the UK are put 18. Hanlon G: NHS Direct: Patient Empowerment or Dependency? Swindon:
into a rank order based on their 2010 IMD score. A rank Economic and Social Research Council; 2004.
19. Census: 2001. http://www.neighbourhood.statistics.gov.uk/dissemination/.
of 1 is the most deprived. 20. ONS: Population Estimates Analysis mid 2007. In: London: Office for
National Statistics; 2009.
Abbreviations 21. ONS: Table EE4, Population Estimates by Ethnic Group. In: London: Office
ANOVA: Analysis of variance; CAS: Clinical Assessment System; IMD: Index for for National Statistics; 2011.
Multiple Deprivation; MCAR: Missing Completely At Random; UK: United 22. Department for Communities and Local Government: The English Indices of
Kingdom. Deprivation 2010. London: Department for Communities and Local
Government; 2011.
Competing interests 23. IBM: IBM SPSS Statistics for Windows, Version 21.0. In: New York: IBM;
This research was jointly funded by the University of Bedfordshire and NHS 2012.
Direct. 24. Cook E, Randhawa G, Large S, Guppy A, Chater A: A UK case study of who
uses NHS Direct? Investigating the impact of age, gender and
Authors’ contributions deprivation on the utilisation of NHS Direct. Telemed J E Health 2012,
All authors contributed of the study conception/design. EC, AG, GR, SL 18:693–698.
contributed to the data collection. EC, AG, DP, AC conducted the data 25. Cook E, Randhawa G, Large S, Guppy A, Chater A: Who uses telephone
analysis, critically revised the article and reviewed the draft of the article. based helplines? Relating deprivation indices to users of NHS Direct.
All authors read and approved the final manuscript. Health Policy Technol 2013, 2:69–74.Cook et al. International Journal for Equity in Health 2014, 13:99 Page 9 of 9
http://www.equityhealthj.com/content/13/1/99
26. Hsu W, Bath PA, Large S, Williams S: Older people’s use of NHS Direct. Age
Ageing 2011, 40:335–340.
27. Hunt SM, Bhopal B: Self report in clinical and epidemiological studies
with non-English speakers: the challenge of language and culture.
J Epidemiol Community Health 2004, 58:618–622.
28. Acheson D: Independent Inquiry into Inequalities in Health. London: HMSO;
1998.
29. Mackenbach J, Meerding WJ, Kunst A: Economic Implications of Socio-Economic
Inequalities in Health in the European Union. Luxemborg: European Communities;
2007.
30. Balarajan R, Yuen P, Raleigh VS: Ethnic differences in general practitioner
consultations. BMJ 1989, 299:958–960.
31. Campbell SM, Rowland MO: Why do people consult the doctor? Fam Pract
1998, 13:75–83.
32. Netuveli G, Huwitz B, Levy M, Fletcher M, Barnes G, Durham SR, Sheikh A:
Ethnic variations in UK asthma frequency, morbidity, and health-service
use: a systematic review and meta-analysis. Lancet 2005, 365:312–317.
33. Langkamp DL, Lehman A, Lemeshow S: Techniques for handling missing
data in secondary analyses of large surveys. Acad Pediatr 2010, 10:205–210.
34. Census: Who we are, how we live, What we do. In: 2011. http://www.ons.
gov.uk/ons/guide-method/census/2011/index.html?utm_source=LCRN%
20News%20Service&utm_campaign=2da3bf9763-
LCRN_Resource_eNews_Volume_2_Issue_42_10_2011&utm_medium=email.
35. 111 - The new number for the future of non-emergency health services.
In: http://webarchive.nationalarchives.gov.uk/+/www.dh.gov.uk/en/
MediaCentre/Pressreleases/DH_118861.
doi:10.1186/s12939-014-0099-x
Cite this article as: Cook et al.: Who uses NHS Direct? Investigating the
impact of ethnicity on the uptake of telephone based healthcare.
International Journal for Equity in Health 2014 13:99.
Submit your next manuscript to BioMed Central
and take full advantage of:
• Convenient online submission
• Thorough peer review
• No space constraints or color figure charges
• Immediate publication on acceptance
• Inclusion in PubMed, CAS, Scopus and Google Scholar
• Research which is freely available for redistribution
Submit your manuscript at
www.biomedcentral.com/submitYou can also read