Air View Data on the spatial distribution of air pollution in Copenhagen
←
→
Page content transcription
If your browser does not render page correctly, please read the page content below
Air View Data on the spatial distribution of
air pollution in Copenhagen

Scientific note from DCE – Danish Centre for Environment and Energy   Date: 26. May 2021 | 40
Data sheet

                                Scientific note from DCE – Danish Centre for Environment and Energy

                 Category:      Scientific Advisory Report

                       Title:   Air View Data on the spatial variability of air pollution in Copenhagen

                   Authors:     Thomas Ellermann, Jibran Khan, Matthias Ketzel, Steen Solvang Jensen, and Ole
                                Hertel
                 Institution:   Department of Environmental Science

                 Referee(s):    Andreas Massling
    Quality assurance, DCE:     Vibeke Vestergaard Nielsen
              Linguistic QA:    Vibeke Vestergaard Nielsen

             Please cite as:    Ellermann, T., Khan, J., Ketzel, M., Jensen, S.S. & Hertel, O. 2021. Air View Data on the
                                spatial distribution of air pollution in Copenhagen. Aarhus University, DCE - Danish
                                Centre for Environment and Energy, 27s. – Scientific note no. 2021|40
                                https://dce.au.dk/fileadmin/dce.au.dk/Udgivelser/Notater_2021/N2021_40.pdf

                                Reproduction permitted provided the source is explicitly acknowledged

         Front page photo:      Thomas Hansen

         Number of pages:       27

2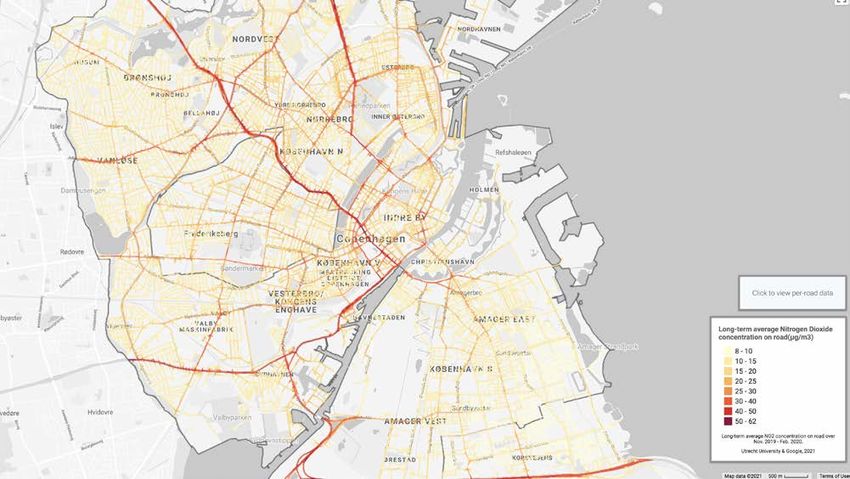
Contents

Key Messages                                                4

Dansk sammenfatning                                        6

1   Introduction                                           9

2   DCE’s involvement in production of CAV                 10

3   Short description of method                            11
    3.1   Measurements                                     11
    3.2   Model calculations                               12
    3.3   Mixed model calculations                         12

4   Results                                                13

5   Comparison with measurements at monitoring stations    17

6   Comparison between CAV and DCE’s Air quality on your
    street                                                 23

7   Reference                                              27

                                                            3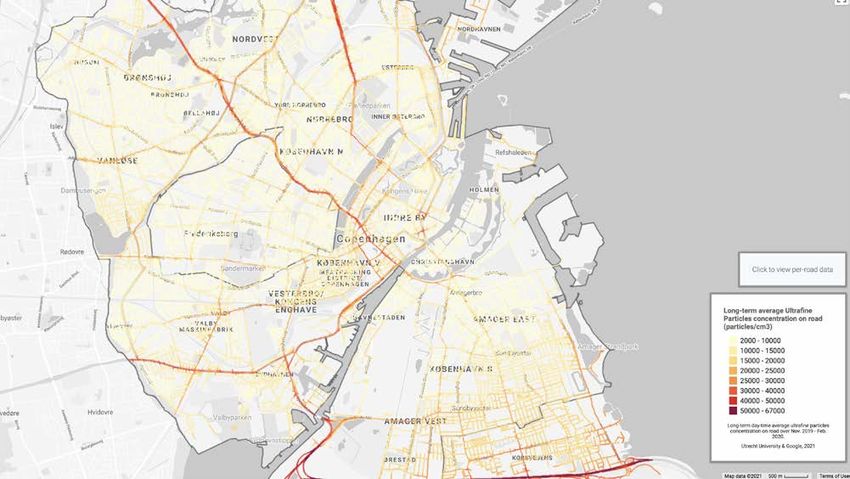
Key Messages

    Since 2018 DCE – Danish Center for Environment and Energy has cooperated
    with Utrecht University, Copenhagen Municipality and Google on prepara-
    tion of new data on the spatial distribution of the concentrations of nitrogen
    dioxide, black carbon and ultrafine particles in Copenhagen, Frederiksberg
    and Tårnby municipalities. This data, called Copenhagen Air View Data
    (CAV), provides a valuable additional contribution to existing knowledge on
    the spatial distribution of air pollution in the Copenhagen area. The Copen-
    hagen Air View Data was produced using a combination of short term meas-
    urements with the Google Street View Car and model calculations using
    Utrecht University’s Land-Use Regression air pollution model. The data is
    available at: https://insights.sustainability.google/labs/airquality

    The key messages from this work are as follows:

    • The main value of the Copenhagen Air View Data is the new information
      provided regarding the high-resolution spatial distribution of the health
      hazardous nitrogen dioxide, black carbon and ultrafine particles. All these
      pollutants have been associated with negative health effects.
    • The results of the project show the highest concentrations of nitrogen di-
      oxide, black carbon and ultrafine particles at the major roads while the
      lowest concentrations are in residential areas with relatively low traffic in-
      tensity. This pattern is expected since traffic is one of the most important
      emission sources for these air pollution components in cities.
    • The Copenhagen Air View Data provide average concentrations for the
      period from October 2018 to March 2020. For nitrogen dioxide, data repre-
      sents the annual average. For ultrafine particles and black carbon, data rep-
      resents working day daytime averages that are estimated to be about 20%
      higher than the annual average.
    • The Copenhagen Air View Data are based on measurements carried out
      on the traffic lanes and data are therefore estimated to be 20-30% higher
      than the results from the DCE monitoring stations in the Danish Air Qual-
      ity Monitoring Program under NOVANA where the street monitoring sta-
      tions are placed on the roadside. However, this correction factor is uncer-
      tain and will depend on local conditions like street configuration, building
      facades etc.
    • The Copenhagen Air View data cannot be used to assess compliance with
      the limit value of nitrogen dioxide. The EU directive specifies that traffic
      lanes are not covered by the limit values and therefore measurements to
      assess compliance cannot be carried out on the traffic lanes. There are no
      limit values for black carbon and ultrafine particles.
    • The Copenhagen Air View data on concentration levels of nitrogen dioxide
      are in good agreement with the results from the DCE monitoring stations
      when the difference between meaurements on the traffice lanes and at the
      roadside is taken into account.
    • The Copenhagen Air View Data on ultrafine particles cannot be directly
      compared to the results from the DCE monitoring stations. Primarily, there
      is systematic difference between measurements on the traffic lanes and at
      roadside and systematic difference between the calculations of averages.

4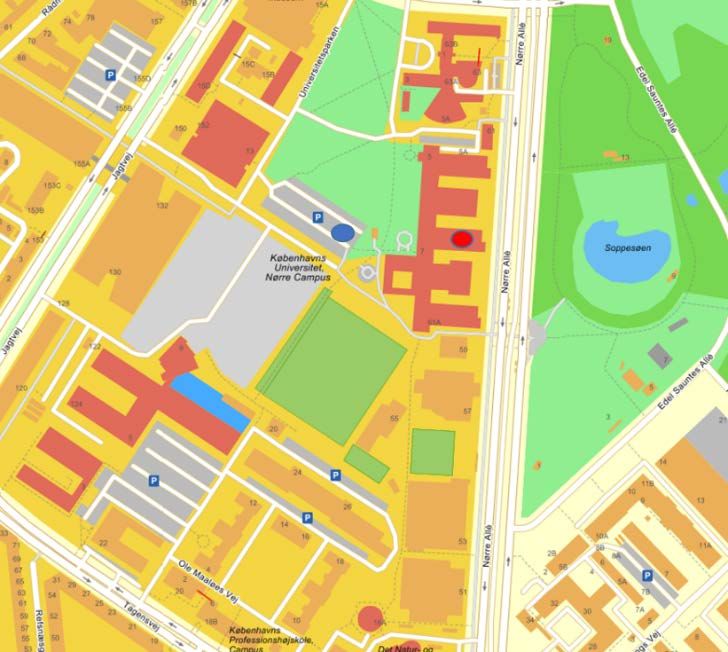
Copenhagen Air View Data represents working day daytime averages
   while the results from the DCE monitoring stations represents annual av-
   erages. Additionally, the concentrations of ultrafine particles are higher
   than the measurements from the DCE monitoring stations by approxi-
   mately a factor of two. The Copenhagen Air View Data are higher than
   both the results from the Danish Air Quality Monitoring Program and
   from the Copenhagen airport project. This indicate that the Copenhagen
   Air View Data might overestimate the concentrations. However, the ob-
   served difference probably also reflects that it is very difficult to carry out
   accurate measurements of the small particles in the range below 20 nm.
• The Copenhagen Air View Data on black carbon (BC) cannot be directly
  compared to the results from the monitoring stations of elemental carbon
  (EC). As for ultrafine particles there is systematic difference due to differ-
  ence in measurement location (traffic lanes versus road side) and in calcu-
  lation of average concentrations (working day daytime versus annual av-
  erage). Additionly, Copenhagen Air View Data provides data for the con-
  centrations of black carbon while the measurements at the monitoring sta-
  tions determine the amount of particulate elemental carbon. Black carbon
  (BC) and elemental carbon (EC) are both a measure of soot particles pro-
  duced in combustion processes (i.e. road traffic) but due to different meas-
  urement principles, they cannot be directly compared. The difference (fac-
  tor of two to three) between the Copenhagen Air View Data for black car-
  bon and the monitoring results for elemental carbon is most likely due to
  the use of two different parameters. However, more measurements are
  needed to clarify the reasons for the difference observed between the Co-
  penhagen Air View Data and results from the monitoring stations.
• The elevated concentrations of ultrafine particles seen on the eastern part
  of Amager are most likely due to emissions from Copenhagen Airport.
  However, the model calculations of the contribution from Copenhagen
  Airport have been carried out using a simplified method compared the the
  more     advanced     physical-chemical      dispersion   models.      More
  measurements arround the airport and use of detailed dispersion models
  are therefore needed in order to verify to what distances the emissions
  from the airport significantly contribute to the concentrations of ultrafine
  particles.
• A comparison between Copenhagen Air View Data and DCE’s air
  pollution data for 2019 on address level in Copenhagen (Air Quality at
  Your Street; http://luftenpaadinvej.au.dk) show fairly good agreement
  for nitrogen dioxide both with respect to the concentration levels and the
  spatial variation. The comparison shows furthermore that there is fairly
  good agreement on the spatial variation for black carbon but here the
  concentration levels shown by the Copenhagen Air View Data are
  considerably higher than the results from Air Quality at Your Street. For
  ultrafine particles there is no correlation between Copenhagen Air View
  Data and data from Air Quality at Your Street. One reason for this is that
  Air Quality at Your Street overestimates ultrafine particles at urban
  background and rural areas, although there is good agreement at street
  level af H.C. Andersens Boulevard. Other reasons for the missing
  correlation are that ultrafine particles is a very complex parameter that it
  is very difficult to accurately measure and model espeacially for particles
  under 20 nm. More research is needed to improve both measurements and
  modelling of ultrafine particles.

                                                                                5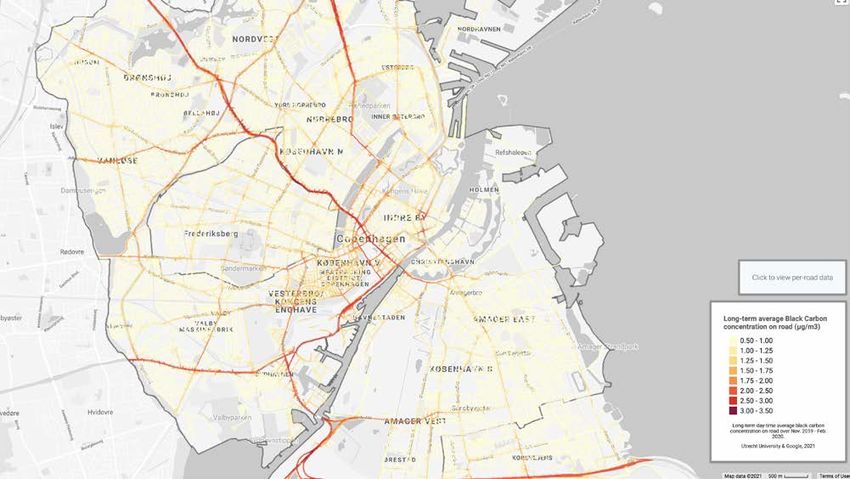
Dansk sammenfatning

    DCE - Nationalt Center for Miljø og Energi ved Aarhus Universitet har siden
    2018 samarbejdet med Utrecht Universitet, Københavns Kommune og Google
    om udarbejdelse af nye data for den geografiske fordeling af luftkoncentrati-
    onerne af kvælstofdioxid, black carbon og ultrafine partikler i Københavns
    Kommune, Frederiksberg Kommune og Tårnby Kommune. Disse data, kaldet
    Copenhagen Air View Data (CAV), giver værdifuld ny viden, som supplerer
    den eksisterende viden om den geografiske fordeling af luftforurening i Kø-
    benhavnsområdet.

    De nye data offentliggøres den 26. maj 2021 i form af tre interaktive kort, som
    viser den geografiske fordeling af kvælstofdioxid, black carbon og ultrafine
    partikler (https://insights.sustainability.google/labs/airquality). Parallelt
    hermed offentliggør DCE opdaterede data for 2019 for ”Luften På Din Vej”
    med modelberegning af luftkvaliteten på adresseniveau i hele Danmark
    (http://luftenpaadinvej.au.dk).

    DCE har deltaget i flere aspekter af arbejdet, herunder selve arbejdet med må-
    lingerne med servicering af instrumenter og deltagelse i en arbejdsgruppe
    sammen med Utrecht Universitet, Københavns Kommune og Google. DCE
    har endvidere medvirket til arbejdet omkring modelberegningerne samt tolk-
    ning og formidling af resultaterne. Utrecht Universitet har haft hovedansvaret
    for de omfattende målinger og modelberegninger ligesom de har haft ansva-
    ret for kvalitetssikring af resultaterne.

    Data bag kortene er udarbejdet ved hjælp af en kombination af målinger og
    modelberegninger. Målingerne er udført med en Google Street View Car ud-
    styret med instrumenter til måling af de tre luftforureningskomponenter. Bi-
    len har i et fastlagt mønster gennemtravlet gaderne i de tre kommuner. Må-
    lingerne er foretaget fra oktober 2018 til marts 2020. Målingerne er opdelt i 50
    meters gadesegmenter, hvor der for hvert gadesegment typisk er foretaget
    målinger i omkring 30 sekunder til nogle få minutter ad typisk fire til seks
    omgange fordelt ud over måleperioden. Målingerne giver derfor en form for
    snapshot af luftkoncentrationerne for de tre luftforureningskomponenter. Re-
    sultaterne fra de mange målinger kombineres herefter med modelberegninger
    udført med Utrecht Universitets luftkvalitetsmodel (Land-use Regression mo-
    del, såkaldt LUR model), og det er disse data som betegnes Copenhagen Air
    View Data. Data angiver middelværdier for måleperioden, hvilket til en god
    tilnærmelse kan sammenlignes med årsmiddelværdierne for 2019.

    For kvælstofdioxid viser kortet middelværdier baseret på målingerne med bi-
    len i selve trafikken. Af denne årsag er resultaterne for kvælstofdioxid fra Co-
    penhagen Air View Data omkring 20-30% højere end resultaterne fra DCE’s
    gademålestationer i det danske luftkvalitetsovervågningsprogram under NO-
    VANA. Denne systematiske forskel skyldes, at koncentrationerne er højere på
    vejbanen, hvor målebilen er tæt på udledningerne fra andre biler, mens DCE’s
    målestationer ved vejsiden er længere væk, hvor fortynding giver lavere kon-
    centrationer.

    For black carbon og ultrafine partikler viser kortene middelværdier, som lige-
    ledes er omkring 20-30% højere end resultaterne fra DCE’s gademålestationer,

6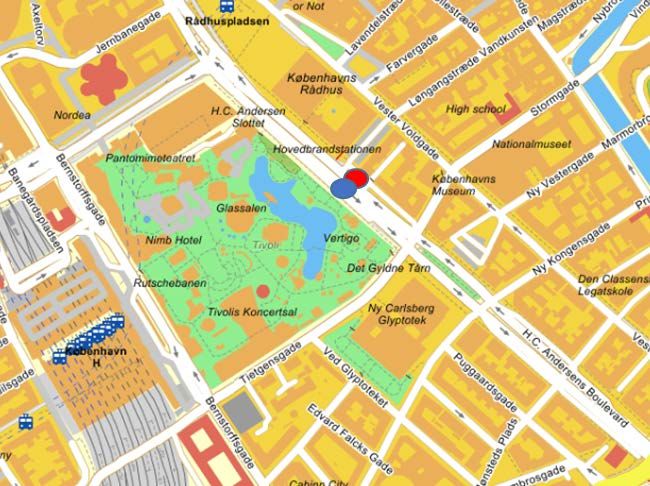
som følge af den systematiske forskel mellem målinger i trafikken og ved vej-
siden. Middelværdierne fra Copenhagen Air View Data repræsenterer endvi-
dere ikke selve årsmiddelværdien, men middelværdien for hverdage i dagti-
merne. Dette giver også en systematisk forskel mellem årsmiddelværdierne
fra DCE’s målestationer og Copenhagen Air View Data. Ud fra målingerne
ved DCE’s målestationer vurderes at dette giver en yderligere forskel på om-
kring 20% mellem Copenhagen Air View data og data fra DCE’s gademåle-
stationer. Samlet set vil der derfor være omkring 45% til 55% forskel mellem
kortenes værdier og resultaterne fra DCE’s målestationer. Der er stor usikker-
hed på vurderingen af den systematiske forskel mellem kortenes værdier og
DCE´s måleresultater.

DCE’s hovedbudskaber fra arbejdet er følgende:

• Copenhagen Air View Data er et værdifuldt supplement til den eksiste-
  rende viden om den geografiske variation af luftforureningen med kvæl-
  stofdioxid, black carbon og ultrafine partikler i Københavnsområdet. De
  tre luftforureningskomponenter er alle koblet til de negative helbredsef-
  fekter af luftforureningen.
• De højeste koncentrationer af kvælstofdioxid, black carbon og ultrafine
  partikler ses ved de største veje, mens de laveste koncentrationer ses i bo-
  ligområder. Dette mønster er forventeligt, da trafik er en af de vigtigste
  kilder til udledninger af disse tre luftforureningskomponenter i danske
  byer.
• Copenhagen Air View Data er et gennemsnit for perioden fra oktober 2018
  til marts 2020. For kvælstofdioxid repræsenterer data årsmiddelværdien.
• For black carbon og ultrafine partikler repræsenterer resultaterne middel-
  værdi for hverdage i dagtimerne. Det er skønnet ud fra analyse af målin-
  gerne på DCE’s målestationer, at dette betyder, at resultaterne for black
  carbon og ultrafine partikler fra Copenhagen Air View vil være omkring
  20% højere end årsmiddelværdierne fra DCE’s målestationer.
• Copenhagen Air View Data er baseret på målinger udført i selve trafikken.
  Resultaterne skønnes derfor at være 20-30% højere end resultaterne fra
  DCE’s gademålestationer i det danske luftkvalitetsmåleprogram, hvor må-
  lestationerne er placeret mellem vejbanerne og husfacaderne.
• Resultaterne kan ikke anvendes til at vurdere overholdelse af EU’s græn-
  seværdier for kvælstofdioxid. EU-direktivet (2008/50/EF) angiver, at vej-
  banerne ikke er omfattet af grænseværdierne og at målingerne, som an-
  vendes til vurdering af overholdelse af grænseværdierne, ikke må foreta-
  ges på vejbanerne. Der er ingen grænseværdier for koncentrationerne af
  black carbon og ultrafine partikler i udeluft.
• Koncentrationsniveauerne for kvælstofdioxid er i god overensstemmelse
  med resultaterne fra målestationerne, når der tages hensyn til forskellen
  mellem målingerne i trafikken på vejbanerne og målingerne ved siden af
  selve vejen.
• Copenhagen Air View Data for ultrafine partikler kan ikke sammenlignes
  direkte med resultaterne fra målestationerne. Dels er der ovennævnte sy-
  stematiske forskelle i målested og beregning af gennemsnit. Dels giver Co-
  penhagen Air View Data koncentrationsniveauer som er omkring en fak-
  tor to højere end resultaterne fra målestationerne. Copenhagen Air View
  data er højere end både resultaterne fra det danske luftkvalitetsmålepro-
  gram og målingerne i lufthavnen, hvilket indikerer at Copenhagen Air

                                                                            7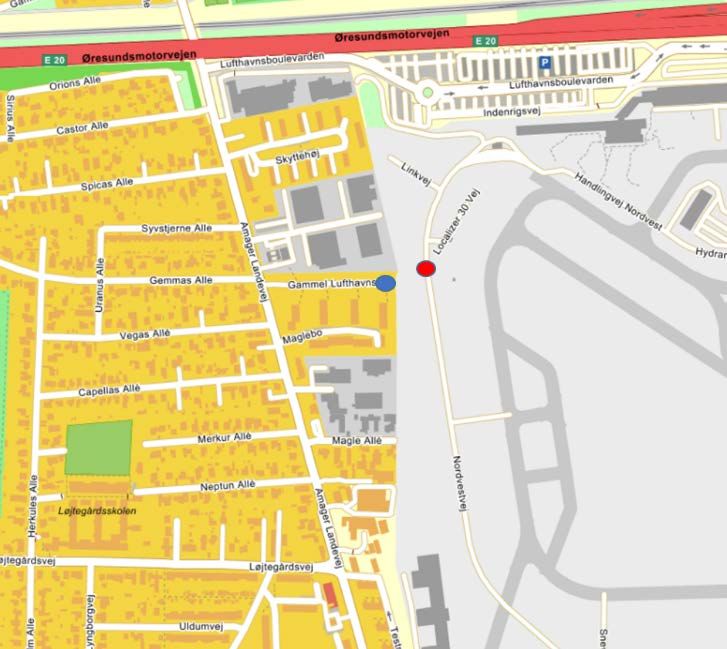
View Data kan være for høje. Den observerede forskel skyldes formentligt
       også, at det er meget svært at udføre nøjagtige målinger af antallet af par-
       tikler i området under 20 nm.
    • Copenhagen Air View Data for black carbon kan ikke sammenlignes di-
      rekte med resultaterne fra målestationerne. Som for ultrafine partikler er
      der de systematiske forskelle mellem målested og beregning af gennem-
      snit. Men derudover er der forskel i målemetode, da der ved DCE’s måle-
      stationer måles elementært kulstof, mens Copenhagen Air View Data er
      baseret på målinger af black carbon. Både elementært kulstof og black car-
      bon er et udtryk for sodpartikler, som stammer fra udledninger fra for-
      brændingsprocesser (fx vejtrafik), men grundet forskellige målemetoder,
      så kan de to parametre ikke sammenlignes direkte. Den relativt store for-
      skel som observeres mellem resultaterne fra Copenhagen Air View Data
      og målestationerne kan skyldes forskellen mellem de to forskellige para-
      metre. Der er derfor behov for yderligere målinger for at få mere viden om
      forholdet mellem elementært kulstof og black carbon.
    • På den østlige del af Amager observeres forhøjede koncentrationer af ul-
      trafine partikler. Dette skyldes mest sandsynligt udledninger fra Køben-
      havns Lufthavn. Modelberegningerne bag Copenhagen Air View Data er
      imidlertid udført med en simplificeret metode. Derfor er der behov for at
      dokumentere bidraget fra lufthavnen yderligere via målinger i området
      omkring lufthavnen og modelberegninger med mere detaljerede modeller,
      som kan give bedre beregninger af selve spredningen af luftforureningen
      fra lufthavnen.
    • Sammenligning mellem Copenhagen Air View Data og data fra DCE’s mo-
      delberegninger på adresseniveau (Luften på din vej, http://luftenpaadin-
      vej.au.dk) viser, at der er relativt god overensstemmelse mellem de obser-
      verede koncentrationsniveauer og den geografiske variation for kvælstof-
      dioxid. Sammenligningen viser ydermere, at der er relativt god overens-
      stemmelse mellem den geografiske variation i luftkoncentrationerne for
      black carbon. For black carbon ses dog en forskel i koncentrationsniveau-
      erne, hvor Copenhagen Air View Data er væsentligt højere end ”Luften på
      din vej”. For de ultrafine partikler er der ingen korrelation mellem resul-
      taterne fra Copenhagen Air View Data og ”Luften på din vej”. En årsag til
      dette er, at modelberegningerne bag ”Luften på din vej” giver for høje kon-
      centrationer i bybaggrund og landområder, og at modelberegningerne un-
      dervurdere bidraget fra vejtrafikken. Sammenlignet med målingerne giver
      ”Luften på din vej” dog fin overensstemmelse for gademålestationen på
      H.C. Andersens Boulevard. Andre grunde for den manglende korrelation
      er at koncentrationen af ultrafine partikler er en meget kompleks parame-
      ter, som det er meget svært at måle eller modellere nøjagtigt specielt for
      partikeler under 20 nm. Mere forskning er nødvendig til at forbedre må-
      linger og modellering af partikel antal.

8
1      Introduction

During the last three years (2018-2021), Utrecht University, Copenhagen Mu-
nicipality, Google and DCE – Danish Center for Environment and Energy
have cooperated on a project that has resulted in new data on the spatial dis-
tribution of air pollution in Copenhagen, Frederiksberg and Tårnby munici-
palities. The results from the project, Copenhagen Air View Data (CAV) are
available on May 26, 2021 on a public internet platform in the form of digital
maps presenting the spatial distribution of nitrogen dioxide, black carbon and
ultrafine particles in the three municipalities (https://insights.sustainabil-
ity.google/labs/airquality).

The main sources of nitrogen dioxide, black carbon and ultrafine particles are
combustion processes and in cities traffic is the most important of such
sources. Other sources like wood burning, power plants, industries and air-
ports are also important. All three air pollution components have been linked
to the health impacts of air pollution exposure.

This scientific note describes DCE’s involvement in the project, and briefly
describes the methods that have been used to prepare the data. The results
generated in the project are compared to measurement data from the national
air quality monitoring station in Copenhagen, as well as to the updated data
from the model calculations for the “Air Quality at Your Street” project rep-
resenting 2019 (see further explanation below). Finally, the scientific note pre-
sents DCE’s view on the quality of the new data, and DCE’s interpretation of
these.

In connection to the Danish Air Quality Monitoring Program, DCE has most
recently carried out new and updated model calculations for the same three
air pollution components as discussed in this scientific note. This data covers
calculations for 2.5 million addresses in Denmark for the year 2019. The data
are also public available by May 26, 2021 on the homepage for the project “Air
Quality at Your Street” (http://luftenpaadinvej.au.dk). The data is described
in a separate DCE report (Jensen et al., 2021, http://dce2.au.dk/pub/-
SR445.pdf).

                                                                               9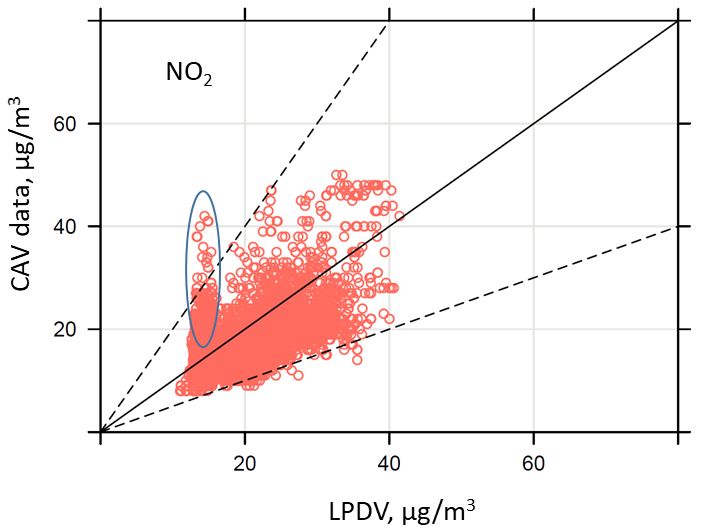
2      DCE’s involvement in production of CAV

     DCE has been involved in the preparation of the CAV data on several levels.

     During the campaign measurement period using the Google Street View Car,
     DCE undertook the task to perform daily service of the instruments in the car,
     as well as the handling of data storage. Utrecht University designed and build
     the instruments etc. into the Google Street View Car and carried out the cali-
     bration and repair of the instruments. The subsequent data preparation and
     analyses has carried out in a cooperation between the two research groups
     under the lead of Utrecht University, since they have designed the project and
     have experience from a prior project carried out in the US.

     Since the beginning of the project, DCE has participated in a working group
     connected to the project. The working group included participants from
     Google (Natalie Smailou, Karin Tuxen-Bettman), Municipality of Copenha-
     gen (Rasmus Reeh, Christian Gaarde Nielsen), Utrecht University (Roel Ver-
     meulen, Jules Kerckhoffs) and DCE (Thomas Ellermann, Ole Hertel, Matthias
     Ketzel and Jibran Khan). This working group has followed the progress of the
     work, as well as it has discussed practical and scientific issues of relevance for
     the project. Within the framework of the working group, DCE has partici-
     pated in the discussions of the quality of the results, the methods developed
     for modelling, and the presentation of the data, etc. The final quality assur-
     ance and the model calculations are carried out by Utrecht University.

     In addition, DCE has delivered a series of data sets that have been central for
     the analyses carried out in the project and the corresponding generated re-
     sults. These data sets include:

     • Air quality data from the Danish air quality monitoring stations in Copen-
       hagen (Ellermann et al., 2021) covering the entire measurement campaign
       period for the Google Air View Car study. The data was used in connection
       with the validation of the measurements themselves, but also for the sub-
       sequent corrections of the data (However, only for nitrogen dioxide, since
       the necessary data for black carbon and ultrafine particles were not avail-
       able).
     • High-resolution data on building footprints and building height in Copen-
       hagen.
     • Traffic information for all streets in Copenhagen from DCE’s Road and
       Traffic Database (Jensen et al., 2019).

10
3 Short description of method
The new data on the spatial distribution of air pollution in Copenhagen are
generated in three steps. The first step consists of measurements using the
Google Air View car, and the second step consists of Land Use Regression
(LUR) model calculations by the Utrecht University. In the third step, the re-
sults from the measurements and model calculation were combined into a so-
called “mixed” model, using measurements and LUR model calculations. It is
these final data that are called CAV data. This combination of measurements
and LUR model estimates have been increasingly used during the latest dec-
ades and is termed as a “mixed” or linear mixed-effects model.
3.1 Measurements
The measurements were carried out in the time period from October 2018 to
March 2020. The measurements were carried out from the Google Air View
Car, which is a Google Street View Car equipped with scientific grade instru-
ments for measurements of nitrogen dioxide, black carbon and ultrafine par-
ticles.
Ultrafine particles is defined as the particles with diameter below 100 nm. The
instrument for measurement of ultrafine particles measures the total number
of particles above 7 nm, and include particles with diameter well above 100
nm. Strictly speaking, the measured particle number does therefore not en-
tirely follow the definitions for the ultrafine particles. Typically, the particle
number is slightly larger than the number of ultrafine particles. However, in
popular context, ultrafine particles is the most commonly used term for this
group of particles. We will therefore use this term in this DCE scientific note.
The measurements were carried out with high time resolution (1 Hz). In ad-
dition, the car has an intake of air to the instruments on the roof, a GPS system
for exact spatial location of the measurements and an advanced data sampling
and handling system.
During the entire measurement period, the car made daily drives in Copen-
hagen. The drives followed a laid-out pattern ensuring that the car measure-
ments would cover all streets several times during the whole campaign pe-
riod. The performed number of drives on each street are from four to six times
with more frequent drives on the major roads and fewer drives on smaller less
trafficked/important roads. Each street is subdivided into 50 meters street
segments, in order to obtain a high spatial resolution of the obtained meas-
urement data. The typical measurement time for each street segment ranges
from 30 seconds to a few minutes in total for all the passages.
Therefore, the measurements have to be regarded as a kind of a snapshot of
the concentration levels in 2018-2020 based on the average concentrations
measured during the typical four to six passages of the specific street segment.
Prior to the averaging, the concentrations of nitrogen dioxide were corrected
temporarily using the measured concentrations of the urban background
monitoring station at Copenhagen University (H.C. Ørsted Institut). The aim
of this correction was to compensate for the seasonal and daily variations in
the concentrations of nitrogen dioxide. For black carbon and ultrafine parti-
cles, it has not been possible to make this correction, and the averages for these
11air pollution components represents solely the daytime conditions corre-
sponding to the period where the car has been driving.
The measurements were carried out with a car driving inside the traffic in the
streets. The measurement results obtained from the car will therefore be
higher than the results from the monitoring stations that are placed between
the traffic lanes and the facades of the houses along the street. Utrecht Uni-
versity has measured this difference in Amsterdam and they found that on
average the concentrations was about 20-30% higher in the traffic compared
to the monitoring stations (Kerchhoffs el at., 2021a, 2021b). However, this cor-
rection factor is uncertain and will depend on local conditions like street con-
figuration, building facades etc.
3.2 Model calculations
The modelled concentrations of the three air pollution components have been
carried out using Utrecht University’s Land Use Regression (LUR) model that
has been set up for the Copenhagen Area. The Land-use Regression Model is
set up for 50-m street segments and utilizes several geographical variables in
buffer distances in the range 100 m – 5000 m. The variables, among others,
include traffic intensity (number of vehicles/day), total road length (in 50 m
– 1000 m buffer distances), estimated building heights in meters (in 25 m, 50
m and 100 m buffer distances), and land use data, including port, industry,
urban greenery, airports and population/household density (in 100 m – 5000
m buffer distances).
As stated above, the LUR model includes calculations of the contributions
from Copenhagen airport based on a buffer distance approach. The buffer ex-
tends up to 5 km around the airport.
3.3 Mixed model calculations
In the last step, the results from the measurements and LUR model calcula-
tions are combined via a statistical approach. The statistical approach, the so-
called “mixed” model, is also known as the linear mixed-effects model (Pin-
heiro and Bates, 2006). Here, variables from the LUR model are used as the
“fixed-effect” in the mixed model, whereas measurements are used as the
“random-effect”. The aim of this step was to change the results from the meas-
urements, where uncertain (due to high variability, low number of measure-
ments), hereby low or high values are “smoothed out” towards the LUR
model estimates.
The final result from this step is called the mixed model estimates. The results
represent the average concentrations for the measurement period from Octo-
ber 2018 to March 2020. To a good approximation, this will correspond to the
annual average for 2019. For nitrogen dioxide, the results represent the annual
average, whereas for black carbon and ultrafine particles, the mixed model
estimates are limited to the annual daytime average.
The measurements and model calculations are described in two scientific pa-
pers by Kerckhoffs et al. (2021a) and Kerckhoffs and Khan et al. (2021b).
124 Results
The primary direct output from the project are three generated maps showing
the spatial distribution of average concentrations of nitrogen dioxide, black
carbon and ultrafine particles for the time period October 2018 to March 2020.
The results are available via the internet (https://insights.sustainabil-
ity.google/-labs/airquality), where it is possible to obtain and assess the map-
ping of the spatial distribution of the concentrations and to zoom in on the
individual street segments to study the local spatial distribution down to sin-
gle street level. Figure 4.1, 4.2 and 4.3 show overviews of the spatial distribu-
tion for the three air pollution components.
The results of the project show the highest concentrations at the major roads
for all three air pollutants, while the lowest concentrations are in residential
areas with relative low traffic intensity. Especially the main traffic corridors
and highways are standing out with the highest concentrations. This pattern
is expected since traffic is one of the most important sources of emissions for
these three air pollutant components in Danish cities.
The concentrations of nitrogen dioxide (Figure 4.1) reach in some of the most
heavily trafficked streets above 40 µg/m3. The EU annual average limit value
for nitrogen dioxide is 40 µg/m3 (2008/50/EC). However, the CAV data can-
not be used to assess compliance with this limit value since the EU directive
specifies that traffic lanes are not covered by the limit values and that the
measurements used to assess compliance must not be carried out on the traffic
lanes.
For black carbon (Figure 4.2), slightly higher concentrations are observed for
Vesterbro compared to other parts of the inner city. At present, the reason for
this is not known, and more work has to be carried out to determine wheter
this is due to higher emissions in that particular area of Copenhagen, or this
due to the uncertainties in the data originating from the measurements or the
model approach.
For ultrafine particles (Figure 4.3), elevated concentrations are observed in the
eastern part of Amager in the area around the airport. In a previous study
from DCE (Ellermann et al., 2011), it was documented that the emissions of
ultrafine particles are high, and that the concentrations of ultrafine particles
at the western border of the airport are comparable to the concentrations
measured at the monitoring station at H.C. Andersens Boulevard. It is
therefore expected that the area around the airport will have elevated
concentrations compared with similar areas in other parts of the city.
However, the modelling of the dispersion of ultrafine particles from the
airport to the surrounding areas has been carried out using a simplified
method compared to more advanced physcal-chemical dispersion models,
and the extent and spatial distribution of a significant contribution from the
airport is therefore uncertain. Thus, it is necessary to supplement the CAV
data with measurements of ultrafine particles in the area around the airport,
and to carry out calculations using more detailed models that can estimate the
actual dispersion of the emissions from the airport.
13Figure 4.1. Overview of the spatial distribution of nitrogen dioxide based on CAV. This map has been provided by Utrecht Uni- versity and Google, 2021. Figure 4.2. Overview of the spatial distribution of black carbon based on CAV. This map has been provided by Utrecht Univer- sity and Google, 2021. 14
Figure 4.3. Overview of the spatial distribution of ultrafine particles based on CAV. This map has been provided by Utrecht Uni-
versity and Google, 2021.
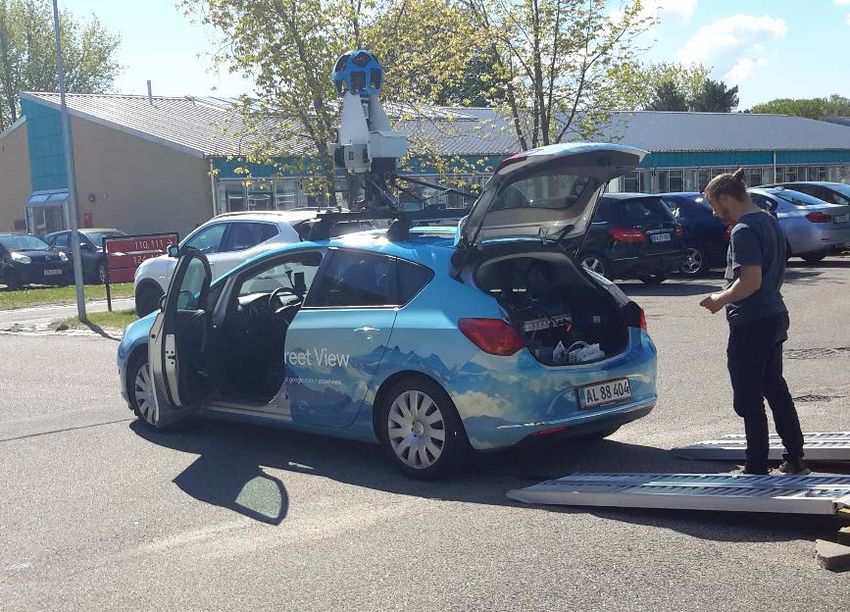
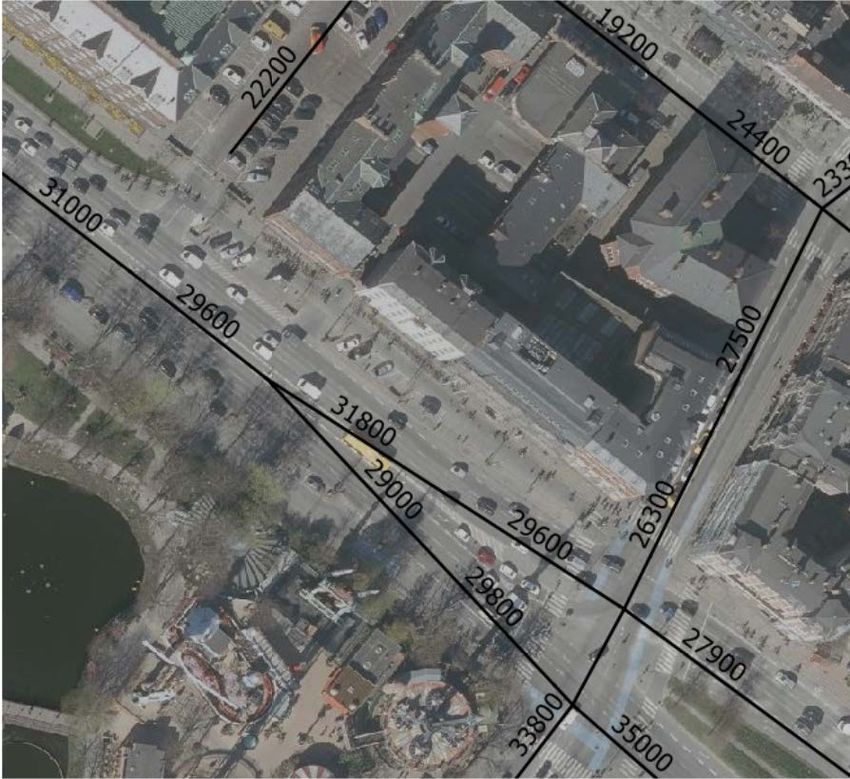
Figure 4.4 shows an example of the spatial variation of the concentration of
ultrafine particles on local scale.
It is unavoidable that there can be identified sites for which the results will
have particular high uncertainties. CAV data rely on data sets on traffic infor-
mation, street geometry, building data etc. and uncertainties in this data will
result in uncertainties in the results. It is beyond the scope of this project to
carry out a detailed quality control on all the input data, and it is however
evident that large uncertainties can occur on local scale.
15Figure 4.4. Example on data at local scale. The map shows the variation in the concentrations of ultrafine particles (units: parti- cle numbers per cm3) at the traffic light between H.C. Andersens Boulevard and Stormgade. Background map: Danish Agency for Data Supply and Efficiency, https://sdfe.dk. 16
5      Comparison with measurements at moni-
       toring stations

Comparison of CAV data with measurements from the DCE monitoring sta-
tions will provide useful information about the quality of the new data. In the
following paragraphs, CAV data is compared to annual average values from
the monitoring stations in the Danish Air Quality Monitoring Program (Eller-
mann et al., 2020):

• The street station at H.C. Andersens Boulevard (nitrogen dioxide, ultrafine
  particles and black carbon).
• The street station at Jagtvej (nitrogen dioxide).
• The urban background station at the rooftop of H.C. Ørsted Institute at the
  Copenhagen University (nitrogen dioxide, ultrafine particles and black
  carbon).

In addition, data is compared to results for nitrogen dioxide and ultrafine par-
ticles from the Copenhagen Airport monitoring station, which is located
about 100 meters from the western border of the airport (Jensen et al., 2020).
The measurements at this monitoring station are carried out by Force Tech-
nology. Figure 5.1 shows the locations of the four monitoring stations.

The CAV project covers data from the period from October 2018 to March
2020. To a good approximation, this corresponds to the annual average for
2019 and hence annual averages from 2019 are used from the monitoring sta-
tions for comparison.

                                                                             17
Figure 5.1. Maps showing the locations of the monitoring stations (red dot) and the street segment for CAV used for the com-
parisons. Upper left: H.C. Andersens Boulevard, upper right: Jagtvej, lower left: urban background at H.C. Ørsted Institute, Co-
penhagen University and lower right: Airport West. Background maps; Krak.dk.
Figure 5.2 and Table 5.1 show a comparison for nitrogen dioxide between the
CAV data, the annual average values from the monitoring stations, and the
annual averages for the two street monitoring stations (here, also corrected
values are presented additionally). The correction of the measured values is
due to the fact that CAV is based on measurements carried out in the traffic
lanes, while the street measurement stations are placed at the roadside about
1-4 meters from the outer traffic lane. Kerckhoffs et al. (2021a) observed in
Amsterdam, that nitrogen dioxide concentrations in the traffic lanes are ap-
proximately 20-30% higher than what is observed at the roadside. Based on
this, the corrected annual averages are estimated by increasing the measured
annual averages by 25% for the DCE street monitoring stations. The CAV re-
sults are in good agreement with the measured annual averages when taking
into account the difference between measurements on the traffic lanes and at
the roadside. It shall also be kept in mind that this correction factor is uncer-
tain and most likely this correction factor will depend on local conditions like
street configuration, building facades etc.
1860
DCE Measurement
50 DCE Corrected measurement
Copenhagen Air View Data
NO2, µg/m3
40
30
20
10
0
H.C. Andersens Bulevard Jagtvej Urban Background, H.C.Ø. Air port west
Figure 5.2. CAV results and the annual averages for nitrogen dioxide for 2019 from the
street stations at H.C. Andersens Boulevard and Jagtvej, the urban background station at
H.C.Ø. and the station close to the western border of Copenhagen Airport. The annual av-
erages from the street stations are corrected for estimated difference between measure-
ments in the traffic lanes and at the roadside.
Table 5.1. CAV results and the annual averages for nitrogen dioxide for 2019 from the street stations at H.C. Andersens
Boulevard and Jagtvej, the urban background station at H.C.Ø. and the station close to the western border of Copenhagen
Airport. The annual averages from the street stations are corrected for estimated relative differences between measure-
ments in the traffic lanes and at the roadside.
DCE DCE Corrected Copenhagen Relative
Measurement Measurement Air View Data Difference
µg/m3 µg/m3 µg/m3 %
H.C. Andersen Boulevard 33 41 48 16
Jagtvej 24 30 31 3
Urban Background, H.C.Ø. 12 16 33
Airport west 12 11 -5
Figure 5.3 and Table 5.2 show a comparison for ultrafine particles between
CAV data, annual average values from the DCE monitoring stations and cor-
rected annual averages. In 2019 the results from the DCE monitoring stations
covered only the range of particles from 41 nm to 480 nm (Ellermann et al.
2020). The numbers presented in Figure 5.3 and Table 5.2 are therefore inter-
polated values for 2019 based on the results from 2016 and 2020, where the
measured data covered the full range above 10 nm and upwards (Ellermann
et al., 2021).
The measured values for H.C. Andersens Boulevard are corrected both for the
difference due to the measurement location (traffic lane versus roadside) and
for the difference in the averaging period, while the measured value at Air-
port west has only been corrected for the difference in averaging period. The
correction to reflect measurement location is assumed to be approximately 20-
30% (Kerckhoffs and Khan et al., 2021b). The measured data from the moni-
toring stations represent annual averages while CAV data represents the an-
nual working day daytime average. The measurements at H.C. Andersens
Boulevard and urban background is carried out as hourly averages and hence
it is possible to calculate a correction factor between daytime working day
average and annual average. Based on data from 2020 (Ellermann et al., 2021)
19it is found that the correction factor is +20% for H.C. Andersens Boulevard,
and that no correction is needed for the urban background.
There is also a difference between the annual average and annual working
day daytime average at the Airport west. However, since we have no availa-
ble data that can be used to determine the correction factor, it has been as-
sumed that the correction is at the same level as for H.C. Andersens Boule-
vard.
CAV data results are 82-117% higher for ultrafine particles compared to the
results from the DCE monitoring stations, even after the correction of the data
from the DCE monitoring stations. CAV results are about a factor of two
higher than the original data from the Danish Monitoring Program and the
airport. This indicates that CAV results might overestimate the concentra-
tions. However, it is difficult to carry out accurate measurements of the num-
ber of ultrafine particles below 20 nm. In addition, different instruments have
been used for CAV data, the DCE monitoring stations and at the airport. This
may result in differences in the cut-off for the lower end of the measured par-
ticle range leading to significant differences in the measured values.
CAV results can therefore not be compared directly with the results from the
DCE monitoring stations. On the other hand, there is good agreement be-
tween the relative difference between the street, urban background and air-
port monitoring stations and hence the relative spatial variation is plausible.
35.000
DCE Measurement
30.000 DCE Corrected measurement
Copenhagen Air View Data
Particle number per cm3
25.000
20.000
15.000
10.000
5.000
-
H.C. Andersens Bulevard Urban Background, H.C.Ø. Airport west
Figure 5.3. CAV results and annual averages for ultrafine particles for 2019 from the
street station at H.C. Andersens Boulevard, the urban background station at H.C.Ø. and
the station close to the western border of Copenhagen Airport. The annual averages from
H.C. Andersens Boulevard and Airport west are corrected for estimated differences be-
tween measurements on the traffic lanes and at the roadside (only street station) and dif-
ferences between the annual average and working day daytime average.
20Table 5.2. CAV results and annual averages for ultrafine particles for 2019 from the street stations at H.C. Andersens Boule-
vard, the urban background station at H.C.Ø. and the station close to the western border of Copenhagen Airport. The annual
averages from H.C. Andersens Boulevard and Airport west are corrected for estimated differences between measurements
on the traffic lanes and at the roadside (only street station), and the differences between annual average and working day
daytime average.
DCE DCE Corrected Copenhagen Relative
Measurement Measurement Air View Data Difference
particles/cm3 particles/cm3 particles/cm3 %
H.C. Andersen Boulevard 10.000 15.000 29.600 97
Urban Background, H.C.Ø. 3.100 6.740 117
Airport west 11.200 13.400 24.400 82
Figure 5.4 and Table 5.3 show a comparison between CAV for black carbon
and the annual average values for elemental carbon from the monitoring sta-
tions and corrected annual averages for the street monitoring stations. Black
carbon and elemental carbon are two different parameters used to describe
soot particles. The measurement principles are very different, and the results
can therefore not be directly compared.
The measured values for H.C. Andersens Boulevard have been corrected both
for the difference due to the measurement location (traffic lane versus road-
side), and for the difference due to averaging period, while no correction has
been applied for the urban background monitoring station. The correction of
the measurements reflecting the location (roadside versus street lane) is esti-
mated to be 20-30% (Kerckhoffs and Khan et al., 2021b). The measurements of
elementary carbon are based on diurnal averages, and it is therefore not pos-
sible to determine a correction factor on basis of the measurements. It has
therefore been assumed, that the correction factor (+20%) for ultrafine parti-
cles is applicable for elementary carbon as well.
CAV results are nearly two to three times higher compared to the results from
the measurements, even after correction of the data from the monitoring road-
side station. The main reason for this is believed to be the different parameters
measured (black carbon versus elementary carbon). However, the difference
between the CAV results for black carbon and monitoring data for elemental
carbon is high, and this indicate that CAV results might overestimate the
amount of black carbon. In order to establish a conversion factor between
black carbon and elemental carbon at the monitoring stations, it would there-
fore be necessary to carry out additional measurements.
213,0
DCE Measurement EC
2,5 DCE Corrected measurement EC
Copenhagen Air View Data BC
EC or BC, µg/m3
2,0
1,5
1,0
0,5
0,0
H.C. Andersens Bulevard Urban Background, H.C.Ø.
Figure 5.4. CAV results for black carbon (BC) and annual averages for elemental carbon
(EC) for 2019 from the street station at H.C. Andersens Boulevard and the urban back-
ground station at H.C.Ø. The annual averages from H.C. Andersens Boulevard are cor-
rected for estimated differences between measurements on the traffic lanes and at the
roadside and the differences between annual average and working day daytime average.
Table 5.3. CAV results for black carbon (BC) and annual averages for elemental carbon (EC) for 2019 from the street sta-
tion at H.C. Andersens Boulevard and the urban background station at H.C.Ø. The annual averages from H.C. Andersens
Boulevard are corrected for estimated differences between measurements on the traffic lanes and at the roadside and differ-
ences between the annual average and working day daytime average.
DCE DCE Corrected Copenhagen Relative
Measurement Measurement Air View Data Difference
EC EC BC
µg/m3 µg/m3 µg/m3 %
H.C. Andersen Boulevard 1,0 1,5 2,8 87
Urban Background, H.C.Ø. 0,3 0,8 167
226 Comparison between CAV and DCE’s Air
quality on your street
In the following, we will present the results from a first comparison between
CAV data and DCE’s data presented on the portal Air Quality at Your Street
(LPDV based on the Danish name). Both data sets provide high-resolution
data for the annual average of nitrogen dioxide, black carbon and ultrafine
particles. Additionally, Air Quality at Your Street also presents data for con-
centrations of PM2.5 and PM10 (particles with diameters below 2.5 and 10 mi-
crometer, respectively).
The LPDV data is computed using DCE’s air quality models that are based on
physical-chemical modelling of the processes determining the air concentra-
tions of nitrogen dioxide, black carbon and ultrafine particles. These models
are described in a Scientific Report from DCE (Jensen et al., 2021).
Since both data sets have been finalized recently, the conclusions presented
here of comparisons shall be regarded as preliminary, and more work has to
be done to get a more detailed knowledge on the difference between the re-
sults from the two data sets.
Figure 6.1 shows a scatter plot between CAV and LPDV for nitrogen dioxide.
The coefficient of determination (also called R-squared) R2 is 0.36 meaning
that 36% of the variation in one variable can be explained by the other varia-
ble. The correlation between the two data sets are therefore not excellent but
on the other hand, this level of correlation is not uncommon when two very
different methods for determining high-resolution data on the spatial varia-
bility are compared. A perfect correlation would have a R2 of 1 and a strong
correlation between the two variables would be in the order of 0.7-1.
Moreover, the statistical analysis of the data shows that on average the con-
centrations of nitrogen dioxide are about 20% higher in CAV data compared
to LPDV data. There is therefore good agreement between the average con-
centration levels determined by the two different methods when it is taken
into account that CAV data is determined from measurements on the traffic
lanes while LPDV represents the concentrations at the facade.
One distinct group of data seems to differ more than the remaining group of
data. This is the data in the ellipsoid in Figure 6.1, where the LPDV model
shows concentrations in the range between 12 and 17 µg/m3 and CAV data
are between 15 and 45 µg/m3. Three explanations for the very low correlation
for this group of data can be:
• LPDV describes the emissions from traffic and the impact of meteorology
in a very detailed way based on traffic intensity, composition of fleet of
vehicles, travel speed, detailed meteorological date etc. CAV rely on a less
detailed modelling approach in combination with short-term measure-
ments using the Google Street View Car.
• Data from some of the street segments are based on only one or two pas-
sages of the street, and this makes data from these street segments uncer-
tain.
23• CAV results include the contribution of nitrogen dioxide from the traffic
emissions on the highways while LPDV does not take these emissions into
account on local scale.
All these differences in methods and input data might lead to distinct differ-
ences for a group of street segments. However, there can also be various other
explanations for the differences, and a more detailed comparison of the two
data sets is necessary in order to explain the observed differences for this par-
ticular group of data.
Figure 6.1 Comparison of concentrations of nitrogen dioxide from CAV data and annual
averages from LPDV. The black line is the 1:1 line and the dashed lines are the 2:1 and
1:2 lines. The ellipsoid indicates the group of data specially mentioned in the text above.
The comparison is based on the 14776 street segments from CAV that are within 10 me-
ters distance to LPDV address points.
Figure 6.2 shows a scatter plot between CAV and LPDV for black carbon. The
coefficient of determination R2 is 0.36 meaning that 36% of the variation in one
variable can be explained by the other variable which is about the same as for
nitrogen dioxide.
The absolute values differ significantly between the two data sets. Data from
CAV is about a factor of three higher compared to data from the LPDV model.
The same difference was observed when the CAV data was compared to the
measurements from the DCE monitoring stations (Chapter 5).
Part of the reason for this difference is that CAV represents results for the
traffic lanes while LPDV represents the concentrations at the facades. Moreo-
ver, CAV represents averages for working day daytime while LPDV are an-
nual averages. Both these differences result in higher concentrations for re-
sults from CAV compared to LPDV.
24The difference between the absolute levels might be due to the very different
approaches used for CAV and LPDV. The absolute levels determined by CAV
rely on a combination of results from short time measurements of black car-
bon on the traffic lanes and model calculations. LPDV is based on DCE’s air
quality models that are based on a physical-chemical modelling of the pro-
cesses determining the concentration levels and using emission inventories
for black carbon as one of the important input data sets. It is well known that
the emission inventories for black carbon are very uncertain, and this can
hence also be part of the explanation for the large differences. However, more
comparisons are necessary in order to further investigate the reasons for the
observed differences.
Figure 6.2. Comparison of concentrations of black carbon from CAV data and annual av-
erages from LPDV. The black line is the 1:1 line and the dashed lines are the 2:1 and 1:2
lines. The comparison is based on the 14503 street segments from CAV that are within 10
meters distance to LPDV address points.
The first initial comparison of results from CAV data and LPDV for ultrafine
particles shows that the spatial variability is very different in the two data sets,
and that the two data sets do not correlate (Figure 6.3). One reason for this is
that LPDV overestimates the concentrations of UFP in urban and regional
backgrounds. On the other hand, the result from LPDV at the monitoring sta-
tion at H.C. Andersen Boulevard is in good agreement with the annual aver-
age from the measurements (Jensen et al., 2021) while CAV results are approx-
imately a factor of two higher when compared to the results from the DCE
monitoring station (Chapter 5). Other reasons for the missing correlation are
that ultrafine particles is a very complex parameter that it is very difficult to
accurately measure and model espeacially for particles under 20 nm. This
complex picture illustrates the need for further development of the model cal-
culations behind LPDV and a more thorough comparison of the results from
CAV, measurement data and LPDV.
25Figure 6.3. Comparison of concentrations of ultrafine particles from CAV data and annual
averages from LPDV. The black line is the 1:1 line and the dashed lines are the 2:1 and
1:2 lines. The comparison is based on the 14528 street segments from CAV that are
within 10 meters distance to LPDV address points.
267 Reference
Ellermann, T., Massling, A., Løfstrøm, P, Winther, M., Nøjgaard, J. K. & Ket-
zel, M., 2011. Undersøgelse af luftforureningen på forpladsen i Københavns
Lufthavn Kastrup i relation til arbejdsmiljø. DCE - Nationalt Center for Miljø
og Energi, Aarhus Universitet. 148 s. - Teknisk rapport fra DCE – Nationalt
Center for Miljø og Energi nr. 5. http://www2.dmu.dk/Pub/TR5.pdf
Ellermann, T., Nygaard, J., Nøjgaard, J.K., Nordstrøm, C., Brandt, J., Christen-
sen, J., Ketzel, M., Massling, A., Bossi, R., Frohn, L.M., Geels, C. & Jensen, S.S.,
2020. The Danish Air Quality Monitoring Programme. Annual Summary for
2018. Aarhus University, DCE – Danish Centre for Environment and Energy,
83 pp. Scientific Report from DCE – Danish Centre for Environment and En-
ergy No. 218. http://dce2.au.dk/pub/SR360.pdf
Ellermann, T., Nordstrøm, C., Brandt, J., Christensen, J., Ketzel, M., Massling,
A., Bossi, R., Frohn, L.M., Geels, C., Jensen, S.S., Nielsen, O.-K., Winther, M.,
Poulsen, M.B., Nygaard, J. og Nøjgaard. J.K., 2020. Luftkvalitet 2019. Status
for den nationale luftkvalitetsovervågning. Aarhus Universitet, DCE – Natio-
nalt Center for Miljø og Energi, 128 s. - Videnskabelig rapport nr. 410
http://dce2.au.dk/pub/SR410.pdf.
Ellermann, T., Nøjgaard, J. K., Massling, A. & Bossi, R., 2021. The Particle Pro-
ject 2020. Aarhus University, DCE – Danish Centre for Environment and En-
ergy, xx pp. Scientific Report from DCE – Danish Centre for Environment and
Energy. In preparation.
Jensen, S.S., Ellermann, T., Hertel, O., 2020. Program for kortlægning af par-
tikler i Tårnby Kommune. Aarhus Universitet, DCE – Nationalt Center for
Miljø og Energi, 50 s. - Teknisk rapport nr. 183 http://dce2.au.dk/pub/
TR183.pdf
Jensen S.S., Plejdrup M.S. & Hillig, K. 2019: GIS-based national road and traf-
fic database 1960-2020. Technical Report from DCE – Danish Centre for Envi-
ronment and Energy No. 151:1-31.
Jensen, S.S., Ketzel, M., Khan, J., Valencia, V.H., Brandt, J., Christensen, J.H.,
Frohn, L.M., Nielsen, O.-K. Plejdrup, M.S., Ellermann, T. (2021): Luften på din
vej 2.0. DCE-Nationalt Center for Miljø og Energi, 62 s. - Videnskabelig rap-
port fra DCE – Nationalt Center for Miljø og Energi nr. 445,
http://dce2.au.dk/pub/SR445.pdf
Kerckhoffs, J., Khan, J., G. Hoek, Ellermann, T., Hertel, O., Ketzel, M., Jensen,
S.S., Meliefste, K.,Vermeulen, R. (2021a). Development of a NO2 Mixed-effects
Modelling Framework for Amsterdam and Copenhagen using Google Street
View Measurements. In preparation.
Kerckhoffs, J., Khan, G. Hoek, J., Ellermann, T., Hertel, O., Ketzel, M., Me-
liefste, K., Jensen, S.S., Vermeulen, R. (2021b). Exploring hyperlocal variation
of nitrogen dioxide, black carbon and ultrafine particles in Amsterdam and
Copenhagen using Google Street View measurements. (Kerckhoffs and Khan
are both first authors). In preparation.
Pinheiro, J., & Bates, D. 2006: Mixed-effects models in S and S-PLUS. Springer
Science & Business Media.
27You can also read