Star Wars and the Art of Data Science: An Analytical Approach to Understanding Large Amounts of Unstructured Data
←
→
Page content transcription
If your browser does not render page correctly, please read the page content below
Paper 286-2014

        Star Wars and the Art of Data Science: An Analytical Approach to
              Understanding Large Amounts of Unstructured Data
                    Mary Osborne and Adam Maness, SAS Institute Inc., Cary, NC

ABSTRACT
Businesses today are inundated with unstructured data–not just social media, but books, blogs, articles, journals,
manuscripts, and even detailed legal documents. Manually managing unstructured data can be time consuming and
frustrating, and might not yield accurate results. Having an analyst read documents often introduces bias because
analysts have their own experiences, and often those experiences help shape how the text is interpreted. The fact
that people become fatigued can also impact the way the text is interpreted. Is the analyst as motivated at the end of
the day as they are at the beginning?
Data science involves using data management, analytical, and visualization strategies to uncover the story the data is
trying to tell in a more automated fashion. This is important with structured data, but becomes even more vital with
unstructured data. Introducing automated processes for managing unstructured data can significantly increase the
value and meaning gleaned from the data.
This paper outlines the data science processes necessary to ingest, transform, analyze, and visualize three Star
Wars movie scripts:- “A New Hope,” “The Empire Strikes Back,” and “Return of the Jedi.” It will focus on the need to
create structure from unstructured data using SAS® Data Management, traditional SAS code, and SAS® Contextual
Analysis. The results are featured using SAS® Visual Analytics.

INTRODUCTION
A long time ago, in a galaxy far far away, IT shops ruled technology. They controlled hardware resources and data.
They were responsible for governance and compliance. They had power but limited resources. When business
analysts needed data to perform analysis or create reports, the analysts were forced to submit requests and wait for
those requests to be fulfilled.
At the same time, the idea of “data analysis” has meant many things to many people. Some people used the phrase
when they referred to standard or OLAP-based reports—after all, the AP in OLAP stands for analytical processing,
and while not particularly sophisticated, roll-ups and summaries do require basic analytical skills. Still others
engaged in the use of statistics to make better sense of the data.
Business analysts held the knowledge of the business and worked with IT to apply business rules and create reports
using Business Intelligence tools. Most of their analysis was done using spreadsheets.
Enter a new class of user: the data scientist. Like a Jedi, this user has amazing knowledge. To data scientists, data
is like the living Force. Data can be manipulated, massaged, and made to do amazing things. Combine the
knowledge of statistical analysis, and they can be more forward-thinking with the data, including the ability to see into
the future. When it comes time to share this information with others so that they can be more agile, the data scientist,
or Data Jedi, for those keeping score, understands how to best portray results to get the maximum benefit, whether in
a standard spreadsheet-style report or an eye-popping visual. They’re a great mix of technological brains, brawn,
and finesse. They have had to learn patience and have been made to exercise control in order to most appropriately
generate usable intelligence from data.
Why patience and control? The data they need for the answers to the questions they are asking is big. It is complex.
The data is very often text based—web logs, social media data, e-mail messages, call center notes, surveys, books,
legal documents—it is not the standard data providing the status quo results.
The Data Jedi bring a nice balance between the business and IT. They are just as comfortable in point-and-click
GUIs as they are getting their hands dirty with code. They are not afraid to try new approaches and technologies to
get the answers they seek.
This paper will outline steps and techniques that can be employed to take large chunks of unstructured data, whittle
them down into logical sections, extract structured fields, analyze both the new structured fields and the unstructured
content, and finally, visualize the output.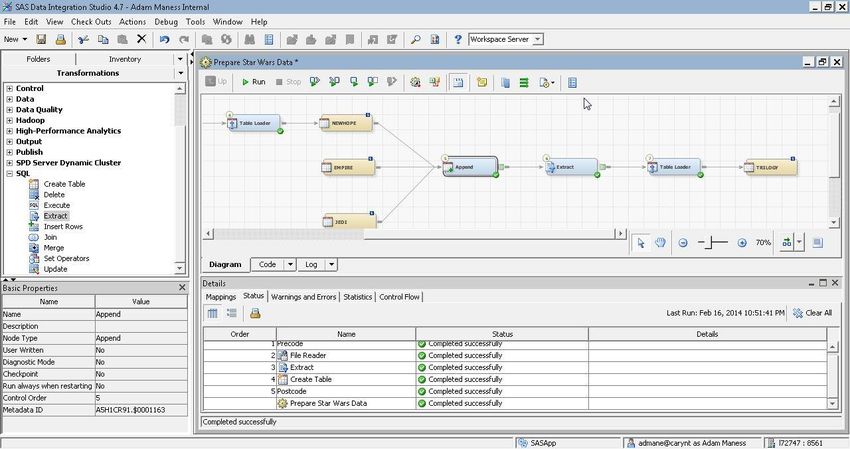
THE TEXT ANALYTICS LIFECYCLE
How would a data scientist begin? What would a process look like to take us from raw data to understanding and
value from that data?
The Text Analytics Lifecycle illustrated in Figure 1 is a standard process that takes the data from the initial data
collection through delivery.

                                           Figure 1. The Analytics Lifecycle

DATA COLLECTION
Unstructured data is plentiful and comes from a variety of sources and channels. With unstructured data, it is
important to consider both active and passive channels. Active channels are mechanisms by which an organization
prompts the creation of unstructured data assets, like surveys or outbound calling campaigns. Passive channels are
channels an organization might have very little control over, like social media or inbound call center calls. With both,
the organization has no idea what the participant is going to contribute until it happens. Depending on the channel,
the quality of the information can vary significantly.
The channel is the driving force behind the technical process of actually collecting the unstructured data. For
example, if you want to look for trends in your call center notes, you can begin your unstructured data collection
process by leveraging the appropriate SAS/ACCESS® engine to bring the data into SAS. If you want to see what the
folks in the Twitterverse are saying about you, you will need a web crawler, like the SAS ® Crawler. The SAS®
Crawler provides standard web crawlers, RSS feed crawlers, and file crawlers.
Other unstructured data sources can be easily downloaded from external websites. For the purposes of this paper,
we downloaded the scripts for the three movies in the original Star Wars trilogy: “A New Hope,” “The Empire Strikes
Back,” and “Return of the Jedi” from the Internet Movie Script Database (http://www.imsdb.com).

DATA PREPARATION
Data preparation is imperative when the end goal is analytics or visualization. It is incredibly rare to receive data that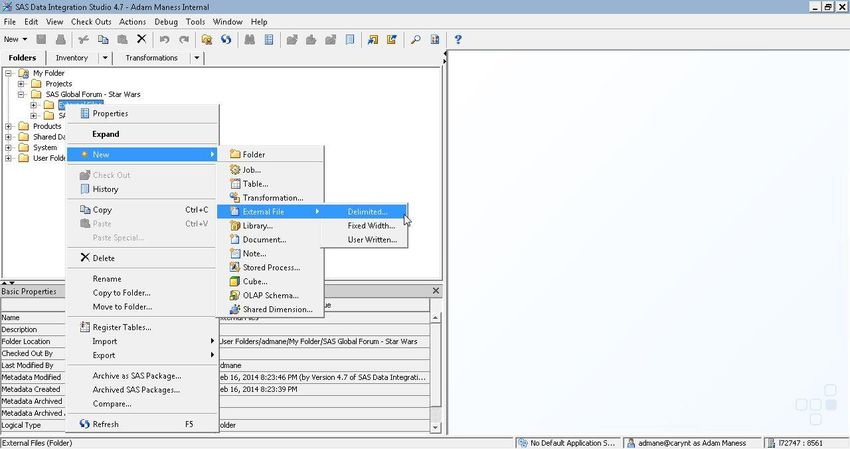
is in a perfect format, has all the necessary variables, and is conducive to analytics or visualization.
The following sections outline the data manipulation process used to prepare the scripts from the original Star Wars
Trilogy to be used in advanced analytics and visualization. Figures 2, 3 and 4 show the beginnings of the raw scripts:

                                   Figure 2. Star Wars: Episode IV – A New Hope

                             Figure 3. Star Wars: Episode V – The Empire Strikes Back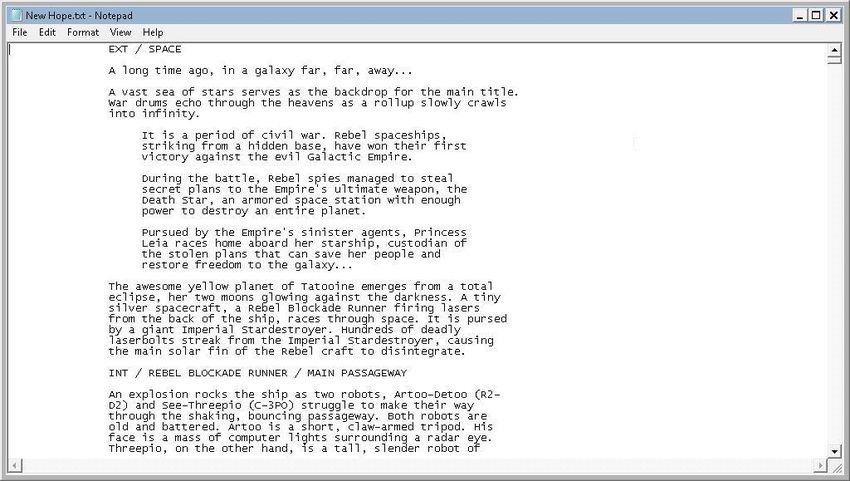
Figure 4. Star Wars: Episode VI – Return of the Jedi

As is often the case, there are many methods that can be used to address the preparation of the data for this project.
The following options are employed:
    1.   SAS® Data Integration Studio – point-and-click
    2.   SAS® windowing environment – DATA step code

SAS® Data Integration Studio
SAS® Data Integration Studio provides a powerful visual design tool for building, implementing and managing data
integration processes regardless of data sources, applications, or platforms. An easy-to-manage, multiple-user
environment enables collaboration on large enterprise projects with repeatable processes that are easily shared. The
creation and management of data and metadata are improved with extensive impact analysis of potential changes
made across all data integration processes.
SAS® Data Integration Studio enables users to quickly build and edit data integration, to automatically capture and
manage standardized metadata from any source, and to easily display, visualize, and understand enterprise
metadata and your data integration processes.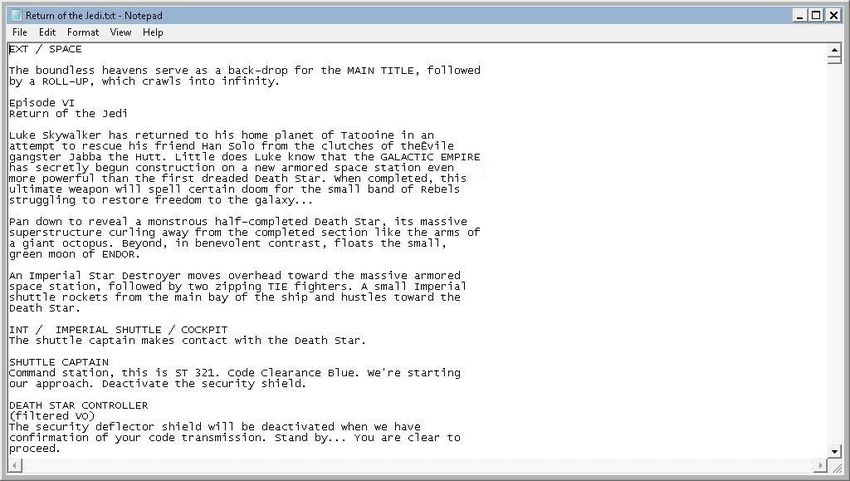
The first step of the data integration process would be to make a logical reference to the physical script data files.
This is done in Data Integration Studio with the creation of an external file. In this case we are creating a delimited
file. (See Figure 5).

                                  Figure 5. Create a Reference to the Physical File

The process is wizard-driven and provides the user with a series of steps to complete in order to create the file
reference.
After providing a name and description for the reference, the file’s physical location is specified. There is an option at
this point in the wizard to specify a directory of files, which can be useful if all of the input files contain the same
structure.
Once the physical file has been identified, it can be viewed from within the SAS® Data Integration Studio
environment. In the example shown in Figure 6, only the first 10 lines are displayed.

                                            Figure 6. External File Viewing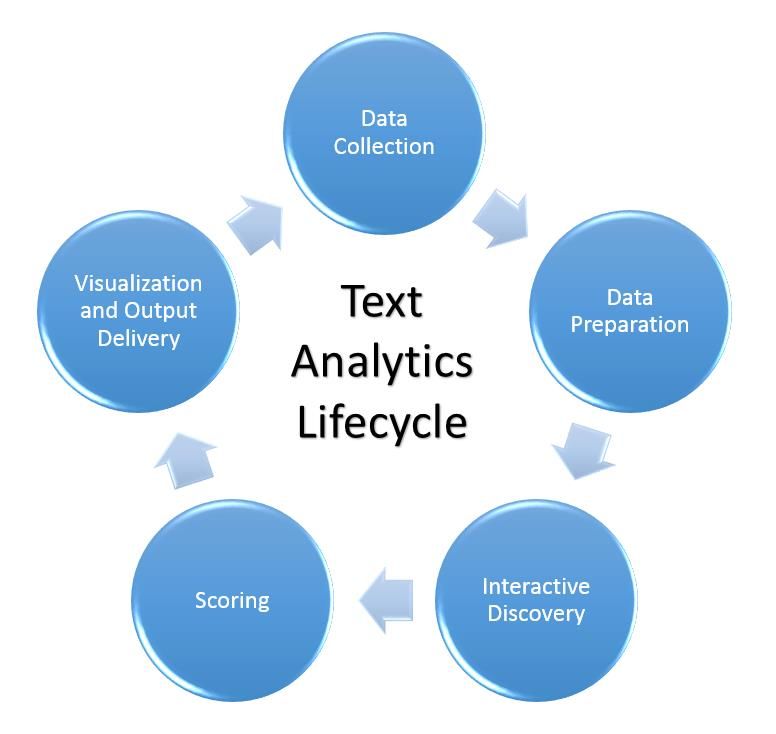
Finally, delimiter and record length options are set. These options are shown below in Figure 7.

                        Figure 7. Setting Delimiters and Parameters for the External File

Since each line of the file is a single record, we can define a single column to hold the value. Lines of text will be
compressed into single “documents” later in the process. At this stage, there are options to view the raw data (Figure
8) or the actual table output structure (Figure 9).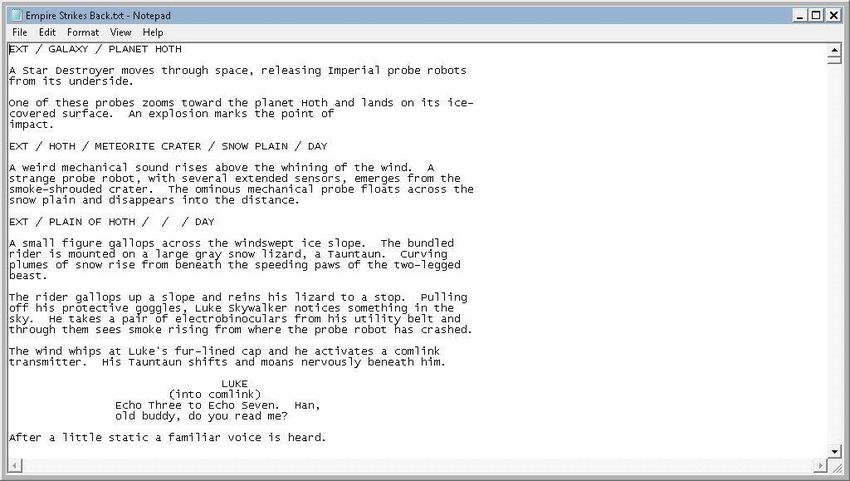
Figure 8. Raw Data View

Figure 9. Table Output
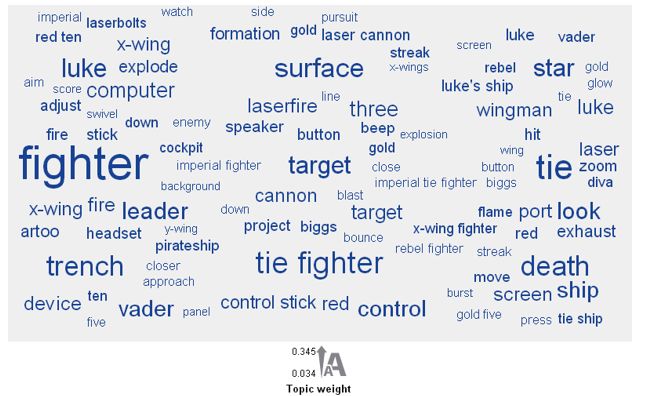
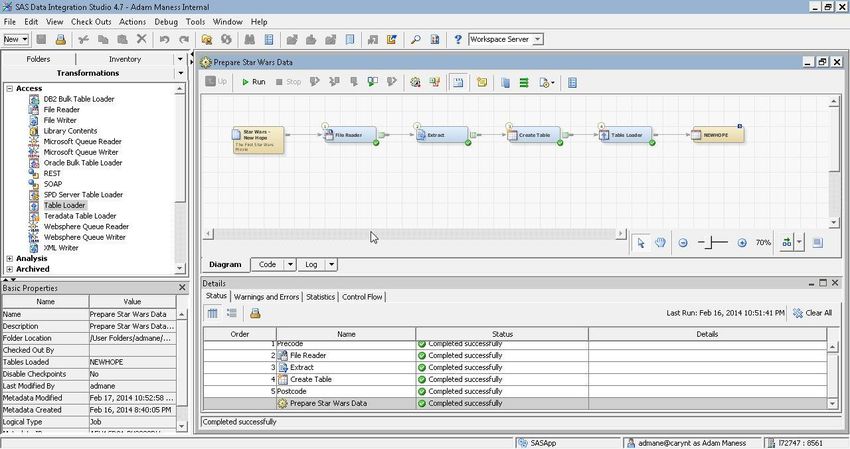
Figure 10 shows the completed job, called Prepare Star Wars Data, for the data manipulation process on the
NewHope.txt data file. The output is generated as a SAS data set with one variable, SCRIPT_LINE (one line of the
script per record), as shown in Figure 11.

                             Figure 10. The Completed Data Manipulation Process

                                  Figure 11. Sample Output from A New Hope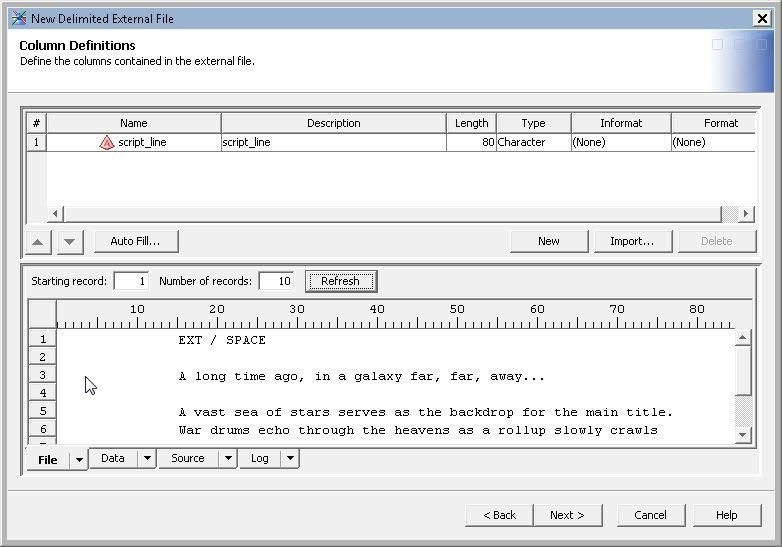
The process illustrated in Figure 10 creates a single data set and was replicated three times for each of the three
scripts. In addition to the text-based variable SCRIPT_LINE, a character variable called SOURCE was added in
order to merge the three scripts together (see Figure 12) into a final data set called Trilogy to look for trends across
all three movies.

                                  Figure 12. The Addition of the SOURCE Variable

The append job is shown in Figure 13 below.

                          Figure 13. Append the Script Files to Create a Master Data Set

INTERACTIVE DISCOVERY
Interactive discovery of unstructured data is a way to let the data tell the story while eliminating some of the bias.
Very often with unstructured data, the data scientists are very close to the source, which, while not a bad thing,
sometimes leads to topic tunnel vision—a situation where it becomes difficult to achieve an elusive “a-ha” moment in
the data because the assumption is made that you know everything about the data. Interactive discovery is also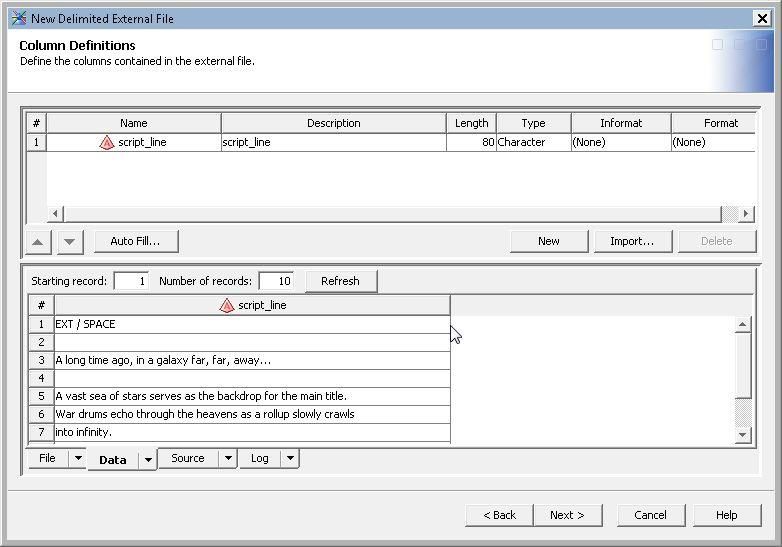
useful in learning more about the data structure and can help determine whether additional data preparation steps
might be necessary.
We will explore two options for interactive discovery of unstructured data in SAS, SAS® Contextual Analysis and
SAS® Visual Analytics.
SAS® Contextual Analysis
SAS® Contextual Analysis is a web-based text analytics tool. It provides a set of guided steps that lead to term
concept mapping (the identification of key terms and their relationships to other terms) and topic mapping
(identification of key clusters of terms and their relationships to other individual terms). Additional business rules can
be added to the machine learning to introduce subject-matter expertise and refine the models.
With the Star Wars data collected into 4 data sets (one for each movie and one master data set containing the entire
trilogy), interactive discovery can begin.
We will focus our analysis on examining the combined data, the Trilogy data set. These initial discovery processes
often help uncover issues or concerns in the data that mighty warrant additional data processes.
SAS® Contextual Analysis currently provides three Analysis Tasks: Terms, Topics, and Categories.
Terms are defined as representative text forms that reflect one or more different surface forms. Terms
typically have optional roles including part-of-speech tags or concepts, in the case of entities.
Topics are machine-generated categories. They help illustrate document content by identifying different
themes in a corpus of documents.
Categories are a classification for documents based on a common characteristic. For example, Yoda and
Obi-wan Kenobi could both be classified as Jedi masters.
After selecting the Trilogy data source and running the project, we start exploring the terms. Immediately a problem
jumps out. The first two terms identified are both Luke—one instance is identified as a PERSON concept and the
second as a PROP_MISC concept. (See Figure 14.)
Figure 14. A Single Term Identified with Two Concepts
The folder beside the first Luke term indicates there are synonyms. When the folder is expanded, we can see that
Luke is also identified as a LOCATION and an ORGANIZATION (shown in Figure 15).
Figure 15. A Single Term Shown with Synonyms, Identified with Additional Concepts
In looking at the Terms list in more detail, it becomes apparent that many of the characters are associated with at
least two concepts, PERSON and PROP_MISC. Why is this?If we go back to the original, raw data, something stands out. Figure 16 shows a snippet from A New Hope:
Figure 16. Original Raw Data from A New Hope
Each character’s speaking part is prefaced by their name in all uppercase. This is likely where the PROP_MISC
concept is coming from in the terms list. There are two approaches to correcting this. The first is to create a
synonym list and change the concepts to something more consistent, however, given the layout of the data, we are
given a prime opportunity to return to data preparation and create some structured fields. We can extract the
character name and associate that character name with their lines in the script. The addition of such structured fields
can strengthen our analysis by providing category variables. Category variables can be used in the automatic
creation of category rules that we can score against. This process also provides us with more data that we can
visualize and explore.
Since we are looking back at the original data, it is worth delving a little deeper to see if there are any other areas that
might be useful to provide additional structured fields.
It appears, on further inspection of the scripts, that there are markers for interior and exterior locations and even
indications of day versus night in some sections. Figure 17 shows a snippet from ”The Empire Strikes Back,”
specifying, in all uppercase, delimited by periods and dashes, an exterior location (EXT), on the planet Hoth,
specifically in a meteorite crater, on the snow plain during the day:
Figure 17. Original Raw Data Showing Location and Time Period (Day)
Now that areas of interest for creating structured variables have been identified, how do we go about creating the
new variables? We could go back into Data Integration Studio, but we would have a lot more flexibility if we delved
into SAS code and took advantage of the ability to manipulate data using the SAS DATA step.DATA PREPARATION REVISITED
SAS DATA Step
In the first round of data preparation, we used out-of-the-box capabilities from Data Integration Studio. In this second
round, we take advantage of the power of the SAS DATA step. The SAS online documentation defines the DATA
step as a group of SAS language statements that begin with a DATA statement and contains other programming
statements that manipulate existing SAS data sets or create SAS data sets from raw data files. The code approach
affords data scientists complete control over the data.
The Trilogy data set has two variables—SOURCE and SCRIPT_LINE. We discovered in the preliminary analysis that
data elements such as character name, location type (interior versus exterior), several layers of location information,
and some limited time information (day versus night) could be extracted.
So how do we go from blocks of text to character variables? In this section, we will break down the key pieces of the
code used.
In Figure 18, you will see an IF-THEN-ELSE block that examines each line in the script and determines whether it is a
LOCATION, CHARACTER, or DESCRIPTION. The characteristics of the data show us that if it is a LOCATION, it
will contain the abbreviations INT or EXT. The CHARACTER is always UPPERCASE and does not contain INT or
EXT. Anything else can be classified as a DESCRIPTION. The SUBSTR, COMPRESS, and NOTUPPER functions
are integral to this process.
Figure 18. SAS Code To Break out Location, Characters, and Descriptions from the Script Files
Once the script lines have been identified as LOCATION, CHARACTER or DESCRIPTION, we need to do some
additional processing. The CHARACTER and DESCRIPTION are easy because once they are defined, it is just a
single instance of the script line and is a simple assignment statement. The LOCATION is a bit more challenging. It
needs to be split because it can contain multiple sub-locations as well as a time period. The SCAN function works
nicely in these types of scenarios because it allows us to break a value into individual tokens based on a defined
delimiter. In this case, we will use a forward slash (Figure 19).
Figure 19. Use of the SCAN Function To Break Down LOCATIONINTERACTIVE DISCOVERY, EPISODE II
After two rounds of data preparation we have a robust Trilogy data set with 11 variables. Before we go back to SAS®
Contextual Analysis, it would be wise to work on a synonym list to ensure we have the cleanest view possible of the
data. Synonym lists can be used to group like-terms or synonyms together so that the analysis has less clutter and
repetition. Refer back to Figures 14 and 15. To create a synonym list, we need to create a data set with a specific
format, consisting of a Term (original word) and its role, TermRole (a part of speech or concept), the Parent we want
to associate the Term with and its role, the ParentRole.
Figure 20 shows a sample of the synonym list we will be working with. Notice the ability to insert custom concepts
into the ParentRole field.
Figure 20. Snapshot of a Synonym List
SAS® Contextual Analysis
With the synonyms introduced in SAS® Contextual Analysis, our Terms list looks much nicer. Now, in the most
frequently occurring Terms, we see folders, indicating synonyms. If the folder is expanded, all of the child terms are
shown rolling up to the defined parent, and that parent is associated with the assigned Concept (or ParentRole), as
illustrated in Figure 21.
Figure 21. Terms List after Employing a Synonym ListThus far, we have been focused on the steps necessary to address data concerns and the interactive discovery that
drives that process. Now we can start truly exploring the data. We will look at Term Maps, Topics, the method to
promote a Topic to a Category, and the addition of custom Categories we can score.
Figure 22 shows a Term Map from the Trilogy data set for Darth Vader. There is a nice link between Darth Vader,
the Emperor and Luke Skywalker, including a mention of Piett, the man who is made Admiral in the Empire Strikes
Back after Vader Force chokes Admiral Ozzel.
Figure 22. Term Map for Darth VaderContinuing down this path of discovery, if we look at the Term Map for Piett in Figure 23, we see the link between
Piett and his former title of Captain and his promotion to Admiral—both are linked with Darth Vader. Because Piett
is often involved in scenes on ships—primarily Star Destroyers, there are connections to bridge as well as the Star
Destroyer.
Figure 23. Term Map for PiettIf we take a step back and look at the Term Map for the word balance (Figure 24), we see links between balance,
force, Luke Skywalker, and the word back. Poignant since in the end Luke helps Anakin bring balance back to the
Force.
There is also another connotation for balance illustrated here—one more in reference to battles, with losing (lose)
balance or being knocked (knock) off balance.
Figure 24. Term Map for BalanceOne final Term Map is shown below in Figure 25. In this one, for force, the connections between Jedi, the Dark
Side, balance, and destiny are all apparent.
Figure 25. Term Map for the Force
Term Maps can be fun and insightful, as we have seen above, and can also be used to look for specific terms and
their relationships.
Topic extraction can help us figure out where the bigger trends are. Topics are defined as machine-generated
categories that indicate what documents are about by identifying different themes present in the document collection.Figure 26 shows the Topics panel from SAS® Contextual Analysis. In this view, users are presented with a list of
topics on the left, a word cloud on the right, and detailed documents tied to the highlighted topic below. It is also
possible to view Term Maps on topics.
Figure 26. Overview of Topics from SAS® Contextual Analysis
Once a topic of interest is identified, in this example +Darth Vader, +lord, +father, +emperor, +Luke Skywalker, we
can promote the topic as a category by simply clicking an icon ( ). Once promoted, we can open the Categories
screen (Figure 27).
Figure 27. The Categories Screen, Rules, and Documents
The Categories screen shows the categories on the left, the rules that were generated on the right, and the
documents at the bottom. In this case, the only automatically generated rule is about Darth Vader. The bar chartsshow percentages of true positives—documents in which the rule triggers and is correct (blue), false positives—
documents in which the rule triggers, and really should not (green), and false negatives—documents in which the rule
is not triggering, but probably should (red). These error bars help narrow documents and can be utilized for refining
the rules to make them trigger more appropriately.
We also have the power in the Categories screen to create our own categories with their associated rules. In a quest
to create more structured data for use in the visualization section, we created six categories (Figure 28). We
renamed and extended the category and rule that was automatically generated. (Refer back to Figure 27.) The new
category name is simply Bad Guys. The Bad Guys rules start with our existing Darth Vader rule, and add a few
other villains (Figure 29).
Figure 28. Custom Created Categories
Figure 29. Custom Created RulesRules can be as simple as CLASSIFIERS that look for basic keywords, or contain more complex linguistic
techniques. The rules to identify Bounty Hunters are shown in Figure 30.
Figure 30. Rules to Identify Bounty Hunters
After testing and refining the rules to achieve a good true positive rate, and minimize the false positive and false
negative errors, we can score the Trilogy data set against the rules. The scoring process matches the rules against
the data and creates new variables reflecting the hits. Specifically in this example, the following character variables
are created: GOOD_GUYS, BAD_GUYS, SYSTEMS, WEAPONS, and FORCE (the combining of the Force and
Dark Side categories).
VISUALIZATION
After completing two rounds of data preparation and two rounds of interactive discovery, we have a robust Trilogy
data set with 14 variables (shown in Figure 31)—all of this from three text files with no inherent structured data. We
have a nice selection of variables derived through a data process and variables derived as a result of analytical
scoring.
Figure 31. The Completed Trilogy Data Set with 14 VariablesSAS® Visual Analytics
The final step is to explore the data using SAS® Visual Analytics. SAS® Visual Analytics is tool for performing ad hoc
data analysis, visually exploring data, and report development. It leverages an in-memory analytic engine called the
SAS® LASR Analytic Server. With data sizes growing by leaps and bounds, in-memory technology is the only way to
get answers quickly and take full advantage of data assets.
We will explore some of the variables we derived and look at the out-of-the-box word cloud capability in SAS® Visual
Analytics.
In this first example (Figure 32), we see a distribution of the characters in the original Star Wars Trilogy. This is the
variable that was derived using the SAS DATA step and is indicative of a number of spoken parts in the script. This
visual does not show every character. We have the option below the graph to expand and contract the graph to show
more or less data.
Figure 32. Character Distribution by Frequency of Spoken PartsThe other DATA step derived variables center around location. SAS® Visual Analytics gives us the option to create
hierarchies, which work very well for the location variables that were pulled out of the script. Figure 33 shows the
interior locations defined inside the Death Star. The breadcrumb trail at the top: All Location Hierarchy > DEATH
STAR > INT provides the ability to easily traverse back to the previous levels in the hierarchy.
Figure 33. Death Star Interior LocationsFigure 34 shows Dagobah’s (Yoda’s swampy exile home) exterior location information.
Figure 34. Exterior Dagobah Locations
Next, we can look at a few of the variables that were created as a result of scoring the custom built rules in SAS®
Contextual Analysis.Figure 35 shows the percentage breakdown of mentions of the Force versus the Dark Side:
Figure 35. Graph Illustrating the Frequency of Mentions of the Force versus the Dark SideFigure 36 shows a breakdown of the frequency of specific weapon mentions, with the Death Star taking the highest
honors:
Figure 36. Frequency of Weapons Mentioned in the ScriptsFinally, Figure 37 shows the frequency of Planetary Systems mentioned in the scripts:
Figure 37. Frequency of Planetary Systems Mentioned in the ScriptsThe final visual we are going to explore is the out-of-the-box word cloud. The word cloud requires a unique row identifier
(SCRIPT_LINE_NUMBER) and a text variable defined as a document collection (SCRIPT_LINE). The result is shown
in Figure 38.
Figure 38. Word Cloud Generated by SAS® Visual Analytics on the SCRIPT_LINE Variable
CONCLUSION
As data sizes continue to increase and companies continue to fight for competitive advantage, having the ability to
understand the nuances and intricacies of data combined with the ability to analyze and report on that data go from
being nice to have to being imperative. This is especially true in the case of unstructured data. Unstructured data is
more plentiful than structured data and is often overlooked and undervalued because many analysts do not have the
skill set to manage such an asset. With the rise of the data scientist, this seemingly untapped resource becomes
more easily viable. The art of data science requires flexibility and a willingness and ability to take new approaches
with data. With an open mind and a varied array of skills, an analyst can cross the bridge to Data Jedi and add a
tremendous amount of value to the organization.
REFERENCES
SAS® Data Management: http://www.sas.com/en_us/software/data-management.html
SAS® Contextual Analysis: http://www.sas.com/en_us/software/analytics/contextual-analysis.html
Base SAS: http://www.sas.com/en_us/software/base-sas.html
SAS® Visual Analytics: http://www.sas.com/en_us/software/business-intelligence/visual-analytics.html
Internet Movie Script Database: http://www.imsdb.com
All Star Wars scripts are based on stories written by George Lucas, and Disney owns all copyrights.CONTACT INFORMATION
Your comments and questions are valued and encouraged. Contact the authors:
Mary Osborne
SAS Institute Inc.
SAS Campus Drive
Cary, NC 27513
http://www.sas.com
Work Phone: (919) 531-2765
E-mail: mary.osborne@sas.com
Adam Maness
SAS Institute Inc.
SAS Campus Drive
Cary, NC 27513
http://www.sas.com
Work Phone: (919) 531-4799
E-mail: adam.maness@sas.comYou can also read