EFFECT OF SYNTHESIS AND ACTIVATION METHODS ON THE CHARACTER OF COMO/ULTRASTABLE Y-ZEOLITE CATALYSTS
←
→
Page content transcription
If your browser does not render page correctly, please read the page content below
Open Chemistry 2021; 19: 745–754
Research Article
Khoirina Dwi Nugrahaningtyas*, Eddy Heraldy, Rachmadani, Yuniawan Hidayat,
Indriana Kartini
Effect of synthesis and activation methods on the
character of CoMo/ultrastable Y-zeolite catalysts
https://doi.org/10.1515/chem-2021-0064 by lowering the activation energy. The catalyst perfor-
received June 23, 2020; accepted May 31, 2021 mance can be evaluated based on the activity, selectivity,
Abstract: The properties of three types of CoMo/USY cata- stability, ease of regeneration, and reaction product quality.
lysts with different synthesized methods have been studied. The transition metal is widely used as a catalyst for
The sequential and co-impregnation methods followed by the hydrotreating process. Wang and coworkers state that
activation using calcination and reduction process have Co metal plays a role in the hydrogenation reaction [1];
been conducted. The properties of the catalysts were exam- meanwhile, Mo metals are more responsible for deoxy-
ined using Fourier-transform-infrared (FTIR) spectroscopy, genation reactions [2]. Li et al.’s study showed that a
X-ray diffraction (XRD) with refinement, and surface area catalyst based on NiMo metals, combination of both
analyzer (SAA). The FTIR spectrum study revealed the metals, gives more benefits for the reaction. A porous
enhanced intensity of its Bronsted acid site, and the XRD material as a host for the metals assists the dispersion
diffractogram pattern verified the composition of pure of the metal and prevents the agglomeration during the
metals, oxides, and alloys in the catalyst. The SAA demon- catalytic reaction process, as well as reducing the degen-
strated the mesoporous features of the catalyst. Scanning eration rate. Transition metals supported by a host mate-
electron microscopy showed an irregular particle mor- rial such as alumina (Al2O3), silica (SiO2), silica–alumina
phology. Additional analysis using the transmission elec- (SiO2–Al2O3), zeolite, and activated carbon have a larger
tron microscopy indicated that the metal has successfully surface area and a slower deactivation rate [3].
impregnated without damaging the USY structure. Rawat et al. said that the support of Al2O3 has a low
catalytic activity when compared with Ultrastable Y-zeo-
Keywords: catalyst, impregnation, physical activation, lite (USY) in a thiophene hydrodesulfurization (HDS)
acidity strength, morphology reaction [4]. Li and colleagues’ study showed that a cat-
alyst based on NiMo metals with the support of USY has
better HDS activity than supported by NaY, mordenite,
or ZSM-5 [3]. Meanwhile, Cho et al. reported that the
1 Introduction catalyst activity of the Ni2P/USY on the hydrodeoxygena-
tion (HDO) reaction is better than Ni2P without the sup-
Hydrotreating is a reaction carried out under hydrogen port of any porous material [5].
gas flow in the presence of a catalyst to remove sulfur, The synthesis and impregnation method that affects
oxygen, and nitrogen and to saturate the hydrocarbon. the catalyst quality has been revealed in this study.
This process requires a catalyst to accelerate the reaction The preparation process of metal supported by porous
material involves two stages: metal insertion to support
and catalyst activation. The first stage can be achieved
by several methods such as precipitation, adsorption,
* Corresponding author: Khoirina Dwi Nugrahaningtyas,
Department of Chemistry, Faculty of Mathematics and Natural ion exchange, and impregnation. The second stage is
Sciences, Sebelas Maret University, Jl. Ir. Sutami 36A, Surakarta, activation with the aim to increase the catalyst activity.
Indonesia, e-mail: khoirina@mipa.uns.ac.id According to Augustine [6], activation can be initiated
Eddy Heraldy, Rachmadani, Yuniawan Hidayat: Department of chemically by adding an acid or base to dissolve acidic
Chemistry, Faculty of Mathematics and Natural Sciences, Sebelas
or alkaline impurities. Alternatively, activation can be
Maret University, Jl. Ir. Sutami 36A, Surakarta, Indonesia
Indriana Kartini: Department of Chemistry, Faculty of Mathematics
initiated physically by drying, calcination, oxidation,
and Natural Sciences, Universitas Gadjah Mada, Yogyakarta, and reduction. The Pt–Sn/SiO2 catalyst showed a better
Indonesia activity for hydrogenation reaction when activated physically
Open Access. © 2021 Khoirina Dwi Nugrahaningtyas et al., published by De Gruyter. This work is licensed under the Creative Commons
Attribution 4.0 International License.
746 Khoirina Dwi Nugrahaningtyas et al.
by calcination and reduction process. A similar perfor- [(NH4)6Mo7O24·4H2O] solution simultaneously with 0.053 M
mance was not observed when the catalyst was proceeded of [Co(NO3)2·6H2O). Then, the mixture is refluxed, filtered,
by additional steps such as oxidation after calcination [7]. and dried. Following the previous calcination and reduction
Therefore, the catalysts used in this study were prepared process, the calcined and reduced powder were labeled as
by co-impregnation and sequential impregnation methods Cc and Cr, respectively. All of the activated products are kept
followed by the catalyst activation, where the activation is in the desiccator.
done by calcination and reduction steps only. The novelty X-ray diffraction (Philips X’Pert) was used to analyze
of the study is to analyze the effect of the impregnation the crystallinity and phase-type of the catalyst. The func-
method and its activation on the catalyst’s character, espe- tional group’s properties were analyzed using a Shimadzu
cially the acid’s strength. FT-IR 8201 PC. While the quantity of total acidity of the
catalyst was analyzed with the gravimetry method using
ammonia as probe molecules [8,9]. The surface area was
analyzed using SAA NOVA 1200e. The catalyst morphology
2 Experimental was analyzed using SEM JSM-6510 (accelerating voltage of
6 kV) and JEOL/EO JEM 1400 ver 1.0 TEM (accelerating
voltage of 120 V). The sample was dispersed on solvent
2.1 Material
before the TEM observation. The analytical methods for
catalyst characterization were performed according to the
NH4-Y zeolite (HSZ-300 series: 341NHA) was purchased from
procedure followed in our previous publication [10,11].
Tosoh Inc (Japan). Other materials in p.a grade were pur-
chased from Merck (Germany), i.e., ammonium heptamolyb-
Ethical approval: The conducted research is not related to
date, cobalt(II) nitrate hexahydrate, and ammonia (25%).
either human or animal use.
2.2 Catalyst preparation and
characterization
3 Results and discussion
NH4-Y zeolite was calcinated at 550°C under N2 for 3 h to
obtain H-USY. It was followed by the impregnation of Co 3.1 The characterization of the catalyst
and Mo.
An amount of H-USY and ammonia 25% were soaked The diffraction pattern analysis is shown in Figure 1a–c.
on 0.111 M of [(NH4)6Mo7O24·4H2O] solution and refluxed Refinement of the catalyst was carried out by fitting with
for 2 h at 60°C. Then, the solution was filtered, and the the standard of Zeolite Y (ICSD #31542), cobalt(II) oxide
residue was added to 0.053 M of [Co(NO3)2·6H2O] solu- (ICSD #9865), molybdenum(VI) oxide (ICSD #36167), cobalt(II)
tion. The mixture was refluxed again for 2 h at 60°C, molybdenum(VI) oxide (ICSD #281235), cobalt metal (ICSD
then filtered and dried with a rotary evaporator at #41507), molybdenum metal (ICSD #173127), and an alloy
200 mbar and 48°C, until obtained powder product. The of cobalt molybdenum (ICSD #624215).
sequential impregnation process with the order such as Figure 1a–c shows that the catalyst has similar dif-
Mo followed by Co was denoted as “Ap.” The powder was fraction patterns in general but differs only in intensity.
activated by calcination for 3 h at 550°C under N2 gas, and The addition of Co and Mo increases the intensity of the
the sample obtained in this step was, namely, “Ac.” The observed peak (*), which is 2θ (°) of 10.2°, 15.8°, and
next step, the reduction process, was used on some amount 23.8°. These identical diffraction patterns indicate no
of calcinated powder. It was conducted under the H2 gas for structural changes in USY with the metal addition. It
2 h at 400°C and labeled as “Ar.” can be concluded that the impregnation methods were
The impregnation process of metals with reversed order, successful, and the structure of the catalysts was not
Co followed by Mo, was denoted as “Bp.” The method collapsed.
refers to “Ac” and “Ar” was repeated for Bp and labeled The correspondence between XRD diffraction and
as Bc and Br, respectively. refinement of Inorganic Crystal Structure Database (ICSD)
The last method, called “Cp,” was prepared using was determined by Rietica software using Le Bail methods.
the co-impregnation method. An amount of H-USY was The refinement molar weight percentage of particles in the
added with ammonia and then immersed in 0.111 M of catalyst has resulted in the analysis (Table 1).Effects of synthesis and activation methods 747
(a) * The acidity strength of alumina–silica such as zeolite
* H-USY
can be studied using FTIR spectroscopy. Theoretically,
*
the typical absorption band of the hydroxyl group –
stretching mode indicated the presence of the Brønsted
Intensity (a.u.)
Ap
acid site [12,13]. Zeolites have a firm acidity when the
bridging OH bond is weakened. It is indicated by the
Ac reduced frequency of OH stretching.
Figure 2 shows the OHstretch by the wavenumber of
3408 cm−1, obtained from the Brønsted acid site USY [12].
Ar According to Niwa et al., the most strongest Brønsted acid
site of the zeolite was obtained at the wavenumber
3595 cm−1 [13]. The vibrational shift to lower wavenumber
20 40 60 80 (from 3595 to 3408 cm−1) indicates an increase in the
2 Thetha (o)
strength of OH Brønsted caused by the synergistic influ-
ence of the Brønsted and Lewis acid sites [14].
(b) Figure 2 also presented the comparison FTIR spectra
* * H-USY
of USY and labeled catalysts as Ap, Bp, and Cp. The
* spectra of Ap, Bp, and Cp show absorption at 3100 and
1400 cm−1, which indicated a bond stretch and a bend of
Intensity (a.u.)
Bp
the NH from the amine group. The appearance of the new
absorption is due to the interaction between the ammonia
precursors and USY. Two bands are observed around
700–800 cm−1, known as the external Si/Al–O.
Bc
The appearance of the band at 1650–1600 cm−1 indi-
cates the vibration OHbend of the adsorbed water [15]. The
Br
absorption at the wavenumber 1140–995 cm−1 is derived
from the Si–O–Si (Al)stretch bond [16,17], while the uptake
20 40 60 80
of the internal Si (Al)–O functional group absorption
2 Thetha (o) appears at 420–500 cm−1.
The spectra’s redshifts or blueshifts indicate the bond
(c) strength change due to the interaction between loaded
* * H-USY metals and the USY [14]. The redshift is a peak shift toward
* a larger wavelength (small wave number) indicating weak
bond strength, as the opposite of the blueshift.
Intensity (a.u.)
Cp In comparison to the absorption spectra of the NH
stretch of Ap, Figure 2 confirms a redshift and blueshift
for Cp and Bp, respectively. The redshift on Cp indicates a
Cc
more robust interaction of the Co and O framework than
the others. The functional group of NHbend also shows a
firmly bound on the Cp, in contrast with the weakly
Cr
attached of Co on the Ap and Bp. Figure 2 demonstrates
a blueshift of the OH’s absorption on the Cp and redshift
20 40 60 80 on the Ac dan Bc, affirming a more superior bonding of
2 Thetha (o) OH groups on the Cp than on the Ac and Bc.
The OHbend functional group of Bp has a strong
Figure 1: (a) Diffraction patterns of Y zeolite ICSD #31542, and bonding, while the Ap is weak. This weak bonding occurs
catalyst sample that was produced by impregnation Molybdenum because the CoO is bound to the Oxygen atom of the OH
followed by Cobalt precursor after (Ap) impregnation, (Ac) calcination,
functional group. As a consequence, the bonding between
and (Ar) reduction. (b) Diffraction patterns of Y zeolite ICSD #31542, and
catalyst sample that was produced by impregnation Cobalt followed by O and H (OH bend) is weakened.
Molybdenum precursor after (Bp) impregnation, (Bc) calcination, (Br) The bonds of Si (Al)–O in the Cp catalyst’s internal
reduction. (c) Diffraction patterns of (A) Standard Y zeolite ICSD #31542, and external frameworks are weaker than the Bp catalyst.
and catalyst sample that was produced by co impregnation methods
after (Cp) impregnation, (Cc) calcination, (Cr) reduction.748 Khoirina Dwi Nugrahaningtyas et al.
Table 1: Particle molar weight percentage data on the catalyst
Phase Molar weight percentage (%)
Ap Ac Ar Bp Bc Br Cp Cc Cr
Zeolit Y 99.42 99.35 99.69 99.55 99.41 99.45 99.80 99.71 99.87
CoO 0.13 0.13 0.13 — 0.13 — — 0.13 —
MoO3 0.34 0.34 — 0.34 0.34 0.34 — — —
CoMoO4 0.11 0.11 0.11 0.11 0.11 0.11 0.11 0.11 0.11
Co — 0.07 0.07 — — 0.07 0.07 — —
Mo — — — — — 0.03 — 0.03 —
CoMo — — — — — — 0.02 0.02 0.02
USY
OH stretch OH bend T-O asymmetric stretch Ap
NH bend Bp
100 Cp
T-O symmetric stretch
80 T-O bend
Transmittance (%)
60
40
20
0
3500 3000 2500 2000 1500 1000 500
-1
Wavenumber (cm )
Figure 2: FTIR spectra of catalyst after impregnation process.
The Co, which binds to the O via its lone pair electrons, were probably caused by the Mo and CoMo metals that
disturbs the framework’s strength. The strength of the Si are bonded to O atoms on USY. The functional group
(Al)–O internal and external bonds of the Ap catalyst is stretching on the Si–O–Si (Al) is obtained: a blueshift
equal to the Bp catalysts, confirmed by the similar pattern for the Ac catalyst and a redshift for the Bc catalyst. It
of the obtained Si (Al)–O. indicates a strong interaction between metal and the
The spectra of the catalysts after the calcination pro- functional group stretching on the Si–O–Si (Al) from
cesses (Ac, Bc, and Cc) are presented in Figure 3. The the USY framework. The shift to the smaller wavenumber
spectra’s difference before and after calcination can (redshift) for the external Si (Al)–O of Ac and Bc catalysts
indicate the catalyst functional group’s changes, for shows a decrease in bond strength when compared with
example, a loss of the amine group. However, the shift the Cc. The blueshift wavenumber of Cc indicates that the
in the wavenumbers, referring to the stronger or weaker metal MoO3 has a strong interaction on the Si (Al)–O
bond, also contributes to it. The comparison is illu- internal bond.
strated in Figures 3 and 4, respectively. The next analysis compares the phenomenon after
The OH functional group’s stretch shows a blueshift the reduction process for the catalyst with co-impregna-
for the Bc and a redshift for the Cc catalyst when com- tion and sequential impregnation methods. The FTIR
pared with Ac and USY (Figure 3). These phenomena absorption spectra of the catalyst is depicted in Figure 4.Effects of synthesis and activation methods 749
OH stretch OH bend T-O asymmetric stretch USY
Ac
Bc
100 Cc
T-O symmetric stretch
80 T-O bend
Transmittance (%)
60
40
20
0
3500 3000 2500 2000 1500 1000 500
-1
Wavenumber (cm )
Figure 3: FTIR spectra of catalysts after the calcination process.
The shift of the adsorption wave number from the FTIR While the blueshift for the Br and Cr confirming a stronger
spectra shows the effect of Co and Mo metals on the bond bond. The adsorption of water molecules on the catalyst
strength of the catalyst functional groups. The OH bend on causes weakening of the OH bonds functional groups
the catalyst Ar obtained a redshift when compared with The shift of the wavenumber of Si–O–Si (Al) stretching
Ac, indicating a decrease in the bond strength of OH. refers to the blueshift for Ar and Cr, indicating a stronger
USY
OH stretch OH bend T-O asymmetric stretch Ar
Br
Cr
100
T-O symmetric stretch
80
Transmittance (%)
T-O bend
60
40
20
0
3500 3000 2500 2000 1500 1000 500
Wavenumber (cm-1)
Figure 4: FTIR spectra of catalysts after the reduction process.750 Khoirina Dwi Nugrahaningtyas et al.
bond. Meanwhile, the redshift in Br indicates a weak bond, Co metals accept free-electron pairs from the O atoms
probably a consequence of the strong interaction between at OH, which causes a weak bond between OH stretch
metal and USY. The external Si (Al)–O showed a blueshift and OH bend.
in Ar, revealing an increase in the bond strength. For Cr, The Si–O–Si (Al) stretch has a strong bond for the Ar
the redshift indicates a weak bond from the interaction catalyst and a weak bond for the Br catalyst. It is probably
between O and Mo metal, following Anderson statements due to the weak bonds that are formed by the OH bend of
[18]. The bond strength of OH is affected by the interaction Si (Al)–O internally. Meanwhile, the internal functional
between Mo and Oxygen atoms on USY. Robust interaction groups (Al)–O for Ar and Br obtained a weak bond, and
between Mo and O causes the weakness of the OH-catalyst the Cr catalyst obtained a strong bond. The occurrences
bond. In contrast, for Br, the solid bond formation of the were allowed because on the Ar and Br catalysts, the
internal functional group is observed by the blueshift of presence of Co metals was interfering with the internal
the Si (Al)–O internal. Si (Al)–O bond.
Generally, the OH groups of all the catalysts under- The results of total acidity analysis and the specific
went a blueshift compared to USY (Figure 4). Except for surface area of the catalyst are listed in Table 2. It was
the Ar and Br, the OH wavenumber shifted to a weaker found that the total acidity and specific surface area of
bond (redshift) than in USY. Probably, it is caused by the catalysts increase after the calcination process, which
the interaction of water molecules with the hydrophilic indicates that this process is sufficient to remove impu-
groups. The blueshift of Cr indicates that such interaction rities from the catalyst surface. Further effects include
did not occur. the opening of pores and increasing active sites that
The Si–O–Si (Al) functional groups on the Ar and Cr are characterized by the absorption of ammonia. An
catalysts have a stronger bond than USY. Contradictive to increase in acidity supports the FTIR spectral data, where
Br, with the smallest shift on wavenumbers, the Br cata- the absorption of wavenumber in the increasingly large
lyst’s framework structure has the weakest bond. The Si–O–Si (Al) stretch functional group due to loss of Al3+
weakness of the framework is contributed by the strong cations after calcination indicates that after the calcining
interaction of loaded metal and the USY. For a similar process the catalysts are increasingly acidic [19].
reason, the shift of the wavenumber of Si (Al)–O external After the reduction process, the total acidity and spe-
from Ar, Br, and Cr was smaller than USY. The Si (Al)–O cific surface area of the Ar catalyst are decreased. The
internal cluster in contrast gained a blueshift when com- closure of the pore and active sites by the metal is respon-
pared with USY. sible for reducing the acidity. The specific surface area of
The catalyst after reduction (Figure 4) has the same the Br catalyst is equal to Bp, but its total acidity was
phenomenon as the catalyst after calcination, i.e., the OH decreased. The decrease in the intensity of the Si–O–Si
stretch undergoes a blueshift for the Cr catalyst and a (Al) stretching relates to the acidity’s weakness. In con-
redshift for the Br catalyst. The cluster of OH bend under- trast, the total acidity of Cr increases, but its specific sur-
goes a blueshift for the Cr catalyst and a redshift for the face area is decreased. The smaller of the specific surface
Ar catalyst. This phenomenon was the same as that area can be occurred by the loss of CoO and Mo in the
which occurs on the Cp catalyst, where Lewis sites of calcination process. Another possibility is pore blockage
Table 2: Acidity value, specific surface area, and phase type of catalyst
Catalyst name Acidity value Average pore Specific surface Phase type
(mmol/g) radius (Å) area, SBET (m2/g)
Ap 9.402 14.440 440.497 Y Zeolite, CoO, MoO3, CoMoO4
Ac 10.481 14.899 446.762 Y Zeolite, CoO, MoO3, CoMoO4, Co
Ar 8.304 16.227 437.782 Y Zeolite, CoO, CoMoO4, Co
Bp 11.288 15.208 534.782 Y Zeolite, MoO3, CoMoO4
Bc 11.623 15.570 557.113 Y Zeolite, CoO, MoO3, CoMoO4
Br 10.849 15.113 557.172 Y Zeolite, MoO3, CoMoO4, Co, Mo
Cp 8.637 17.821 526.424 Y Zeolite, CoMoO4, Co, CoMo
Cc 9.575 17.575 544.299 Y Zeolite, CoO, CoMoO4,
Mo, CoMo
Cr 11.206 17.590 497.004 Y Zeolite, CoMoO4, CoMoEffects of synthesis and activation methods 751
by CoMoO4 or CoMo formation on the surface. The pre- 35
H-USY
Amount of Particles (%)
sence of acidic CoMo particles enhances the total acidity. 30
Ar
The acidity value of all catalysts listed in Table 2 is higher
25 Br
than that of the previous research [20–22] but lower than Cr
20
the results of Anggoro and Co-worker’s study [23]; it is
because the addition of metal in this research was much 15
lower than in the Anggoro and Co-worker’s study [23]. 10
The presence of impregnated metals in the catalyst 5
can be observed morphologically by using SEM and TEM.
0
Besides, SEM and TEM can also show the size of a particle 0.21 0.411 0.61 0.8
81 1.01 1.21 1.41 1.61 1.811 2.01
in a sample. SEM analysis of USY and catalyst samples Average Value of Particle Size (μm)
after reduction is shown in Figure 5.
Figure 6: Relationship of average particle size and percentage of
In morphology at 10,000× magnification, it can be
particles amount.
seen that after the addition of Co and Mo metal, there is
a change in the particle size of the catalyst. Figure 5
shows that the Ar (Figure 5b), Br (Figure 5c), and Cr
(Figure 5d) catalysts contain heterogeneous particles, catalysts have heterogeneous particle sizes, according
whereas USY (Figure 5a) has the size of homogeneous to the results of XRD pattern analysis that both types of
particles. The change in morphology indicates that the catalysts contain various types of metal phases, such as
metal is impregnated successfully in USY. Also, Figure 5 pure metals, metal oxides, and metal alloys.
shows that the Cr catalyst is dominated by particles The result of characterization using SEM was also
smaller than those of the Ar and Br catalysts. analyzed in terms of the dispersive energy of X-ray spec-
Based on Figure 6, it was found that USY has a par- troscopy (EDX). EDX analysis was conducted to deter-
ticle size with a dominant value at 0.61 μm. The Ar cata- mine the percentage weight of the mass of particles con-
lyst has a small particle size, about 0.21–1.21 μm, with a tained in Ar, Br, and Cr catalysts. The mass percentage
predominant particle size of 0.41 μm. While Br and Cr data of the particles is listed in Table 3.
Figure 5: Morphology of (a) USY; catalyst after reduction process that produces by (b) co impregnation methods (Ar); sequential impreg-
nation methods where (c) cobalt was impregnated firstly followed by Molybdenum precursor (Br), and vice versa (d) molybdenum was
impregnated first followed by cobalt precursor.752 Khoirina Dwi Nugrahaningtyas et al.
Table 3: The mass percentage data of the particles Table 3 lists the obtained elements of O, Al, Si, Co,
and Mo in catalysts in detail. The dominant mass percen-
Catalyst Mass percentage data (%) Si/Al ratio tage of O, Al, and Si elements indicates that the USY
O Al Si Co Mo composition in the catalyst is more than Co and Mo.
The Si/Al ratio is obtained based on the mass percentage
Ar 76.95 4.87 16.43 0.80 0.95 3:1
ratio of Si and Al, which shows that the Si/Al ratio of all
Br 82.08 3.82 12.51 0.59 1.00 3:1
Cr 80.04 4.35 14.43 0.49 0.69 3:1 catalysts is equivalent to 3:1. The higher Si/Al ratio
Figure 7: TEM Images of USY (a) with a magnification of 50,000×, (b) EDX spectra, and (c) diffraction pattern.
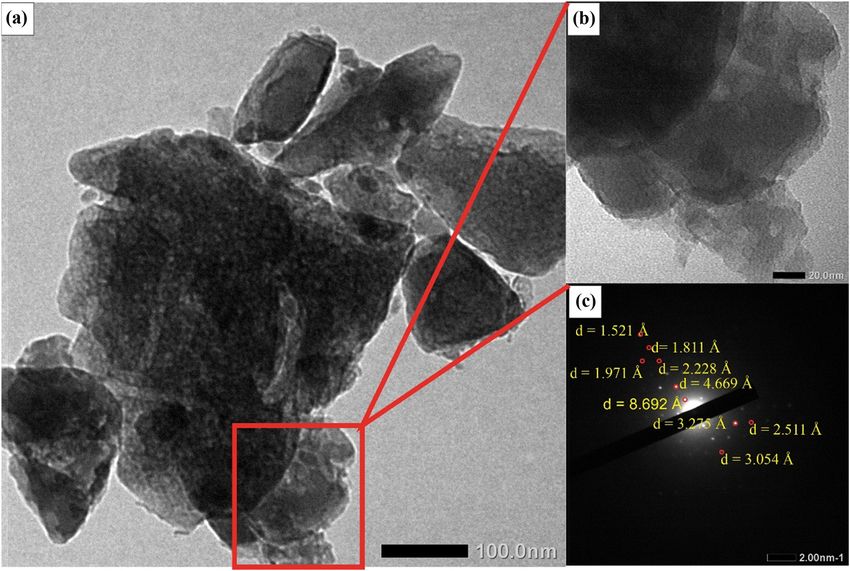
Figure 8: TEM Image of Br catalyst with magnification on (a) 40,000×, (b) 150,000×, and (c) diffraction pattern.Effects of synthesis and activation methods 753
suggests that the catalyst has a high degree of acidity. 3.275 Å, which are equivalent to the presence of the d220,
Anderson and coworker’s research showed that the addi- d511, and d642 of H-FAU.
tion of Mo and Co metals on USY, followed by the calci- USY, when exposed by Co and Mo metals, also showed
nation, oxidation, and reduction process, lead to the ratio a diffraction pattern corresponding to the basal spacing, d
was reduced to 2:1 [18]. This research concludes that cat- for metal Co (JCPDS #05-0727) at 1.971 and 1.811 Å, for
alysts with the activation using calcination and reduction metal Mo (JCPDS #42-1120) at 2.228 and 1.575 Å, and for
process without oxidation step produce a better Si/Al CoMo4 (JCPDS #28-1235) at 3.054 and 2.511 Å. The results of
ratio. the analysis indicated that Co and Mo particles were suc-
The morphological analysis of metals was done in cessfully embedded in USY as in the form of metals with
detail using TEM. The shape, type, and composition of zero oxidation numbers and metal oxides.
metals on USY were figured out. The first phase of ana-
lysis using TEM was done on USY samples. The data
of the USY sample analysis using TEM is presented in
Figure 7. Based on the TEM USY micrograph analysis 4 Conclusion
shown in Figure 7a, the physical form of USY crystals
was obtained. Meanwhile, the analysis using EDX (Figure 7b) The results showed that the best catalyst was Bc according
shows that the sample has an elemental composition to the phase composition (zeolite Y, MoO3, CoMoO4, Mo,
of 40.44 wt% oxygen (0.525 keV), 13.17 wt% alumina and CoMo), the value of the total acidity (10.849 mmol/g)
(1.486 keV), and 46.40 wt% silica (1.739 keV). The ele- and specific surface area (557.172 m2/g), and the particle
ment composition is equivalent to the composition of size. Therefore, based on these characteristics, it is con-
Al2O3 and SiO2, respectively, 22.11 and 77.89 wt%. From cluded that catalyst Bc will provide the best performance.
further analysis of the diffraction pattern (7C), it was
found that the sample had basal spacing (d) that corre- Acknowledgments: The authors would like to thank The
sponded to the lattice plane 111, 311, 511, 622, and 822 of Ministry of Research Technology and Higher Education
faujasite. Both the micrograph and the diffraction pattern that supported this work through the HIBAH KOMPETE-
of the USY sample showed clean crystals, without any NSI Grant [Contract No. 873/UN2.21/PP/2017] and PENE-
impurities. LITIAN DASAR UNGGULAN PERGURUAN TINGGI [Contract
The results of the TEM image analysis are in accordance No. 719/UN27.21/PN/2019].
with the results of the analysis using XRD (Figure 1), which
states that the carrier sample used is synthetic faujasite with Funding information: This work was funded by The
type Y zeolite, which is thermally stable (USY). The absence Ministry of Research Technology and Higher Education
of impurities apart from being supported by the results of through HIBAH KOMPETENSI Grant [Contract No. 873/
analysis using XRD, the analysis is also supported by the UN2.21/PP/2017] and PENELITIAN DASAR UNGGULAN
results of the analysis using SEM (Figure 5a). PERGURUAN TINGGI [Contract No.719/UN27.21/PN/2019].
The distribution of particles over the catalyst can be
determined by the white dots present in the catalyst Author contributions: N.K.D. – conceptualization and super-
(Figure 8). This analysis was performed on Br catalysts vision; N.K.D., H.Y. – writing-review and editing; H.E., H.Y.,
that were prepared with the sequential impregnation method K.I. – formal analysis; and R.: investigation.
shown in Figure 8. In Figure 8, the white dots show the
morphology, which indicate the presence of particles or Conflict of interest: Authors declare no conflict of interest.
metal impregnated on the USY. There is also a channel
showing the presence of pore channels in the catalyst. Data availability statement: The datasets generated during
As shown in Figure 8, the results of the analysis and/or analyzed during the current study are available from
showed some dots on USY as same as in a red square. the corresponding author on reasonable request.
It causes a change in the morphology of USY. The dots are
thought to come from particles embedded in the USY pore
cavity. The types of particles carried on USY were ana-
lyzed using the plotting method between basal spacing References
data from the diffraction patterns of TEM, JCPDS, and XRD
data. It was found that the diffraction pattern (Figure 8c) [1] Wang W, Yang Y, Luo H, Liu W. Characterization and hydro-
corresponds to the basal spacing, d, of 8.692, 4.669, and deoxygenation properties of Co promoted Ni-Mo-B amorphous754 Khoirina Dwi Nugrahaningtyas et al.
catalysts: influence of Co content. React Kinet Mech Catal. site in ultrastable y (USY) zeolite. J Phys Chem B [Internet];
2010;101(1):105–15. 2006 Jan 9 [cited 2017 Aug 31];110(8):264–9. Available from:
[2] Kubička D, Kaluža L. Deoxygenation of vegetable oils over https://www.researchgate.net/publication/228507040.
sulfided Ni, Mo and NiMo catalysts. Appl Catal A Gen [14] Niwa M, Suzuki K, Morishita N, Sastre G, Okumura K, Katada N.
[Internet]. 2010 Jan 15 [cited 2017 Aug 31];372(2):199–208. Dependence of cracking activity on the Brønsted acidity of Y
Available from: http://linkinghub.elsevier.com/retrieve/pii/ zeolite: DFT study and experimental confirmation. Catal Sci
S0926860X09007431. Technol [Internet]. 2013;3(8):1919. Available from: http://
[3] Li D, Xu H, Guthrie JrGD. Zeolite-supported Ni and Mo catalysts xlink.rsc.org/?DOI=c3cy00195d.
for hydrotreatments: II. HRTEM. J Catal [Internet]. [15] Korkuna O, Leboda R, Skubiszewska-Ziȩba J, Vrublevs’ka T,
2000;189:281–96. Available from: https://www.sciencedirect. Gun’ko VM, Ryczkowski J. Structural and physicochemical
com/science/article/pii/S0021951799927239. properties of natural zeolites: clinoptilolite and mordenite.
[4] Rawat KSK, Kumar M, Gupta J, Bal R, Dhar G, Data A, et al. Microporous Mesoporous Mater. 2006;87(3):243–54.
Catalytic functionalities of USY zeolite supported hydro- [16] Handke M, Mozgawa W. Vibrational spectroscopy of the
treating catalysts. In: Galarneau A, Fajula F, Di Renzo FJV, amorphous silicates. Vib Spectrosc. 1993;5(1):75–84.
editors. Studies in surface science and catalysis [Internet]. Available from: https://linkinghub.elsevier.com/retrieve/pii/
Amsterdam: Elsevier Inc.; 2001 [cited 2016 Dec 21]. p. 301. 092420319387057Z.
Available from: http://catalysis.eprints.iitm.ac.in/1875/1/ [17] Anggoro DD, Buchori L, Silaen GC, Utami RN. Preparation,
OP32.doc. characterization, and activation of Co-Mo/Y zeolite catalyst for
[5] Cho A, Shin J, Takagaki A, Kikuchi R, Oyama ST. Ligand and coal tar conversion to liquid fuel. Bull Chem React Eng Catal.
ensemble effects in bimetallic NiFe phosphide catalysts for the 2017;12(2):219–26.
hydrodeoxygenation of 2-methyltetrahydrofuran. Top Catal. [18] Anderson JA, Pawelec B, Fierro JLG. Mo-USY zeolites for
2012;55(14–15):969–80. hydrodesulphurization. I. Structure and distribution of
[6] Augustine RL. Heterogeneous catalysis for the synthetic che- molybdenum oxide phase. Appl Catal A, Gen [Internet]. 1993
mist. New York: Marcel Dekker, Inc; 1996. p. 647. Jun 4 [cited 2017 Oct 22];99(1):37–54. Available from: http://
[7] Deng L, Shishido T, Teramura K, Tanaka T. Effect of reduction www.sciencedirect.com/science/article/pii/
method on the activity of Pt-Sn/SiO2 for dehydrogenation of 0926860X9385038Q.
propane. Catal Today [Internet]. 2014 Sep [cited 2017 Aug [19] Mozgawa W. The influence of some heavy metals cations on
11];232:33–9. Available from: http://linkinghub.elsevier.com/ the FTIR spectra of zeolites. J Mol Struct [Internet]. 2000 [cited
retrieve/pii/S0920586113005506. 2017 Sep 25];555:299–304. Available from: https://www.
[8] Tyagi B, Chudasama CD, Jasra RV. Determination of structural sciencedirect.com/science/article/abs/pii/
modification in acid activated montmorillonite clay by FT-IR S002228600000613X.
spectroscopy. Spectrochim Acta Part A Mol Biomol Spectrosc. [20] Belskaya OB, Danilova IG, Kazakov MO, Mironenko RM,
2006;64(2):273–8. Lavrenov AV, Likholobov VA. FTIR spectroscopy of adsorbed
[9] Barzetti T, Selli E, Moscotti D, Forni L. Pyridine and ammonia as probe molecules for analyzing the surface properties of sup-
probes for FTIR analysis of solid acid catalysts. J Chem Soc ported Pt (Pd) catalysts. In: Theophile T, editor. Infrared
Faraday Trans. 1996;92(8):1401–7. spectroscopy-materials science, engineering and
[10] Nugrahaningtyas KD, Rahmawati N, Rahmawati F, Hidayat Y. technology [Internet]. Russia: InTech; 2012. p. 149–78.
Synthesis and characterization of CoMo/mordenite catalyst Available from: http://doi.wiley.com/10.1002/chin.
for hydrotreatment of lignin compound models. Open Chem 201351237.
[Internet]. 2019 Dec 19;17(1):1061–70Available from, https:// [21] Xing J, Song L, Zhang C, Zhou M, Yue L, Li X. Effect of acidity
www.degruyter.com/view/journals/chem/17/1/article-p1061.xml. and porosity of alkali-treated ZSM-5 zeolite on eugenol
[11] Sesario R, Dwi K, Rahmawati F, Heraldy E, Rachmadani. hydrodeoxygenation. Catal Today [Internet]. 2015
Characterization of metal particles on supporting materials Dec;258:90–5. Available from: https://linkinghub.elsevier.
mordenite, ultra stable y zeolita, and natural zeolit. In: com/retrieve/pii/S0920586115002436.
Kusumawardani C, Abadi AM, Suyanto S, Wilujeng I, editors. [22] Wang Y, Zeng P, Li H, Guo Q, Shen B. Influence of zirconium
AIP Conference Proceedings. Yogyakarta, Indonesia: AIP modified USY on coupled hydrogenation and ring opening of
Publishing; 2017. p. 020002. Available from: https://doi.org/ tetralin over NiW/USY + Al2O3. Catal Letters [Internet]. 2017 Jul
10.1063/1.4995088. 13;147(7):1704–13. Available from: http://link.springer.com/
[12] Weitkamp J, Puppe L, editors. Catalysis and zeolites: funda- 10.1007/s10562-017-2075-8.
mentals and applications. New York: Springer Berlin [23] Anggoro DD, Buchori L, Friandani T, Ramadhan ZR. Effect of Co
Heidelberg; 1999. p. 564. and Mo metal addition in Co-Mo/Zeolite Y catalyst for coal tar
[13] Niwa M, Suzuki K, Katada N, Niwa M, Suzuki K, Isamoto K, conversion to liquid fuel. Chem Eng Trans.
et al. Identification and measurements of strong brønsted acid 2017;56(May):1717–22.You can also read