Norwich Economic Barometer - July 2021 City Council - Norwich City Council
←
→
Page content transcription
If your browser does not render page correctly, please read the page content below
July 2021

Norwich Economic Barometer

                    ~ City Council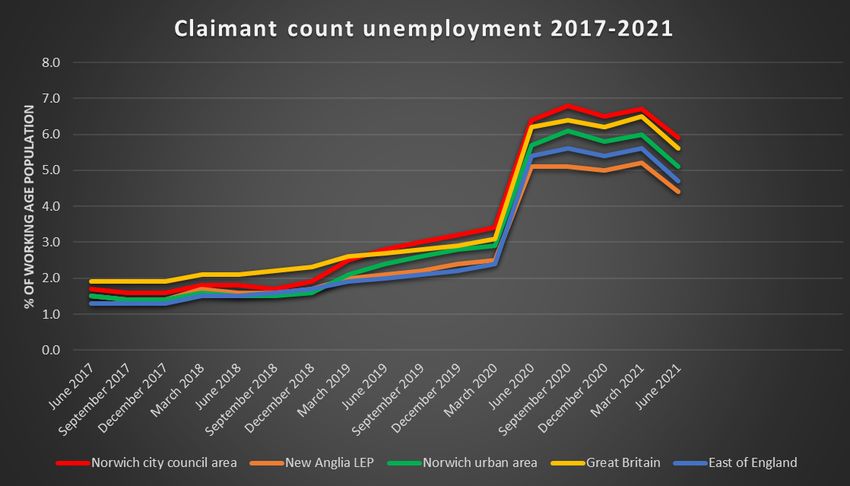
CONTENTS
BUSINESS NEWS ................................................................................................................. 2
   ECONOMY ............................................................................................................................ 2
   LOCAL BUSINESS .................................................................................................................. 6
   EDUCATION .......................................................................................................................... 7
CLAIMANT COUNT UNEMPLOYMENT................................................................................ 8
      Table 1            Claimant count unemployment rate ............................................................ 8
WARD LEVEL CLAIMANT COUNT UNEMPLOYMENT ....................................................... 9
      Table 2                 Claimant count unemployment ............................................................. 9
CLAIMANT COUNT UNEMPLOYMENT: MALE/FEMALE .................................................. 10
HOUSING BENEFIT ............................................................................................................ 11
      Table 3             Norwich City Council housing benefit claimants ...................................... 11
AVERAGE HOUSE PRICES ............................................................................................... 12
CITY CENTRE VITALITY .................................................................................................... 13
APPENDIX........................................................................................................................... 16

                                                                                                                                       1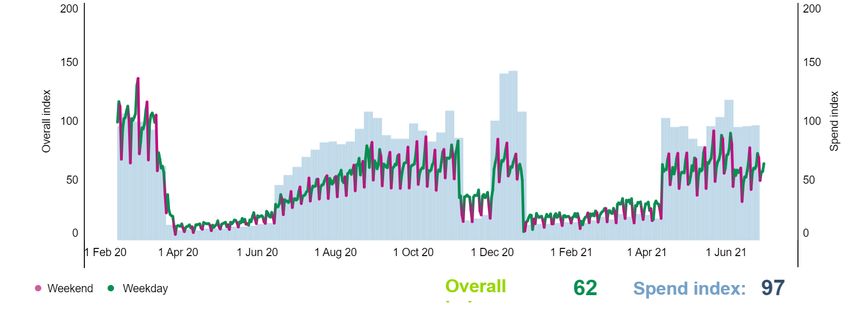
Business news
Economy
•   The Consumer Prices Index including owner occupiers’ housing costs (CPIH) rose by 2.4
    per cent in the 12 months to June 2021, up from 2.1 per cent in the 12 months to May.
    The largest upward contribution to the CPIH 12-month inflation rate came from transport
    (0.80 percentage points). On a monthly basis, CPIH rose by 0.4 per cent in June 2021,
    compared with a rise of 0.1 per cent in June 2020. Prices for food, second-hand cars,
    clothing and footwear, eating and drinking out, and motor fuel rose in 2021 but mostly fell
    in 2020, resulting in the largest upward contributions to the change in the CPIH 12-month
    inflation rate between May and June 2021. The Consumer Prices Index (CPI) rose by 2.5
    per cent in the 12 months to June 2021, up from 2.1 per cent to May; on a monthly basis,
    CPI rose by 0.5 per cent in June 2021, compared with a rise of 0.1 per cent in June 2020.
•   June saw further strong growth in output across the UK private sector, according to the
    latest PMI data compiled by IHS Markit and CIPS. The overall expansion in activity was
    only slightly slower than the record posted in May and among the fastest since the series
    began in January 1998. Marked increases in output were seen across both the
    manufacturing and service sectors as the economy continued to reopen following the
    COVID-19 lockdown earlier in the year. Companies responded to rising workloads by
    taking on extra staff at an unprecedented rate at the end of the second quarter. Also hitting
    previously unsurpassed levels, however, were rates of inflation of input costs and output
    prices as supply-chain disruption fuelled price pressures. Figure 1 shows the headline
    seasonally adjusted IHS Markit / CIPS Flash UK Composite Output Index registered at
    61.7 in June, down slightly from May's record reading of 62.9 but still pointing to one of
    the strongest monthly improvements in business activity across the private sector since
    1998.

            Composite Output Index                                      Gross domestic product (GDP)
      "sa, >SO = growth since previous month                                                  % qr/qr

       90                                                                                        10
       80
       70                                                                                        5

       60
                                                                                                 0
       so
       40
                                                                                                 -5
       30
                                                    GDP             -    output
       20                                                                                        -10
       10
        0                                                                                        -15
            '07 '08 '09 '10 '11 '12 '13 '14 '15 '16 '17 '18 '19 '20 '21
       Sources: IHS Markit, CIPS, Office for National Statistics.

    Figure 1 IHS Markit / CIPS Flash UK Composite Output Index

                                                                                                        2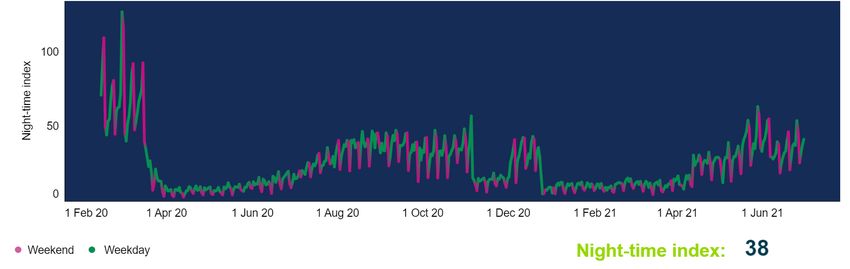
•   UK service providers reported another steep increase in business activity during June,
    with the speed of recovery only marginally slower than the peak seen in May. The rapid
    turnaround in business and consumer spending since the roll-back of pandemic
    restrictions led to the fastest rate of job creation for seven years. Survey respondents
    widely noted that capacity constraints and staff shortages had resulted in higher volumes
    of unfinished business. The latest rise in backlogs of work was the steepest since the
    survey began in July 1996. Imbalanced demand and supply also contributed to survey-
    record rates of input cost and prices charged inflation during June. Figure 2 shows that
    the headline seasonally adjusted IHS Markit/CIPS UK Services PMI Business Activity
    Index registered 62.4 in June, down slightly from 62.9 in May. This was the second-
    highest reading since October 2013 and above the earlier 'flash' figure of 61.7 in June.
    The index has posted above the 50.0 no-change value for four months in a row. Moreover,
    the average reading for the second quarter of 2021 (62.1) was the highest for any quarter
    in the past 24 years.

            Markit / CIPS UK Services PMI Business Activity Index
      sa, >SO = growth since previous month

       70
       60

       so
       40

       30

       20
       10 +--..---,----,----.-----r---r----.---.---..---,----,----.-----r-
          '08 '09 '10 '11 '12 '13 '14 '15 '16 '17 '18 '19 '20 '21

      Sources: IHS Markit, CIPS.

    Figure 2       IHS Markit/CIPS UK Services PMI

•   Figure 3 shows Manufacturing remained in a strong growth phase in June, with rates of
    expansion in output, new orders and employment among the best seen during the near
    30-year survey history. Industry was still beset by supply-chain and distribution difficulties,
    however, leading to longer vendor lead times and disruption to production schedules. The
    seasonally adjusted IHS Markit/CIPS Purchasing Managers’ Index (PMI) dipped slightly
    to 63.9 in June, down from May's record high of 65.6. The PMI has signalled an
    improvement for 13 successive months. Manufacturing production increased at marked
    rates across the consumer, intermediate and investment goods industries during June.
    Growth was supported by strong intakes of new business, which rose at a rate close to
    May's record high. Improved demand was linked to the ongoing easing of COVID-19
    restrictions, re-opening of the economy from lockdown and improving global market
    conditions. New export orders increased again, reflecting inflows of new work from
    mainland Europe, the US and Asia.

                                                                                                 3
IHS Markit / CIPS UK Manufacturing PMI
         sa, >SO= improvement since previous month

          70
          65
          60
          55
          50
          45
          40
          35

          30 - - - ~ - - - - - - - - - - - - ~ - ~ - - - - - ~ - -
            '08 '09 '10 '11 '12 '13 '14 '15 '16 '17 '18 '19 '20 '21

         Sources: IHS Markit, CIPS.

       Figure 3            IHS Markit/CIPS UK Manufacturing PMI

          IHS Markit / CIPS UK Construction PMI Total Activity Index
         sa , >SO= growth since previous month

               '07         '09        '11        '13   '15   '17       '19   '21
         Sources: IHS Markit, CIPS.

       Figure 4            IHS Markit/CIPS UK Construction PMI

•   The recovery in UK construction output gained further momentum during June, according
    to the latest PMI data given in Figure 4. Overall construction activity expanded at the
    fastest pace since June 1997, supported by another sharp rise in new orders. Suppliers'
    delivery times lengthened to the greatest extent since the survey began just over 24 years
    ago, surpassing the previous record seen in April 2020. Severe shortages of construction
    products and materials resulted in a survey record rise in purchasing prices in June. At
    66.3 in June, up from 64.2 in May, the seasonally adjusted IHS Markit/CIPS UK
    Construction PMI Total Activity Index signalled the strongest rate of output growth for
    exactly 24 years. Sharp increases in business activity were seen across all three main
    areas of the construction sector monitored by the survey. Construction work in the house
    building sub-category (index at 68.2) increased at the fastest pace since November 2003.
    The second-best performing area was commercial work (66.9), with output rising at the
                                                                                            4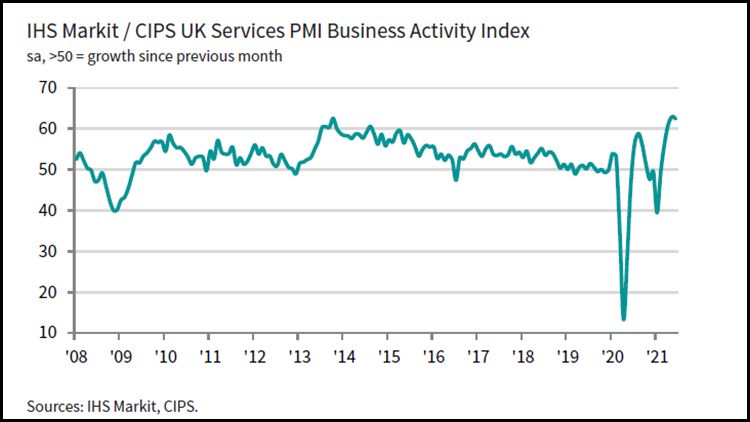
strongest rate since March 1998. Meanwhile, civil engineering activity rose sharply in June
    (60.7), but the speed of growth eased to a three-month low. Survey respondents widely
    commented on a rapid turnaround.
•   The government’s decision to extend pandemic business support measures - including
    the restrictions on issuance of winding up petitions and statutory demands - gives
    directors and business owners a further window to plan how they will move forward when
    the temporary measures end.
•   Over 159,000 businesses across the East of England have taken out loans worth over £7
    billion under the government’s two largest Covid-19 loan schemes. The Coronavirus
    Business Interruption Loan Scheme (CBILS) and the Bounce Back Loan Scheme (BBLS)
    provided financial support to businesses hit by the pandemic and closed in March. Over
    149,000 loans worth over £4.5bn were made under the BBLS in the region and more than
    10,400 loans worth over £2.5 billion under the CBILS. The loans in the East represent 10
    per cent of the national total, in line with the size of the region’s business numbers.
•   Business confidence in the East of England rose ten points during June to 36 per cent -
    the highest level recorded for over three years – and more firms are planning to recruit
    staff in the coming year, according to a Lloyds Bank Commercial Banking business
    barometer survey. Firms in the East saw confidence in their own prospects jump by 13
    points to 38 per cent. Their optimism on the overall economy also rose. Meanwhile, a net
    balance of 21 per cent of businesses in the region expect to boost staff levels over the
    next year, up six points on May. Overall, UK business confidence remained steady at 33
    per cent. However, nationally, the delay in easing restrictions may have knocked
    confidence in some areas, particularly amongst retailers and manufacturers.
•   Businesses in the East of England are facing mounting cost inflation and growing
    backlogs of work despite recruiting new staff at record levels, according to a key survey
    of purchasing managers. Meanwhile, a surge in new orders has made it difficult for some
    firms to complete new work and the backlog of outstanding business has risen for a fifth
    month running. The NatWest East of England PMI® survey showed that input price
    inflation touched a record high in June since the series began, driven by higher fuel,
    material, wage, PPE and transport costs. The rate of price increases charged by private
    firms in the region also hit a new record in June, as firms saw an increase in new orders
    for the fourth month running. Meanwhile the pace of staff recruitment rose for the fourth
    month running to a five-and-a-half-year high as both services firms and manufacturers
    firms reacted to greater client demand and shortages of workers. Although the business
    activity index dipped to 62 in June from 64 in May, the survey said growth in the region
    remained robust overall and was broadly in line with the UK average. Positive sentiment
    amongst firms on output in 12 month’s time moderated but remained above the long-run
    series average.
•   The New Anglia Growth Hub is continuing The Peer Networks Programme for SME
    leaders that want to grow and develop their organisation for a second year. It is offering

                                                                                             5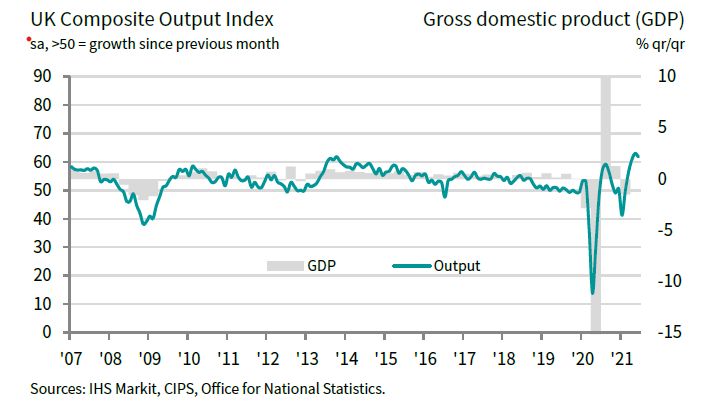
the programme to over 200 eligible businesses on a first come, first served basis between
    summer 2021 and spring 2022.
•   Anglian Water has launched a ‘plan for community recovery’ which focuses on health and
    wellbeing, supporting vulnerable customers, increasing social mobility and being an
    inclusive business. It follows a green recovery plan, published by the utility last autumn,
    which set out plans to accelerate £300 million of environmental investment by 2025 and
    which involved 520 schemes delivered in 2020/21. The company also plans to deliver £12
    million in partnership funding for flood prevention schemes across the region. The area
    covered by Anglian has the fastest-growing population in the UK and is also one of the
    driest regions in the country.

Local business
•   The plans to expand a city hotel could see a top celebrity chef opening his first restaurant
    in Norwich. A fresh bid to extend the Norwich Hotel in Thorpe Road has been lodged with
    the city council, after a previous application was rejected earlier this year. Part of the
    project will see a rooftop restaurant added to the site - which has been earmarked to
    become part of celebrity chef Marco Pierre White's portfolio. Mr White currently has 30
    restaurants across Britain under different guises, but should the plans ago ahead, this will
    be his first in Norwich.
•   The Guildhall, one of Norwich's most historic buildings will have new life breathed into it
    when its new tenants move in later this year. From this Autumn, the Grade I-listed building
    will be home to staff from the Norfolk and Norwich Festival – who will take over 85 per
    cent of the building.
•   New direct flights from Norwich Airport to Devon have launched, costing from around £200
    per person return. Regional airline Loganair has launched its new Monday, Wednesday,
    Friday and Sunday direct service between Norwich and Exeter. Loganair also restarted
    its flights from Norwich to Edinburgh up to four times per week. This service was cancelled
    due to coronavirus last year.
•   A buyer has been found for the former Debenhams store in Orford Place - a sign of good
    news for the high street. The six-storey building, Orford House, went up for sale or rent in
    March after online fashion retailer Boohoo bought the Debenhams brand but not the
    stores or staff. The building had gone under offer with "one buyer".
•   The owner of a new Norwich nightclub is hoping to ride the wave of a nightlife “boom”,
    with coronavirus restrictions set to lift on July 19. Can ‘N’ Cocktails has officially opened
    on Prince of Wales Road in the city centre, with hopes of offering a new place for
    partygoers to visit.
•   A restaurant for “Foodies” has officially opened on Magdalen Street in Norwich. It is owned
    by Demetris and George Mavroudis, who left their former business - which had been in
    their family since the 70s – in Great Yarmouth to open a completely new business in the

                                                                                               6
city. Foodies offers restaurant-quality street-food style cuisine, to take away or eat-in at
their newly refurbished site.
• Around 35 per cent of Norwich's office workers have returned to their desks in the city -
and the drop-off in footfall is still "decimating" businesses, owners have warned according
to data from Centre for Cities.
• Furniture chain IKEA has announced the closure date of its store in Norwich - which will
affect 39 workers. The store in the Sweet Briar Road industrial estate is to close on Friday,
July 16. The firm released a statement, saying: "Despite a number of actions taken over
the years to optimise the Norwich order and collection point, such as investment in store
layout and merchandising, unfortunately it has not been able to meet its sales and
profitability targets”.
Education
• Students from the University of East Anglia (UEA) have provided tutoring sessions to
pupils from across Norfolk during the COVID-19 pandemic. The sessions in maths,
English and science benefitted more than 300 pupils from nine secondary schools and
aimed to close the attainment gap between children from wealthier and less wealthy
backgrounds, which the pandemic has widened. Over 30 UEA students delivered more
than 1800 hours of tutoring between January and May 2021. Sessions were delivered
online to small groups of pupils in Years 8, 9 and 10. The scheme was delivered as part
of UEA’s Make It Count Outreach Programme.
• The UEA’s new undergraduate degree course, Broadcast and Multimedia Journalism BA,
has been awarded professional accreditation by the Broadcast Journalism Training
Council (BJTC), the industry training board. This prestigious accreditation recognises that
student journalists are taught to professional standards. It is backed by key industry
players, including the BBC, ITV, Channel Four, Channel Five, Reuters, the Press
Association, ITN, Sky News, Global, Bauer and the NUJ.
• Norwich University of the Arts has been rated second in the world for Design Education
Institution by the World Brand Design Society awards. The World Brand Design Society
is a professional community that benchmarks and awards creatives, businesses and
professionals in the corporate and consumer brand design industry. NUA is one of 10
universities around the world awarded for their high standard of design teaching.
7Claimant count unemployment
The trend in claimant count unemploymenti since 2015 is summarised in Figure 5 - in 2015
the rate in the Norwich City Council area was just below the national rate, by 2018 the gap
narrowed, and Norwich’s rate fell rapidly to below the national rate. In 2019 rates began to
rise across each of the reported areas. However, the 2020 impact of the Covid-19 pandemic
has been one of steep growth with the most significant increase between March and May.
Since then, the claimant count has remained relatively stable and the upward trend has
slowed somewhat, braced by the government’s furloughed worker schemes which finish this
Autumn. Figure 5 shows that the increase in unemployment has been strongest in the
Norwich city council area.
Figure 5 Claimant count unemployment 2017 to 2021
Table 1 Claimant count unemployment rate
June 2020 May 2021 June 2021 Monthly Annual
change change
Gt. Britain 2,528,255 6.2% 2,409,350 5.9% 2,274,130 5.6% - 0.3% - 0.6%
East of 204,015 5.4% 191,830 5.1% 178,745 4.7% - 0.4% - 0.7%
England
New
Anglia 49,550 5.1% 45,745 4.7% 42,615 4.4% - 0.3% - 0.7%
LEP
Norwich
City 6,115 6.4% 5,915 6.2% 5,590 5.9% - 0.3% - 0.5%
Councilii
Norwich 7,980 5.4% 7,600 5.2% 7,115 4.8% - 0.4% - 0.6%
urban area
8Table 1 shows that claimant count unemployment rates have fallen compared to the same
time last year, Over the month of June, rates also fell across each of the reported areas.
Unemployment levels are likely to have been tempered by the Government’s temporary
furlough job subsidy scheme and the downward trend may change when the schemes cease
in the Autumn.
Ward level claimant count unemployment
Table 2 Claimant count unemployment
June May June Monthly Annual
2020 2021 2021 change change
Bowthorpe 440 5.3% 460.0 5.6% 450 5.4% - 0.2% + 0.1%
Catton 575 8.1% 530.0 7.4% 485 6.8% - 0.6% - 1.3%
Grove
Crome 460 7.7% 465.0 7.8% 445 7.5% - 0.3% - 0.2%
Eaton 185 3.8% 150.0 3.0% 130 2.7% - 0.3% - 1.1%
Lakenham 445 7.9% 440.0 7.8% 415 7.4% - 0.4% - 0.5%
Mancroft 790 10.0% 755.0 9.6% 725 9.2% - 0.4% - 0.8%
Mile Cross 645 9.1% 670.0 9.4% 635 8.9% - 0.5% - 0.2%
Nelson 250 3.6% 215.0 3.1% 190 2.8% - 0.3% - 0.8%
Sewell 485 6.8% 450.0 6.3% 405 5.7% - 0.6% - 1.1%
Thorpe 640 7.0% 640.0 7.0% 615 6.7% - 0.3% - 0.3%
Hamlet
Town Close 390 5.1% 375.0 4.9% 355 4.7% - 0.2% - 0.4%
University 245 2.5% 235.0 2.4% 220 2.2% - 0.2% - 0.3%
Wensum 560 7.1% 530.0 6.7% 520 6.6% - 0.1% - 0.5%
Table 2 shows that during the month of June unemployment rates fell across each of the
Norwich wards. The biggest falls took place in Catton Grove and Sewell.
Over the year, rates dropped in every Norwich ward bar Bowthorpe ward which saw a
marginal increase. Rates in Eaton and Sewell wards fell most strongly.
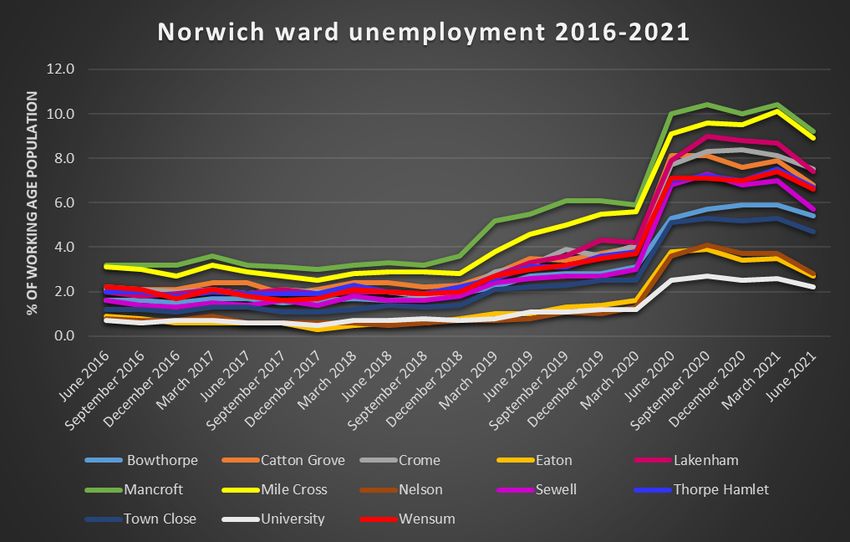
Figure 6 demonstrates the wide variation in ward JSA rates across the city council area. The
differential between the lowest (University) and the highest (Mancroft) rates currently stands
at 7.0 percentage points.
9Figure 6 Norwich wards claimant count unemployment 2016 to 2021
Claimant count unemployment: male/female
In the Norwich city council area, two in every five (39%) out-of-work claimants are women.
Over the month, female rates fell slightly across Norwich (4.6%), the LEP area (3.7%),
regionally (4.0%) and nationally (4.6%).
The male unemployment rate is somewhat higher in Norwich (at 7.1% of working age males)
than the rate nationally (6.7%), across the LEP area (6.1%) and regionally (5.1%). Over the
month, rates fell across each of the reported areas.
Norwich’s male unemployment rate has remained higher than rates in the LEP area and at
the regional and national levels since records began in 1992. Historically, it is likely that
Norwich’s relatively high levels of male unemployment can be attributed to the loss of
manufacturing jobs and the dominance of the service sector in Norwich.
10Housing benefit
Housing benefit is an income related benefit designed to help people on low incomes pay for
rented accommodation whether in, or out, of work.
Many housing benefit claimants are pensioners, people with disabilities, carers or people who
are in low waged work. It should be noted that resident earnings in Norwich are relatively low
and this is a contributory factor to the number of people claiming housing benefit.
Table 3 Norwich City Council housing benefitiii claimants
Number of claimants Monthly change
June 2020 15,999 + 969
July 2020 15,845 - 145
August 2020 15,761 - 84
September 2020 15,658 - 103
October 2020 15,655 -3
November 2020 15.634 - 21
December 2020 15,547 + 13
January 2021 15,476 - 71
February 2021 15,479 -3
March 2021 15,299 - 180
April 2021 15,207 - 92
May 2021 15,258 + 51
June 2021 15,205 - 53
Table 3 shows that the number of housing benefit claimants in the Norwich local authority
area dropped by 53 claims during June. Over the year, housing benefit claims in Norwich
have fallen by 4.9%. Comparable national data is not available because of a time lag in data
collection.
11Average house prices
Figure 7 HM Land Registry average house prices 2018- 2021
The House Price Index (HPI) produced by HM Land Registry is the most accurate and
independent house price index available for the UK.
According to HM Land Registry’s HPI (Crown copyright) over the year, average house prices
grew by 4.22% in Norwich; by 6.92% in the East of England and by 9.67% across England.
Figure 7 summarises average house price movements since May 2018.
During the month of May, average house prices fell by 1.34% in Norwich and by 1.01% in the
region; a small increase of 0.39% took place across England.
The average house price in Norwich currently stands at £211,337 against £310,200 for the
East of England and £271,434 for England.
12City centre vitality
Figure 8 Footfall visitors to Norwich city centre (Norwich BID)
Figure 8 summarises visitor numbers to Norwich city centre provided by Norwich Business
Improvement District (BID). The average number of city centre visitors per day was estimated to be
15,196 in June.
200
150 150
X X
(I) (I)
"C "C
_,; .s
100 100 "C
~
(I)
C:
(I)
> a.
0 (/)
50 50
0 0
Feb 20 1 Apr 20 1 Jun 20 1 Aug 20 1 Oct 20 1 Dec 20 1 Feb 21 1 Apr21 1 Jun 21
• Weekend • Weekday Overall 62 Spendindex: 97
Figure 9 Overall recovery and spend index (Centre for Cities)
The overall recovery index looks at everyone who was in the city centre at any time of the
day, compared to a pre-lockdown baseline of 100 - the index reading for Norwich at the end
of June was 62. The spend index looks at relevant offline sales made in the city centre at
any time of the day, compared to a pre-lockdown baseline of 100 - the index reading for
Norwich at the beginning of March was 97.
13100
X
.s"'
"C
~
i 50
0
1 Feb 20 1 Apr20 1 Jun 20 1 Aug 20 1 Oct20 1 Dec20 1 Feb21 1 Apr 21 1 Jun 21
Figure 10 Workers index – Norwich city centre (Centre for Cities)
The Centre for Cities Workers Index given in Figure 10 looks at city-centre workers in the
city centre in the daytime on weekdays, compared to a pre-lockdown baseline of 100. In
Norwich city centre the level of workers at the end of June stood at 26. The Index shows
that pre-lockdown, around 42% of city centre workers came from outside of the city,
compared to a current level of 31% of workers. An estimated 52% of city centre workers
came from the suburbs, before lockdown, currently the proportion is 62%. A further 6% of
city centre workers came from the city centre itself prior to lockdown and the current
proportion is the same.
150
X
_g: 100
.!:
~
"'
I 50
1 Feb 20 1 Apr20 1 Jun 20 1 Aug 20 1 Oct20 1 Dec 20 1 Feb 21 1 Apr2 1 1 Jun 21
Figure 11 Daytime weekend visitor index – Norwich city centre (Centre for Cities)
The weekend visitor index for Norwich city centre shows the level of visitors to the city centre in the
daytime compared to March’s pre-lockdown levels and the huge fall in visitors seen during the
lockdown and the increase in visitors since opening up. This index looks at people who were in the
city centre, in the daytime at weekends, compared to a pre-lockdown baseline of 100; at the end of
June the index for Norwich stood at 69.
100
~
"C
.s
"'E
iz 50
0
1 Feb 20 1 Apr20 1 Jun 20 1 Aug 20 1 Oct 20 1 Dec 20 1 Feb21 1 Apr21 1 Jun 21
• Weekend • Weekday Night-time index: 38
Figure 12 Night-time weekend visitor index – Norwich city centre (Centre for Cities)
14A similar pattern is repeated in Figure 12 which shows the level of night-time city centre visitors
compared to a pre-lockdown baseline of 100 (baseline only for Friday and Saturday evenings) and
the latest index reading of 38.
15Appendix
Contact details
Sharon Cousins-Clarke, Economic Development, Norwich City Council,
Email: SharonCousins-Clarke@norwich.gov.uk
Data Sources:
Figure 1: IHS Markit / CIPS Flash UK Composite Output Index
Figure 2: IHS Markit/CIPS UK Services PMI
Figure 3: IHS Markit/CIPS UK Manufacturing PMI
Figure 4: IHS Markit/CIPS UK Construction PMI
Figure 5: Claimant count – NOMIS, Crown copyright
Figure 6: Ward unemployment – NOMIS, Crown copyright
Figure 7: House Price Index - HM Land Registry, Crown copyright
Figure 8: Footfall visitors to Norwich city centre – Norwich Business Improvement District (BID)
Figure 9: Overall recovery and spend index - Centre for Cities
Figure 10: Workers index – Norwich city centre - Centre for Cities
Figure 11 Daytime weekend visitor index – Norwich city centre- Centre for Cities
Figure 12 Night-time weekend visitor index – Norwich city centre - Centre for Cities
Tables 1 and 2: Claimant count – NOMIS, Crown copyright
Table 3: Housing benefit claimants - Norwich City Council
News stories from a variety of sources including EDP/Evening News; Business in East Anglia; Office of National
Statistics; Reuters; BBC; Markit/CIPS PMI; Markit Monthly Economic Overview: University of East Anglia;
Norwich University of the Arts; City College Norwich.
i
The “claimant count” measure counts the number of people claiming Jobseeker's Allowance plus those who claim Universal Credit and
are required to seek work and be available for work. It replaces Jobseeker's Allowance claimants as the headline unemployment benefit
indicator.
ii The Norwich City council area comprises the following wards: Bowthorpe, Catton Grove, Crome, Eaton, Lakenham, Mancroft, Mile
Cross, Nelson, Sewell, Thorpe Hamlet, Town Close, University, Wensum
iii Housing benefit numbers include people who are claiming council tax benefit only
16IN E If you would like this information in another language
'\rTR AN or format such as large print, CD or Braille please visit
communica tion for all www.norwich.gov.uk/Intran or call 0344 980 3333.
COM12548 07/2021You can also read