Redwood Trust, Inc. Investor Presentation August 17, 2020 - August 2020
←
→
Page content transcription
If your browser does not render page correctly, please read the page content below

Redwood Trust, Inc.
Investor Presentation
August 17, 2020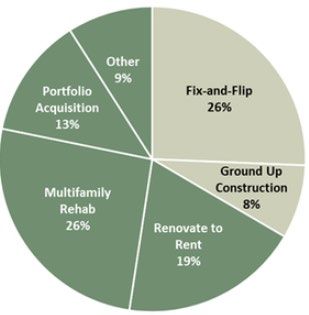
Forward-Looking Statements and Pro Forma Information
This presentation contains forward-looking statements, including statements regarding estimated increases in book value per
share during July 2020, estimated levered yields on our in-place investment portfolio, and expectations and timing for future
SFR and Sequoia securitizations. Forward-looking statements involve numerous risks and uncertainties. Our actual results
may differ from our beliefs, expectations, estimates, and projections and, consequently, you should not rely on these
forward-looking statements as predictions of future events. Forward-looking statements are not historical in nature and can
be identified by words such as “anticipate,” “estimate,” “will,” “should,” “expect,” “believe,” “intend,” “seek,” “plan” and
similar expressions or their negative forms, or by references to strategy, plans, or intentions. These forward-looking
statements are subject to risks and uncertainties, including, among other things, those described in the Company’s Annual
Report on Form 10-K for the year ended December 31, 2019, the Quarterly Report on Form 10-Q for the quarter ended
March 31, 2020, and any subsequent Quarterly Reports on Form 10-Q under the caption “Risk Factors.” Many of these risks
and uncertainties are, and will be, exacerbated by the COVID-19 pandemic and any worsening of the global business and
economic environment as a result. Other risks, uncertainties, and factors that could cause actual results to differ materially
from those projected may be described from time to time in reports the Company files with the Securities and Exchange
Commission, including reports on Form 8-K.
These materials also contain pro forma financial information, giving effect to new financing transactions entered into during
July and August 2020, as if the transactions had occurred on June 30, 2020. The pro forma financial data as of June 30, 2020
reflect our estimates with respect to such information, based on information currently available to management and a
number of assumptions, and may vary from our actual results. The pro forma financial information is not necessarily
indicative of the expected financial position or results of Redwood’s operations for the second quarter of 2020, the third
quarter of 2020, or any future period. Differences could result from numerous factors, including exposure to new or increased
risks as a result of the impact of the COVID-19 pandemic, changes in market conditions or benchmark interest rates, changes
in Redwood’s capital structure, changes in Redwood’s portfolio of investments, changes in Redwood’s operating expenses,
and for other reasons, including those discussed in our Annual Report on Form 10-K for the year ended December 31, 2019,
the Quarterly Report on Form 10-Q for the quarter ended March 31, 2020, and any subsequent Quarterly Reports on Form
10-Q under the caption “Risk Factors.”

                                                                                                                                 1
A Leading Innovator in Housing Credit Investing
We are a specialty finance company with a durable track record of providing financing solutions
to the U.S. residential housing market
25+ year History Managing Unique Operating Platforms Core Business Strategies Covering
Through Cycles Market-leading brands in both residential Full Housing Finance Market
Second longest tenured mREIT and business purpose lending (BPL) Residential Lending – deep network of
Organic asset creation for both RWT sellers and broad distribution capabilities
Strong culture of risk management
portfolios and third-party investors
Internally managed, incentives aligned Business Purpose Lending – market leader
through sales and partnerships
with shareholder returns in a growing and underserved area of
Fee generation from mortgage banking housing finance
activities
Third Party Investments – reperforming
Two best-in-class securitization issuance loans, agency credit-risk transfers,
platforms multifamily and other housing credit
investments
$8.15 Book Value per Share(1) 1.6x Recourse Leverage(3)
estimated 3-5% higher at July 31, 2020 (2) 90% non-marginable(4)
Redwood is well positioned to capitalize on strong housing fundamentals and mortgage demand
through its market-leading operating platforms and current investment capacity
2
Detailed Endnotes are included at the end of this presentationBusiness Update – Second Quarter Recap
We repositioned and strengthened our balance sheet – by materially reducing leverage and
marginable debt and generating significant liquidity – and reset our operating platforms
De-levered through asset sales and reduction of overall debt
Enhanced Funding Completed two new non-marginable facilities and one non-recourse financing
Structure facility for residential and business purpose loans
Repurchased $125 million of convertible debt at a $25 million discount
Completed the sale of our residential jumbo loans previously held for investment
Executed strategic sales of certain securities in anticipation of prolonged market
disruption
Repositioned
Retained securities with highest yield potential, including those backed by more
Investment Portfolio seasoned loans; recovered nearly 30% of first quarter unrealized losses(1)
In aggregate, we estimate our in-place investment portfolio can generate yields in
the low to mid-teens to our current basis(2)
Majority of capital raised by selling portfolio of prime jumbo loans on favorable
Generated Capital relative terms
Internally Executed our liquidity strategy without raising dilutive outside capital
Completed sales of pre-COVID residential loan inventory and resumed locking
Reset Operating residential loans
Platforms Securitized significant portion of our pre-COVID SFR loans, enhanced lending terms
and structures for BPL products
3
Detailed Endnotes are included at the end of this presentationBusiness Update – Third Quarter Activity
Volume growth at our mortgage banking businesses continues to accelerate and we have
completed further enhancements to our funding structure
Accelerating Growth Pipeline activity is robust and building at both businesses – BPL loan originations
on-pace to approach pre-COVID levels
at Operating
With increasing volumes, we are on pace to issue SFR and Sequoia securitizations in
Platforms the fall
Completed second non-recourse financing facility for business purpose bridge
loans, essentially providing match-funding for most of our in-place portfolio
Further Enhanced Completed new non-recourse resecuritization financing for majority of our re-
performing loan securities, refinancing over $200 million of short-term marginable
Funding Structure securities repo debt
Pro forma for these new financings, at June 30, our marginable debt was
approximately $135 million and our cash to marginable debt ratio was 3.7x(1)
New non-recourse and non-marginable facilities have allowed us to reduce our risk
Increased Liquidity capital reserves, increasing capital available for investment
We estimate book value increased 3-5% during July(2), as spreads continued to
Increased Book Value tighten, particularly in assets such as reperforming loan securities that experienced
slower price recoveries in the second quarter
4
Detailed Endnotes are included at the end of this presentationEnhanced Funding Structure
Our strategic initiative of recasting our debt is nearly complete as we have predominantly
shifted to a mix of non-marginable secured and corporate unsecured borrowings
Since the onset of the pandemic, we have significantly reduced our overall recourse debt and shifted our recourse
funding structure almost entirely to non-marginable debt, minimizing our associated contingent liquidity risk
We established several new non-marginable facilities and expect to finance the bulk of our mortgage banking operations
with non-marginable facilities going forward
We refinanced short-term, marginable borrowings for the majority of our BPL bridge loans and reperforming loan
securities with long-term, non-recourse debt
We repurchased $125 million of convertible debt below face value, reducing debt service costs and further reducing total
leverage
5
Detailed Endnotes are included at the end of this presentationOpportunities Going Forward
Our mortgage banking businesses are poised for significant growth and our investment
portfolios are carried at a very attractive basis
Sizable opportunity as an established leader in an underserved market,
including in cross-collateralized SFR loans and strategic bridge lending
products for top-quality sponsors
Business Purpose Mortgage Origination pipeline building to pre-COVID levels; strong margins benefitting
Banking from enhancements to already strong loan structures
Best-in-class SFR securitization platform – increasing demand from
institutional investors looking for exposure to the asset class; expect to
remain a consistent issuer in the market
Jumbo lock volumes accelerating as liquidity returns to the market
Substantial opportunities in an expected refinance wave as originators refocus
Residential Mortgage on the jumbo market
Banking Market-leading Sequoia securitization platform a competitive advantage as
markets normalize and demand increases for quality housing credit with
strong underwriting
Investment portfolios still have significant embedded discount from unrealized
losses recorded in the first quarter with potential for further meaningful
Investment Portfolios recovery
Deploying capital into third-party investments where we find assets at
attractive prices
6
Detailed Endnotes are included at the end of this presentationBusiness Purpose Mortgage Banking
Volumes and margins remain strong as the single-family rental market is growing with
increased demand for quality homes in attractive geographies
Market-leading brand for business purpose loan origination; generates fee income and creates durable
long-term portfolio investments organically
Embedded intrinsic value in platform; our underlying housing thesis is strengthening as lending
standards are tightening for prospective owner occupants and emerging consumer preference for
detached single-family homes
Strategic advantage as established market leader in business purpose lending (only lender with
significant track record in multi-borrower single-family rental)
Only mortgage REIT with best-in-class SFR securitization platform; attractive risk-adjusted returns have
kept BPL assets in strong demand
Target Market Products Procurement(2)
Sophisticated small and mid-sized Multi-product strategy across Highly scalable infrastructure with
real estate investors bridge and term loans creates proprietary processes and
long-term borrower relationships technology
Highly fragmented lending
environment Term loans for stabilized portfolio Unique approach to client
investors acquisition that results in better
30.1M unit addressable market
client selection and outcomes
(16.1M are single-family rentals Bridge loans for acquisitions,
(SFRs)(1) renovations and portfolio Over 3,000 borrowers
aggregation Over 50,000 properties financed
across 47 states and D.C.
7
Detailed Endnotes are included at the end of this presentationResidential Mortgage Banking
Loan lock volumes are increasing, spurred by low rates for homeowners and originators
refocusing on the jumbo market
Have begun to see a pickup in lock activity and expect this to grow meaningfully as we head into the fall; deep
network of sellers (banks and independent mortgage companies) increasing capacity to refocus on jumbo market
as jumbo rates converge back near conforming rates
Increased demand in the whole loan and securitization markets for high quality residential housing credit sourced
from a reputable aggregator with strong underwriting
Market-leading brand for jumbo residential loan aggregation; generates fee income and creates durable long-term
portfolio investments organically
Best-in-class securitization platform for jumbo residential; opportunity for increased investment income generated
from Sequoia securitizations as volumes increase
Key Strategic Priorities
Continue investment in technology to improve efficiencies and operations
Refine how and how quickly we can purchase loans in a safe and sound manner
Broaden our loan distribution methods to compliment traditional whole-loan sales
and securitizations
8
Detailed Endnotes are included at the end of this presentationInvestment Portfolio Overview
We are taking a measured approach to deploying capital in order to remain agile and respond
appropriately as market conditions evolve
Combined Investment Portfolio at June 30, 2020 Pro Forma (1)
($ in millions)
Non Net
Fair Value Recourse Recourse Capital
(2)
of Assets Debt Debt (1) Invested
Sequoia Securities $ 345 $ (226) $ 0 $ 119
SFR securities 203 (103) 0 100
Third-party Securities 532 (28) (210) 294
Total Securities 1,081 (358) (210) 513
Business Purpose Bridge Loans 814 (67) (545) 202
Other Investments 172 (20) 0 152
Total Investment Portfolio $ 2,066 $ (445) $ (755) $ 867
At June 30, 2020 had $529 million of unrestricted cash. New non-recourse and non-marginable facilities have allowed us
to reduce our risk capital reserves, making a substantial majority of our cash available for investment
We expect to focus our capital deployment in the near-term around our operating businesses, which will include
increased operating capital to support growing volumes, and organically generated long-term investments for our
portfolios that currently offer the most attractive risk-adjusted returns available to us
We will continue to monitor markets for opportunistic third-party investments
In aggregate, we estimate our in-place investment portfolio can generate yields in the low to mid-teens, to our current
basis(3)
9
Detailed Endnotes are included at the end of this presentationInvestment Portfolio – Securities
Current embedded discount provides opportunity for attractive go-forward returns
We estimate that as of June 30, 2020, approximately $3.00 per share of the unrealized losses we recorded in the first
quarter, remained outstanding
As markets recovered throughout the second quarter, our most liquid assets were the quickest to rebound, with spreads
tightening substantially in several areas of the portfolio
In July, we saw a continuation of the trend, with certain areas of the portfolio, such as reperforming loan securities,
beginning to see increased liquidity
The weighted average carrying price of our subordinate securities at June 30, 2020 was approximately 60% of face value,
compared to 50% at March 31, 2020
10
Detailed Endnotes are included at the end of this presentationInvestment Portfolio – BPL Bridge Loans
Bridge lending is a key strategic focus that drives long-term value for our BPL segment, including through
attractive risk-adjusted returns for our portfolio and sponsor conversion rates into adjacent products
(1)
Nearly 70% of our current bridge loan investments are comprised of strategic products tailored toward experienced
sponsors with a longer-term approach to real-estate investing (i.e. stabilization versus immediate sale)
Our multi-product approach facilitates high levels of repeat business with our top customers; since platform inception in
2014, ~30% of SFR origination volume has been generated by refinancing a CoreVest bridge loan and over 70% of total
funded dollar volume overall is from repeat sponsors
Focusing on experienced sponsors and strategic products has resulted in strong bridge loan performance; as of June 30,
2020, 90+ days delinquencies (including REO) in the bridge book totaled 4.6% across all strategies
11
Detailed Endnotes are included at the end of this presentationInvestment Portfolio – Credit Characteristics
(1) Sequoia securities have strong underlying
Residential Investments Credit Characteristics
June 30, 2020 homeowner credit profiles, significant estimated
($ in millions, except where noted) underlying equity in homes, and excellent historical
Sequoia Select Sequoia Choice Re-Performing performance
Securities Securities Loan Securities
Market value $ 121 $ 196 $ 394
Reperforming loan securities (mostly from Freddie
Average FICO (at origination) 770 743 609 Mac-issued securitizations) are primarily backed by
HPI updated LTV (2) 43% 66% 68% seasoned re-performing residential mortgage loans
Average loan size (in thousands) $ 660 $ 711 $ 178 (RPLs)
Gross weighted average coupon 4.0% 4.9% 4.5% Performance in the underlying portfolios has
Current 3-month prepayment rate 36% 34% 5% been stable relative to current market
90+ days delinquency (as a % of UPB) 0.3% 0.8% 9.9% conditions, with overall delinquencies about
Investment thickness (3) 4% 12% 23%
4% higher than earlier in the year and overall
cash-flow velocity reflecting strong borrower
engagement
SFR securities are backed by loans that benefit from
strong debt service coverage, low loan-to-value
ratios, and multi-property cross-collateralization
Bridge loans are backed by one or more underlying
properties, including cross-collateralized lines of
credit. Initial terms typically range between 12-18
months. Bridge loan 90+ days delinquency
presented in the table include REO assets.
12
Detailed Endnotes are included at the end of this presentationAppendix
2020 Second Quarter Financial Recap
Q2 2020 Overview:
Results benefited from a rebound in asset prices, as the COVID-19 induced spread widening
experienced in the first quarter partially reversed, benefiting our investment portfolio
Repositioned our secured debt structure; significantly reducing total recourse debt from $4.6 billion
at March 31, 2020 to $1.8 billion at June 30, 2020 and marginable debt from $3.5 billion at March
31, 2020 to $375 million at June 30, 2020
Book value recovered nearly one-third of unrealized losses recorded in the first quarter
Repurchased $125 million of convertible debt below carrying value, resulting in realized gains of $25
million
Paid second quarter dividend of $0.125 per share
14
Detailed Endnotes are included at the end of this presentationCapital Allocation
Pro Forma Capital Allocation (1)(5)
($ in millions)
15
Detailed Endnotes are included at the end of this presentationForbearance and Mortgage Servicing Advance
Obligations(1)
As of June 30, 2020 we had received approximately 96% of payments due in June for loans
underlying our Sequoia securitizations
Late in the second quarter we observed a substantial decrease in inquiries about, and requests for,
forbearance from borrowers underlying our Sequoia securitizations; forbearance rates for our Sequoia
portfolio had stabilized in the 6.5% - 7.0% range of outstanding balances as of July 24, 2020
At June 30, 2020, mortgage loans in a delinquent status (whether or not subject to forbearance)
accounted for approximately 4.0% of the aggregate principal (or notional) balance of Sequoia securitized
loans for which we had servicing advance funding obligations
As of June 30, 2020, we had no servicing advances outstanding related to principal and interest on
Sequoia securitized loans for which we had servicing advance funding obligations
Servicing advances are recoverable senior in securitization waterfall and are generally readily financeable
Principal and interest (P&I) servicing advance obligations equate to approximately $3 million per month
for each additional 5% of delinquencies in underlying portfolios (e.g. 2% to 7%)
16
Detailed Endnotes are included at the end of this presentationCorporate Responsibility
Redwood is committed to best-in-class corporate governance. In our 25+ year operating
history, we have built a reputation for the highest standards of integrity and responsibility
Business Sustainability Through
Corporate Governance
Human Capital
Director Independence and Board Leadership Culture and values aligned to corporate strategy
Majority of directors are independent Diversity and inclusion programs designed to foster
success
Separation of Chair and CEO
Data driven programs designed to enhance
Declassified Board
employee competency and engagement
Internally managed; incentives aligned to
Infrastructure and protocols in place to support
shareholder returns
business continuity through the pandemic
17Endnotes
Pro Forma Note 3. Represents recourse leverage ratio at June 30, 2020 on a pro forma
This investor deck contains selected pro forma financial information, basis (see Pro Forma Note above). Recourse leverage ratio is defined
giving effect to two new financing agreements entered into during July as recourse debt (see Recourse Debt Note above) at Redwood
and August 2020, as if the transactions had occurred on June 30, 2020. divided by tangible stockholders' equity. Tangible stockholders'
The first financing arrangement is a non-recourse, non-marginable equity excludes $65 million of intangible assets at June 30, 2020 (see
facility to finance business purpose bridge loans with a two-year term. Endnotes to Q2 2020 Redwood Review for additional information on
The second financing arrangement is a non-recourse resecuritization this non-GAAP measure).
transaction that refinanced the majority of our reperforming loan 4. Represents non-marginable debt (debt that is not subject to market-
securities that were previously financed with short-term securities repo value based margin calls) as of June 30, 2020 on a pro forma basis
borrowings. (see Pro Forma Note above).
Recourse Debt Note Slide 3 (Business Update – Second Quarter Recap)
Redwood's recourse debt at June 30, 2020 and June 30, 2020 pro forma, 1. During the second quarter of 2020, we recovered nearly one-third of
excludes $7.5 billion and $7.9 billion, respectively, of consolidated the unrealized losses of $(5.36) per share recorded in the first
securitization debt (ABS issued and servicer advance financing) and quarter of 2020.
other debt that is non-recourse to Redwood at June 30, 2020. 2. We estimate that our investments held at June 30, 2020 can
Slide 2 (A Leading Innovator in Housing Credit Investing) generate economic returns (using effective yields based on the
carrying value (generally market value) of our investments at June
1. Represents GAAP book value per share as of June 30, 2020.
30, 2020 and estimated future cash flows) on a levered basis (using
2. We estimate that GAAP book value per share at July 31, 2020 had our financing currently in-place at June 30, 2020) in the low- to mid-
increased in the range of 3-5% from June 30, 2020. Our estimated range teens. Our estimated range of returns reflects management’s
of GAAP book value per share as of July 31, 2020 reflects management’s estimate with respect to such information, based on our market
preliminary estimate with respect to such information, based on observations, estimates, and assumptions, including our assumptions
information currently available to management, and may vary from the regarding the use of leverage, credit losses, prepayment speeds, and
Company’s actual GAAP book value per common share as of such date. market interest rates. Actual returns may differ based on these or
Further, this preliminary estimate is not a comprehensive statement or other factors.
estimate of Redwood’s financial results or financial condition as of July
Slide 4 (Business Update – Third Quarter Activity )
31, 2020. This preliminary estimate should not be viewed as a substitute
for full interim financial statements prepared in accordance with GAAP 1. Cash to marginable debt ratio represents our ratio of unrestricted
and is not necessarily indicative of the results to be achieved in any cash at June 30, 2020 on a pro forma basis (see Pro Forma Note
future period. Accordingly, you should not place undue reliance on this above), to marginable debt as of June 30, 2020 on a pro forma basis
preliminary estimate. (see Pro Forma Note above).
18Endnotes (continued)
2. We estimate that GAAP book value per share at July 31, 2020 had 3. We estimate that our investments held at June 30, 2020 can
increased in the range of 3-5% from June 30, 2020. Our estimated range generate economic returns (using effective yields based on the
of GAAP book value per share as of July 31, 2020 reflects management’s carrying value (generally market value) of our investments at June
preliminary estimate with respect to such information, based on 30, 2020 and estimated future cash flows) on a levered basis (using
information currently available to management, and may vary from the our financing currently in-place at June 30, 2020) in the low- to mid-
Company’s actual GAAP book value per common share as of such date. teens. Our estimated range of returns reflects management’s
Further, this preliminary estimate is not a comprehensive statement or estimate with respect to such information, based on our market
estimate of Redwood’s financial results or financial condition as of July observations, estimates, and assumptions, including our assumptions
31, 2020. This preliminary estimate should not be viewed as a substitute regarding the use of leverage, credit losses, prepayment speeds, and
for full interim financial statements prepared in accordance with GAAP market interest rates. Actual returns may differ based on these or
and is not necessarily indicative of the results to be achieved in any other factors.
future period. Accordingly, you should not place undue reliance on this
preliminary estimate. Slide 11 (Investment Portfolio – BPL Bridge Loans)
1. See slide 21 that follows for a description of our different bridge
Slide 5 (Enhanced Funding Structure) portfolio borrower strategies.
1. Debt balances presented in the table and chart on this slide are as of
June 30, 2020 on a pro forma basis (see Pro Forma Note above). Slide 12 (Investment Portfolio – Credit Characteristics)
1. Performance information provided in this table for the loans
Slide 7 (Business Purpose Lending) underlying the securities we own, is generally reported on a one-
1. John Burns Real Estate Consulting estimates using 2010 Census and month lag. As such, the data reported in this table is from June
trending data from ACS / HVS (Data: 2Q19, Pub: Dec 2019). reports, which reflect a loan performance date of May 31.
2. Information as of June 30, 2020 since inception in 2014. 2. HPI updated LTV is calculated based on the current loan balance and
an updated property value amount that is formulaically adjusted
Slide 9 (Investment Portfolio Overview) from value at origination, based on the FHFA home price index (HPI).
1. Debt balances presented in table are presented on a pro forma basis 3. Investment thickness represents the size of a subordinate security
(see Pro Forma Note above). (on a percentage basis) relative to the total unpaid principal balance
2. Non-recourse debt presented in this table excludes consolidated of its respective securitization. Amounts in table are presented on a
securitization debt (ABS issued and servicer advance financing). weighted average basis by investment type.
4. Average current debt service coverage ratio (or DSCR) is the ratio by
which net operating income of a property exceeds its fixed debt
costs.
19Endnotes (continued)
5. Average loan to value (or LTV) (at origination) is calculated based on the
original loan amount and the property value at the time the loan was
originated. Amounts in table represent weighted averages by investment
type.
Slide 15 (Capital Allocation)
1. June 30, 2020 pro forma column in table includes recourse debt
amounts that have been adjusted on a pro forma basis (see Pro Forma
Note above). Values presented in Pro Forma Capital Allocation chart
represent our net capital (Fair value of assets, less associated recourse
debt) for each investment type, with recourse debt balances adjusted on
a pro forma basis (see Pro Forma Note above).
2. Other assets and liabilities are presented on a net basis within this
column.
3. Net investment in bridge loans represents our effective economic
investment in bridge loans financed with non-recourse debt.
4. Cash and cash equivalents for the June 30, 2020 pro forma column
within this table has been adjusted for the net impact from changes in
non-recourse debt balances.
5. Pie chart presents the allocation of our corporate capital (which includes
$937 million of equity and $661 million of long-term, unsecured
corporate debt) at June 30, 2020 Pro Forma.
Slide 16 (Mortgage Servicing Advance Obligations)
1. See our Q1 2020 Redwood Review for additional information about our
mortgage servicing obligations.
20Bridge Loan Borrower Strategies
Renovate to Rent – Sponsor acquires, renovates and rents out a portfolio of properties. Underlying homes generally require lighter
levels of rehabilitation than typical fix-and-flip. As assets stabilize over time, cash-flow coverage builds during the hold period. Exit
can be either traditional CoreVest SFR loan or portfolio sale to third-party investor.
Portfolio Acquisition – Sponsor pursuing primary strategies of (i) purchase of underperforming rental portfolio to upgrade homes and
drive higher rents, and (ii) refinance of upgraded assets onto line-of-credit for ultimate refinance or sale. Projects typically entail
lighter renovation with more experienced, vertically-integrated sponsors.
Build to Rent – Sponsor acquires and develops greenfield lots in a rental and/or for-sale neighborhood. New-build assets tend to be
highest-quality for SFR programs. Financing typically occurs in phases to ensure proof of concept from construction through
stabilization. Most projects provide tenants with additional indoor and private outdoor space, in keeping with increased demand
leading up to and through COVID-19. Sponsor has ability to shift to for-sale product to be responsive to market demand.
Multifamily Light Lift – Sponsor purchases underperforming multifamily property with strategy to upgrade units, and sell or refinance.
Project is pre-underwritten for GSE or CoreVest term loan refinance upon completion and stabilization, and typically has some in-
place cash-flow during term of the bridge loan. Projects tend to carry reduced renovation risk. Borrowers are typically experienced,
vertically-integrated sponsors.
Multifamily Heavy Lift – Sponsor purchases underperforming asset with strategy to meaningfully upgrade units and common areas.
Project is usually pre-underwritten for GSE refinance upon completion and stabilization with phased construction for projects with
extensive rehab requirements. Property cash-flow typically limited during initial phases of the project. Sponsors typically
experienced and vertically integrated.
Model Home Lease – Lender purchases from and leases back model homes to experienced national and regional homebuilders on a
triple net basis. Attractive cost basis for lender with reliable exit strategy over several years.
Fix-and-Flip – Typically single-family home purchase with light to medium rehab and exit strategy of sale to end user. Generally quick
asset turns with properties located in an existing neighborhood with comparable sales. Standard rehabilitations limit change orders
and budget variances, with property management and project completion generally straightforward in the event of default.
Ground-up Construction – Typically involves sponsor building condominium or multifamily projects for ultimate sale, with potential in
certain cases to refinance into CoreVest SFR loan or GSE take-out. Program limited to high quality sponsors in high demand markets.
21You can also read