Stress test for success - How to Build a Corporate Immune System in Response to COVID-19 - The Microfinance Centre
←
→
Page content transcription
If your browser does not render page correctly, please read the page content below
How to Build a Corporate Immune
 System in Response to COVID-19

               Stress test for
               success

                           15/04/ 2020
Webinar house keeping rules

         •Please switch off your
         webcam
                                           Capacity
                                           Building

                   •Please swith off your microphone
                                          European

                   during the presentation Code of
                                            Good
                                          Conduct

          •Please write your questions in
          the chatbox

                                            The webinar is recorded
                             It will be available at mfc.org.pl
EaSI Technical Assistance to the European Microcredit Sector      2
EaSI Technical Assistance to the
                                            European Microcredit Sector

                                          European Commission
                                 DG Employment, Social Affairs and Inclusion

        Programme
     Snapshot 2019

   EaSI Technical Assistance to the European Microcredit Sector
This project has received financial support from the European Union Programme for Employment and Social Innovation "EaSI" (2014-2020).   3
EaSI Technical Assistance within the EU Programme
 for Employment and Social Innovation (EaSI)

    Funded and managed
                                                                      EaSI Funding Programme
    by the European
                                                               Microfinance and Social Entrepreneurship axis
    Commission

                                          EaSI Technical                         EaSI Financial
                                                                                                      EaSI Grants
                                            Assistance                            Instruments

                                                                                                     EaSI Transaction
                                                                                       EaSI
                                                                                                       Cost Support
                                                                                     Guarantee            Grants
    Implemented               FS/MFC/EMN                       MFR                     EaSI            EaSI BDS
    by                                                                               Capacity           grants
                                                                                     Building

    To improve the          MCP          MCP           MCP           MC2
    operations of

                                                                                           EaSI
                                                                                          Funded
    For the benefit        Micro-        Micro-        Micro-        Micro-             Instrument
    of                   enterprises   enterprises   enterprises   enterprises

EaSI Technical Assistance to the European Microcredit Sector                                                            4
The EaSI Technical Assistance Service Providers

                                     Service Providers
                                     Technical Assistance:
                                     » Frankfurt School of Finance and Management gGmbH (FS)
                                       – Consortium Leader for the Technical Assistance Services
                                     » Microfinance Centre (MFC) – Consortium Partner
                                     » European Microfinance Network (EMN) – Consortium
                                       Partner
                                     Assessment, Evaluation and Ratings:
                                     » MF Rating – Provider of Institutional Assessments, Rating
                                       and Evaluations

   Project Beneficiaries and Geographic Coverage

   » Public and private financial intermediaries (greenfield microfinance institutions, non-bank
     microcredit providers, fintechs, licensed banks and guarantee granting entities) in all
     Member States of the European Union, as well as providers from Albania, North
     Macedonia, Iceland, Montenegro, Norway, Serbia and Turkey may respond to dedicated
     Calls for Expression of interest to request EaSI Technical Assistance.

   How to Apply for Technical Assistance?

   » Before applying eligible microcredit providers must first sign-up to or endorse the European
     Code of Good Conduct for microcredit provision.
   » To apply respond to open Calls for Expression of Interest published on the
     ec.europa.eu/social/easi webpage.

EaSI Technical Assistance to the European Microcredit Sector                                        5
EaSI Technical Assistance Overview

                                What is offered to whom?

                                                           »   Tailored trainings
                                                           »   Investment-readiness trainings
                            Selected                       »   Institutional Assessment
                          Beneficiaries       Capacity     »   Optional Financial or Social Rating
                                              Building

                      Microcredit                                 » Trainings on the implementation of the Code
                                             European             » Post-evaluation trainings
                   providers signed-          Code of             » Evaluations of the Code compliance
                    up to the Code             Good
                                             Conduct

                                                                          »   Microfinance Workshops and Webinars
                    Wider
                                                                          »   Peer-to-peer trainings
                  European                 Dissemination of               »   Study Visits
                  microcredit             Best Practices and              »   Heldesk
                    sector                     Heldesk

            July 2018                                                                          July 2022

                                       Project Duration – 4 years

EaSI Technical Assistance to the European Microcredit Sector                                                      6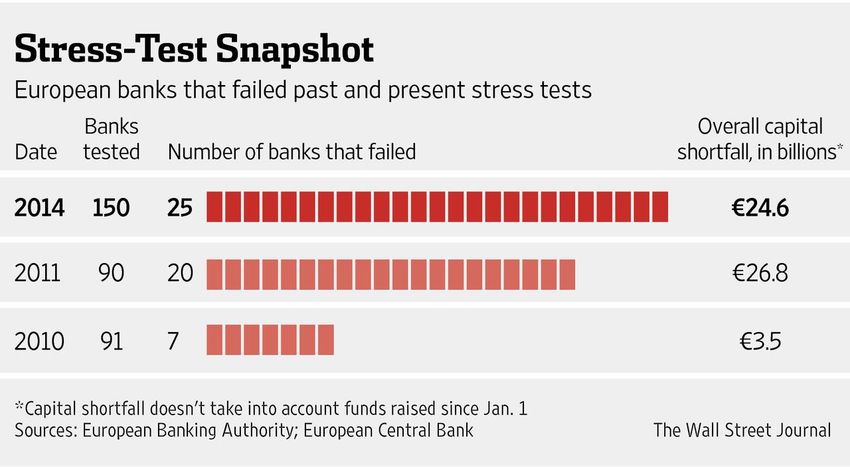
EaSI Technical
Assistance
For more information, about:

Technical Assistance, contact:
easi.ta@fs.de

Ratings and Evaluations, contact:
easi.ta@mf-rating.com

The EaSI Programme, visit:
ec.europa.eu/social/microfinance

This project has received financial support from the European
Union Programme for Employment and Social Innovation
"EaSI" (2014-2020).

The author of this presentation takes full responsibility for its
contents. The opinions expressed do not necessarily reflect the
view of the European Commission.

How to Build a Corporate Immune System in Response to
                    COVID-19 – webinar series
   • 16.04, 9:30 – 11:00 CET - Loan restructuring
     and refinancing policies and agreements
   • 22.04, 13:00 – 14:30 CET - Amendments to
                                           Capacity

     lending policy for new products and online
                                           Building

     channels                             European
                                           Code of
                                            Good
                                          Conduct
   • 23.04, 11:00 – 12:30 CET - Risk management
     for beginners and back-up staff
   • 29.04, 11:00 – 12:00 CET - Financial planning
     and financial modelling
   Please check www.mfc.org.pl for the webinars
   recordings

EaSI Technical Assistance to the European Microcredit Sector   8
Artur Munteanu                                      Kinga Dąbrowska,
   Entrepreneur, Finance Executive and                 Programs Manager, MFC
        Enterprise Development Expert

EaSI Technical Assistance to the European Microcredit Sector                   9
EaSI Technical
Assistance
Stress test for
success
Webinar 2

Artur Munteanu, MBA
arturmunteanu@yahoo.com

                          15/04/2020,
                          online Zoom
Stress test for success Agenda
Key Multifactor stress test
drivers/causes/factors of
business success and Consolidating the results
failure
Team work
Understanding data In conclusion
availability
Terminology
Adjusting the financial
modelStress testing definition 1
In car, transportation, IT industries: Load
testing ensures that a given function, program,
system, equipment, machinery can simply handle
what it’s designed to handle, whereas stress testing
is about overloading things until they break, applying
unrealistic or unlikely load scenarios ( loadninja.com)
In manufacturing: stress test is
a test conducted on some
equipment to determine
- how much of a load the system
can handle
- before it breaks or reaches its
limit ( business dictionary.com)Stress testing definition 2
• In financial industry: Stress testing is a simulation
or analysis designed to find out
• how resilient a financial instrument, investment
portfolio, financial institution, or whole economy is
• at dealing with extreme situations and economic
crises.
• Stress testing may also refer to tests that measure
how well a company or industry might fare/cope
when exposed to certain stressors (factors).
• Stress testing is a computer simulation
technique used to test the resilience of institutions
and investment portfolios against possible future
financial situations. (Investopedia.com)Stress testing definition 3 – Banking
• A bank stress test is an analysis conducted
under hypothetical unfavorable economic
scenarios, such as a deep recession or financial
market crisis, designed
• to determine whether a bank has enough
capital
• to withstand the impact of adverse economic
developmentsStress testing definition 3 – Banking
• From previous crisis
•
• https://www.zerohedge.com/news/2014-10-26/ecb-announces-stress-test-results-
here-are-25-banks-failedStress testing definition 4
• In banking and non-banking financial
industry:
• How much of “a load” the bank or non bank
financial institution can handle before it
breaks?
• What is a “load” and what is “break”? Is it
loan restructuring amount and ratio as a
load,
• Is “break” default on liabilities? is it loosing
the license, is it bellow normative capital, is
the case when we loose all retained
earnings, we reach zero registered capital
(owners equity), or negative owners equity?
• How much money can we restructure from
the loan portfolio before we break?Stress testing definition 4
• Stress test is not only about risk and losses
but as well about opportunities
Risks: Opportunities:
Impact
Budgeted Profit before tax m Impact
for 2020 (in million X) Profit Curren Profit, Currenc
11.6 m X m X cy X mX y, m X
1. Disbursements drop from Increase disbursements
220 million to 127 million 5.5 -6.1 from 220 to 250 13.4 1.8
Other please list
• Example: CEC Bank Romania is offering
refinancing loans for doctors at a lower
interest rate in the pandemic crisisUnderstanding data from the
market (outdoor)
Factors/Drivers Affecting
Businesses and Key ActionsExternal group of factors
1. Demographi 2. Socio 3. Political and 4. Natural and 5. Technological
c and health Cultural Regulation Climate ICT
Natural
Human resources Traditions Production and
Parties, resources,
and its health Behaviour Processing
Government, Climate
Innovations
Legislation, conditions Green
Policies Policies, Pollution
et
6. Economic: 6.2. 6.3. Economic: 6.4 Economic: 6.5 Economic:
GDP Economic: Exchange rate Remittances State or
Interest rate Regional (EU)
GDP growth, GDP National Bank
National bank Countries economic
Structure policy
policy Amount programs:
Exchange Growth rates Subsidies
Export, Import Interest rates ratesEuro, USD; Free services,
Competitors Lira Other help
rates available!External factors and data
• Demographics and health data
• Number of infected people and growth rates
• Death ratio
• Distance to our business
(per segment: in the region, in the country, in the company in the portfolio
etc)
• Economic
• GDP growth ratios
• Number of companies with suspended
activity
• Unemployment rate
• Banking and finance:
• Minimum reserve rate
• Interbank rates
• Exchange ratesWhat is happening on the market?
• What sectors and subsectors and type
of businesses will grow?
• What sectors and business stopped
completely?
• What sectors will stop and when?Growth or survival of our clients individuals and MSMEs Business in sectors on the basis of the pyramid will continue to exist. What are they? Food etc For how long? Will we go back to a life model where we will grow our own food?! Business on the top will stop for a while or will go bankrupt. What are these businesses? HORECA, Clothing and Fashion, etc
Growth or survival of our clients
 individuals and MSMEs
  List (Segmentation)
       • all sectors and all subsectors
       • As well as type of business that will survive and grow

  Example:
       • Will agro food survive?
       • Will food traders offline survive

  Suggestion:
       •   Maybe you want to create a online channel with some
           of your clients or partners for your small food traders
       •   Maybe you sponsor and offer for free or half price
Variables and their impact
BS PL Cash Flow and
Maturity
Assets:
- shrinking, the same or Sales (Portfolio)
growing Inflow/ From Clients:
- shrinking, the same or
- structure of the assets? growing -3 month delay
- Income structure -6 month delay,
Equity: - Interest rate -12 month delay,
- shrinking, the same or
growing
- structure of the assets? Cost of funding: Inflow from lenders:
- up or (any planed drawdown)
Liability: - down?
- shrinking, the same or Inflow from Shareholder
growing
Operational and Admin
- structure of the assets? Cost
Inflow from Government
On human capital: health, moral satisfaction and futureVariables and their impact
Diagnose your stress test
         model
Diagnose your model ( spreadsheet)
• Analyze your financial models if you have a
stress test page/module/menu
• Yes,
• No
• If yes, analyze key assumptions (list of
variables you assumed and you want to
change: PAR, Restructuring Rate, Sales
growth, Average loan etc)
• Withdraw from formulas all data and
insert separate in a cell so that you can
change it/stress test it. Link all formulas
to data cells
• If no, build a separate page/module on
stress testingHow close is your approved budget?
• How close is your budget approved in
December to reality?
• 100%
• 50%
• 10%
• Was your worst case scenario discussed,
approved?
• Yes
• NoUnderstanding data availability in the company (indoor)
What do you have in your data base?

     • Do you have only portfolio sales and quality by
       sector?
     • Or do you have detailed portfolio sales and quality
       by all subsectors of the economy: for example
     • From the agriculture sectors do you have details per
       vegetables, fruits etc
     • Relation of the ultimate beneficiary/owner and
       administrators of the MSMEs to other companies in
       the portfolio and in the country in general
     • Type of employment if consumer loans
     • Clients relaying directly on remittances per issuer
       country
What do you have in your data base?
•TotalDo you have only portfolio sales
portfolio outstanding
and
PAR30
quality № by sector?
contract
№
contract PAR
Sector s amount % s amount own, % % in total
Agriculture 1,182 31,491,153 18.4% 193 7,387,489 23.6% 4.3%
Trade 793 36,789,445 21.5% 140 5,734,280 15.6% 3.4%
Industry 150 13,078,171 7.6% 87 8,907,107 49.5% 5.2%
Services 516 44,421,684 26.0% 32 4,211,776 8.4% 2.5%
SCA 100 19,569,927 11.4% 1 16,965 0.9% 0.0%
Staff 51 6,182,259 3.6% 0 0.0% 0.0%
Consumption 709 18,507,331 10.8% 110 272,106 17.0% 0.2%
Other 28 1,099,114 0.6% 2 152,807 13.9% 0.1%
Total 3,529 171,139,082 100% 26,682,531 15.6%What do you have in By subsectors 31/12/2010
your data base? No
PAR 30
Oustanding %
PUBLIC FOOD 5 77,157 2.7%
OTHER DOMAINS 2 152,807 13.9%
RETAIL TRADE 127 5,247,884 16.7%
WHOLESALE TRADE 12 459,188 8.8%
CONSUMER LOAN Since may 2010 divided into 3 (Auto, Home Improv, W&T)
LOANS TO EMPLOEE 0 - 0.0%
CROP GROWING 126 5,259,751 27.2%
• Do you have HOUSEHOLD DURABLES INDUSTRY3
WOOD INDUSTRY
BUILDING MATERIALS INDUSTRY 8
13
115,785
1,456,256
4,614,521
11.1%
40.3%
84.3%
detailed portfolio AGRO PRODUCTION PROCESSING 1
BEVERAGE INDUSTRY
15,370 9.9%
statistics on sales FOOD PROCESSING INDUSTRY
LIGHT INDUSTRY
1
6
47,814
219,373
2.5%
26.8%
and quality by all FINANCIAL INTERMEDIARIES
SALES INTERMEDIARIES
1
1
16,965
27,209
0.1%
24.5%
subsectors of the
Mortgage 1 272,106 8.8%
FISHING 2 53,007 51.6%
SERVICES
economy? AGRO SERVICES
RENTING SERVICES
16
3
466,279
80,298
20.1%
1.6%
REPAIR SERVICES 10 240,665 5.2%
BUILDING FINISHING SERVICES 5 415,687 22.1%
TOURISM AND HOTELS 3 70,233 57.3%
IT SERVICES 4 120,959 46.5%
Private services (photo, legal, cosmetics, etc)
23 1,174,606 17.5%
HEALTHCARE SERVICES
TRANSPORT SERVICES 34 1,565,892 7.0%
ANIMAL PRODUCTION 49 1,641,612 16.9%
AUTO LOANS 12 421,233 28.6%
HOME IMPROVEMENT 96 2,437,988 17.7%
WORK AND TRAVEL
1 11,886 7.3%What do you have By subsectors 31/12/2010
in your data PAR 30
base? PUBLIC FOOD
No
5
Oustanding
77,157
%
2.7%
OTHER DOMAINS 2 152,807 13.9%
RETAIL TRADE 127 5,247,884 16.7%
WHOLESALE TRADE 12 459,188 8.8%
CONSUMER LOAN Since may 2010 divided into 3 (Auto, Home Improv, W&T)
LOANS TO EMPLOEE 0 - 0.0%
CROP GROWING 126 5,259,751 27.2%
For consumer HOUSEHOLD DURABLES INDUSTRY3
WOOD INDUSTRY 13
115,785
1,456,256
11.1%
40.3%
loans you will BUILDING MATERIALS INDUSTRY 8
AGRO PRODUCTION PROCESSING 1
4,614,521
15,370
84.3%
9.9%
need as well to
BEVERAGE INDUSTRY
FOOD PROCESSING INDUSTRY 1 47,814 2.5%
LIGHT INDUSTRY 6 219,373 26.8%
know in what FINANCIAL INTERMEDIARIES
SALES INTERMEDIARIES
1
1
16,965
27,209
0.1%
24.5%
sector the Mortgage
FISHING
1
2
272,106
53,007
8.8%
51.6%
employer is SERVICES
AGRO SERVICES 16 466,279 20.1%
working and how
RENTING SERVICES 3 80,298 1.6%
REPAIR SERVICES 10 240,665 5.2%
BUILDING FINISHING SERVICES 5 415,687 22.1%
affected is that TOURISM AND HOTELS
IT SERVICES
3
4
70,233
120,959
57.3%
46.5%
sector Private services (photo, legal, cosmetics, etc)
HEALTHCARE SERVICES
23 1,174,606 17.5%
TRANSPORT SERVICES 34 1,565,892 7.0%
ANIMAL PRODUCTION 49 1,641,612 16.9%
AUTO LOANS 12 421,233 28.6%
HOME IMPROVEMENT 96 2,437,988 17.7%
WORK AND TRAVEL
1 11,886 7.3%Stress test scenarios
Variables and their impact
Sales scenarios (growth rate %)
  30                                                     25
                                                    20
  20                                           15
                                          10
  10
                                      0
   0

  -10
                                -10
  -20
                          -20
  -30
                    -30
  -40
              -40
  -50
        -50
  -60
Loan portfolio restructuring rate (%)
0
Scenario 1 Scenario 2 Scenario 3 Scenario 4 Scenario 5 Scenario 6 Scenario 7
-10
-10
-20
-20
-30
-30
-40
-40
-50
-50
-60
-60
-70
-80
-80
-90Stress test: one variable
One factor stress test
Factor Stressed (on/off) Degree Stressed
reduction in disbursements from 2020 - 2021; 50% reduction in new
1 PORTFOLIO GROWTH OFF 20% branches; 40% reduction in new staff hired
2 PORTFOLIO YIELD OFF 1% reduction in average weighted interest rate; 0.5% Reduction in Year 2021
3 PORTFOLIO QUALITY ON 20% decrease in portfolio quality (PAR30) over base case
4 OVERHEAD EXPENSES OFF 10% increase in administration and personnel costs (2020-2021)
5 COST OF FUNDS OFF 15% increase in the average cost of debt (2020-2021)
6 REDUCED ACCESS TO DEBT OFF 20% Liability amount decrease by 20%Multifactor stress test, key assumptions
Factor Stressed (on/off) DegreeinStressed
reduction disbursements from 2020 - 2021; 50% reduction in new
1 PORTFOLIO GROWTH ON 20% branches; 40% reduction in new staff hired
2 PORTFOLIO YIELD ON 1% reduction in average weighted interest rate; 0.5% Reduction in Year 2021
3 PORTFOLIO QUALITY ON 20% decrease in portfolio quality (PAR30) over base case
Restructuring rate
Write off ratio
4 OVERHEAD EXPENSES ON 10% increase in administration and personnel costs (2020-2021)
5 COST OF FUNDS ON 15% increase in the average cost of debt (2020-2021)
6 REDUCED ACCESS TO DEBT ON 20% Liability amount decrease by 20%Simple stress test Case 1
Assumptions:
- a portfolio of 171 million at the end of March
• 10% of portfolio outstanding is due every month
• at 12% interest annually
Decision: We decided to rollover principal for 3 months for
all clients
Impact: If we make the above decision, 17.1 million will
not reach FI accounts next three months, thus 51.3 million.
Did we make a good decision?Simple stress test, continuation Case 1
•Analysis and discussion: Did we make a good decision?
•No
• Because we automatically increased the maturity risk and
liquidity risk by 51.3 million. We mismatched our assets
vs. our liabilities because we did nothing on the liability
side and outflow side.
• We don’t need to do it for all clients. Some clients are in
operations. Some clients just want to repay all loans and
stay calm during pandemic incidentsStress test, templates
Stress test: Decision next 3 month principal repayment postponment for 3 month
Cash flow (initial vertion)
1 month 2 month 3 month 3-6 month3-9 month9-12 month
Total 12m 1-2 years 2-3 years 3-5 years 5-10 years
Inflow from
Loan principal repayments 17 17 17 51 51 17 170
Interest
Penalties
Outflow
New loans disbursments
Loans to lenders
Admin and Oper Cost
Dividents
Net cash flow 17 17 17 51 51 17 170
Cash flow (3 month rollover)
1 month 2 month 3 month 3-6 month6-9 month9-12 monthTotal 12m 1-2 years 2-3 years 3-5 years 5-10 years
Inflow from
Loan principal repayments 17 17 17 0 102 17 170 0
Interest
Penalties
Outflow
New loans disbursment
Loans to lenders 60
Admin and Oper Cost
Dividends
Net cash flow 17 17 17 - 600 102 17 170Stress test, templates: 12m Rollover? 24 month
Rollover?
Cash flow (12 month rollover)
1 month 2 month 3 month 3-6 month3-9 month9-12 monthTotal 12 m1-2 years 2-3 years 3-5 years 5-10 years
Initital cash balabce 0
Inflow from 17 17 17 0 51 17 119 51
Loan principal 17 17 17 0 51 17 119 51
Interest
Penalties
Outflow
New loans disbursment
Loans to lenders
Admin and Oper Cost
Dividends
Net cash flow 17 17 17 0 51 17 119 51
Cumulative cash flow 17 34 51 51 102 119 119 170
Cash flow (24 month rollover)
1 month 2 month 3 month 3-6month 3-9 month9-12 monthTotal 12 m1-2 years 2-3 years 3-5 years 5-10 years
Initial cash balance 0
Inflow from 17 17 17 51 17 119 0 51
Loan principal 17 17 17 0 51 17 119 0 51
Interest
Penalties
Outflow
New loans from lenders
Dividends
Admin and Oper Cost
Dividends
Net cash flow 17 17 17 0 51 17 119 0 51
Cumulative cash flow 17 34 51 51 102 119 119 119 170Simple stress test, TO DO
• Before we do anything on our assets we need to make sure
that our liabilities and shareholder equity structure will
change or at least shareholders and lenders will approve
changes!
• Map all your liability repayments per lender
• Observe were and when you have the biggest
payments outflow
• Finalize the stress test scenarios and presentation of
the scenarios
• Propose to negotiate liability rollover
• Smooth the payments for as long as possible but
avoid crowding cash out in one month or quarter
especially in the seasons when you may need it for
lending.Simple stress test, analyze your liability schedule
Jan Feb Mar Apr May Jun Jul Aug Sep Oct Nov Dec Total
OUTFLOW 4,408,583 5,390,752 2,143,931 7,694,418 38,035,880 995,447 2,449,582 9,052,201 44,049,403 4,179,862 12,778,745 7,602,995 138,781,800
Outstanding borrowings
Curren Initial
amount (local principals'
cy loan
currency) repayments 3,856,533 4,880,985 0 6,321,067 34,688,401 0 1,222,545 7,838,324 42,175,440 1,935,339 10,455,303 6,705,840 120,079,778
EURO 120000 1,935,339 Lender 1 - - - - - - - - 1,935,339 - - 1,935,339
EURO 1000000 786,533 Lender 2 786,533 - - - - - - - - - - - 786,533
EURO 5000000 14,554,820 Lender 3 - - - 5,198,150 - - - - - 9,356,670 - 14,554,820
EURO 400000 6,705,840 Lender 4 - - - - - - - - - - 6,705,840 6,705,840
EURO 700000 2,471,924 Lender 5 - - - 1,373,291 - - - - - 1,098,633 - 2,471,924
USD 3000000 6,321,067 Lender 6 - - 6,321,067 - - - - - - - - 6,321,067
EURO 650000 7,838,324 Lender 7 - - - - - - 7,838,324 - - - - 7,838,324
USD 5000000 42,175,440 Lender 8 - - - - - - - 42,175,440 - - - 42,175,440
USD 1500000 28,116,960 Lender 9 - - - 28,116,960 - - - - - - - 28,116,960
local
currenc 40000000 7,950,985 Lender 10 7,950,985
y 3,070,000 4,880,985 - - - - - - - - - -
- 1,222,545 Lender 11 - - - - - 1,222,545 - - - - - 1,222,545
- - Lender 12 - - - - - - - - - - - 0
- - Lender ..XX - - - - - - - - - - - - 0
OUTFLOW
Outstanding borrowings
Curren Initial
amount (local principals'
cy loan
currency) repayments 3,856,533 4,880,985 0 0 1,373,291 0 7,543,612 42,526,725 42,175,440 1,935,339 10,455,303 6,705,840 120,079,778
EURO 120000 1,935,339 Lender 1 - - - - - - - - 1,935,339 - - 1,935,339
EURO 1000000 786,533 Lender 2 786,533 - - - - - - - - - - - 786,533
EURO 5000000 14,554,820 Lender 3 - - - - - - 5,198,150 - - 9,356,670 - 14,554,820
EURO 400000 6,705,840 Lender 4 - - - - - - - - - - 6,705,840 6,705,840
EURO 700000 2,471,924 Lender 5 - - - 1,373,291 - - 1,373,291 - - 1,098,633 - 2,471,924
USD 3000000 6,321,067 Lender 6 - - - - - 6,321,067 - - - - - 6,321,067
EURO 650000 7,838,324 Lender 7 - - - - - - 7,838,324 - - - - 7,838,324
USD 5000000 42,175,440 Lender 8 - - - - - - - 42,175,440 - - - 42,175,440
USD 1500000 28,116,960 Lender 9 - - - - - - 28,116,960 - - - - 28,116,960
local
currenc 40000000 7,950,985 Lender 10 7,950,985
y 3,070,000 4,880,985 - - - - - - - - - -
- 1,222,545 Lender 11 - - - - - 1,222,545 - - - - - 1,222,545
- - Lender 12 - - - - - - - - - - - 0
- - Lender ..XX - - - - - - - - - - - - 0Loan restructuring amount in total equity
(rate %)
If our liability structure and maturity will not change
120
Do we need to limit the loan restructuring to a % of the total equity?
100
100
90
Can we restructure 100% of the equity? 80
80
70
60
60
50
40
40
30
20
20
10
0Stress test Output
Stress test output: Cash flow scenarios template

          Scenario nr.                        1                       2                                3                      4                        5                     6
                                                   All lenders rollover    All lenders rollover with out The same as in 3rd        With New Lender 2 The same as 5 but not
                                                   except for lender 1,  Lender5, without New lender 1 scenario and without         MDL12m, without      growth at all
                                                  New loan to be issued first tranche (MDL 11m) and new    New lender 2           Lender 4 new loan, and
                                                    from Shareholder lender 1 second tranche postponed                             cut in disbursements
                                                         MDL40m          (20m), with MDL18m new loan                                   by MDL 27m
                                                                                 from New lender 2
       Key assumptions             basic
GLP                                  251.00                  251.00                           251.00                251.00                    227.78               205.00

% growth of GLP                       21.07%                   21.07%                          21.07%                21,07%                    10.00%                 -

           Cash flow

Inflow (repayments of Principal)     155.17                  155.17                           151.61                151.61                    147.85               147.85

Inflow (new debt)                    157.37                  130.84                           129.22                111.17                    102.10               102.10

Outflow (Disbursments)               205.85                  205.85                           205.15                205.15                    178.15               155.45
Outflow (debt principal)             140.05                  115.12                           120.08                120.08                    120.08               120.08
Outflow (debt interest)               16.04                   17.79                            16.55                 15.95                     15.85                15.85

Net Cumulative Cash                      3.73                   10.39                            (3.78)               (21.00)                    1.50               24.20
Simple stress test, TO DO •How about other type of liabilities: •Deposit accounts? What shall we stress test? •Will you stop interest rate? Will you rollover/renew accounts? •What if they come to withdraw on earlier term that cash for food if clients salaries are not paid.
Stress test multiple variables
  (composite)
 •Until now we did only stress test on restructuring
  assuming sales are the same.
 •Additional factors are:
     •Sales reduction
     • Cost reduction, cost the same but structure
       changed or cost up!

 •TO DO: Multivariable case stress test and output
  with all financial data and indicators including
  covenants
Multifactor stress test, key
assumptions
Factor Stressed (on/off) DegreeinStressed
reduction disbursements from 2020 - 2021; 50% reduction in new
1 PORTFOLIO GROWTH ON 20% branches; 40% reduction in new staff hired
2 PORTFOLIO YIELD ON 1% reduction in average weighted interest rate; 0.5% Reduction in Year 2021
3 PORTFOLIO QUALITY ON 20% decrease in portfolio quality (PAR30) over base case
Restructuring rate
Write off ratio
4 OVERHEAD EXPENSES ON 10% increase in administration and personnel costs (2020-2021)
5 COST OF FUNDS ON 15% increase in the average cost of debt (2020-2021)
6 REDUCED ACCESS TO DEBT ON 20% Liability amount decrease by 20%Stress test multiple variables (composite output)
MULTIFCATOR
Output PROJECTION v2019 LOW impact
2020 2021 2021 2022
Outreach
# of Branches 23 25 20 21
% clients reached and served online 10% 20%
Value of Loans Disbursed (millions) 466.5 586.5 373.2 469.2
Balance Sheet
Gross Loan Portfolio (millions) 506.2 643.6 405.4 515.3
Loan Loss Reserve (9.1) (11.5) (7.2) (9.2)
Total Assets 759.5 897.1 621.2 730.0
Total L Borrowings 627.5 733.3 513.4 596.8
Total L Savings and Current Acc
Total Equity 114.4 142.8 93.5 116.1
Income Statement
Revenue on Portfolio 96.0 124.3 73.5 95.0
Financial Cost 43.8 50.4 40.1 46.7
Total Provision Expense 14.4 15.5 11.5 12.4
Other Financial Income 24.1 22.4 21.7 19.6
Net Margin 61.9 80.8 43.6 55.7
Total Operational Costs 42.3 46.6 41.3 45.2
Net Income from Operations 19.6 34.2 2.3 10.4
Net Income 15.4 27.1 1.6 8.1Stress test multiple variables (composite output)
MULTIFCATOR
Output PROJECTION v2019 LOW impact
2020 2021 2021 2022
Key Ratios
% Growth in GLP 37% 27% 37% 27%
PAR > 30 (%) 2.8% 2.8% 2.8% 2.8%
Write-off Ratio 1.5% 1.0% 1.5% 1.0%
Loan Loss Reserves / PAR>30 63% 63% 63% 63%
Recovery Rate 68% 75% 68% 76%
Total Equity/(Assets - 80% of Cash -
100% of FX Deposits) 20% 20% 20% 20%
(Total Debt - 100% of FX Deposits) /
Total Equity 4.1x 4.1x 4.1x 4.1x
ROE 14.6% 21.1% 1.8% 7.7%
ROA 2.3% 3.3% 0.3% 1.2%
Cost to Income Ratio 84% 77% 98% 91%
Operational Self-Sufficiency 120% 130% 102% 110%
Yield on Portfolio (% of Avg. GLP) 20.2% 20.1% 19.2% 19.2%
Funding Ratio (net of interest on deposits) (% of Avg.
8.2%
GLP) 7.3% 9.6% 8.6%
Provisioning Ratio (% of Avg GLP) 2.4% 1.9% 2.3% 1.8%
Portfolio financial margin 9.6% 11.0% 7.2% 8.7%
Funding Requirements
New Equity Required 2.5 1.3 6.3 14.6
New Debt Financing Required 146.7 105.7 132.5 83.4
New Debt Financing (excluding back-to-back) 155.1 116.0 135.4 92.4Stress test multiple variables (composite output)
MULTIFCATOR MULTIFCATOR MULTIFCATOR
Output PROJECTION v2019 LOW impact MEDIUM impact HIGH Impact
2020 2021 2021 2022 2021 2022 2021 2022
Outreach
# of Branches 23 25 20 21 15 18 10 10
% clients reached and served online 10% 20% 10% 20% 0% 0%
Value of Loans Disbursed (millions) 466.5 586.5 373.2 469.2 373.2 469.2 373.2 469.2
Balance Sheet
Gross Loan Portfolio (millions) 506.2 643.6 405.4 515.3 380.0 400.0 350.0 300.0
Loan Loss Reserve (9.1) (11.5) (7.2) (9.2)
Total Assets 759.5 897.1 621.2 730.0
Total L Borrowings 627.5 733.3 513.4 596.8
Total L Savings and Current Acc
Total Equity 114.4 142.8 93.5 116.1
Income Statement
Revenue on Portfolio 96.0 124.3 73.5 95.0
Financial Cost 43.8 50.4 40.1 46.7
Total Provision Expense 14.4 15.5 11.5 12.4
Other Financial Income 24.1 22.4 21.7 19.6
Net Margin 61.9 80.8 43.6 55.7
Total Operational Costs 42.3 46.6 41.3 45.2
Net Income from Operations 19.6 34.2 2.3 10.4
Net Income 15.4 27.1 1.6 8.1Stress test Team
Stress test team
•Work in team, work in parallel to save time
    • Stress test architect (CFO, Vice CFO, Chief
      analysts)
    • Stress test assumptions approval (Crisis Task
      Force, Crisis Committee, Risk Committee)
    • Assumption per departments (Department
      managers)
    • Formulas design: analysis
    • Testing: different analyst may be as well IT tester.
    • Testing output CEO, CFO, Vice CEO, Vice CFO
In conclusion
In conclusion key actions
• Analyze your asset structure, liability and owners
  equity
• For smaller MFIs                          You are
                                            better

• If you are financed with equity only:     positions
                                            than others

• Understand your portfolio structure by as mush as
  possible details prepare stress test
• Discuss with shareholders the restructuring limits
• Discuss with shareholders possibility to grow in
  crisis
• Segment clients you want to support.
In conclusion key actions
• Analyze external data
• Analyze MFI asset structure, liability and owners
equity
• For smaller MFIs
• If your MFI have high leverage:
• Understand your portfolio structure by as mush
as possible details prepare stress test
• Stress test
• Discuss with lenders the restructuring limits
• Discuss with shareholders and lenders possibility
to grow in crisis
• Segment clients you want to support.In conclusion key actions • Diagnose where you are? • Diagnose what tools you have? Excel, model etc. • Diagnose abilities and human capital for stress test? • Apply multivariable stress test and present a simple table output • Work in parallel with different teams to speed up • Communicate results internally, approve scenarios with shareholders • Test some scenarios with key lenders
In conclusion
•Recruit online volunteers if you need help (usually
 students in last two years) for:
            • For analyzing your data base
            • For forecasting and stress testing in
              paralel to speed the processes
            • For testing new products
            • For testing your IT security
•Cooperate with start up communities from different
incubators, acclerators etc
            • Writing testing new processes
            • Financial models and stress tests
In conclusion
•If you will apply above mentioned:
• I am sure you will be more prepared for next
crisis you will have a stress test module and a
scenario close to the reality
• I am sure you will be more prepared, your
immunity will strong to face new crisisTerminology
Terminology
    • Stress testing:

    • In financial industry: Stress testing is a simulation or analysis designed to
      find out how resilient a financial instrument, investment portfolio, financial
      institution, or whole economy is at dealing with extreme situations and
      economic crises.

    • Stress testing may also refer to tests that measure how well a company or
      industry might fare/cope when exposed to certain stressors (factors).

    • Stress testing is a computer simulation technique used to test the
      resilience of institutions and investment portfolios against possible future
      financial situations. (Investopedia.com)
Terminology Sensitivity analysis - for this presentation the same as stress test, What if analysis - for this presentation the same as tress test, In the banking and lending world, a standstill agreement between a lender and borrower halts the contractual repayment schedule for a distressed borrower and forces certain actions that the borrower must undertake. A new deal is negotiated during the standstill period that usually alters the loan's original repayment schedule. A moratorium allows you to delay the payment of a debt for a finite period of time. In the loan context, this is also known as a deferment or forbearance. If you are facing a temporary hardship, you can request a moratorium and briefly postpone your loan payments. Moratorium is a sort of granting of a ’holiday’- it is a repayment holiday where the borrower is granted an option to not pay during the moratorium period. It is a restructuring of the terms of the loan with the mutual consent of the lender and the borrower. Rollover – for this presentation the same as moratorium
Terminology
Stress test - please see definitions at the beginning of the presentation,
Sensitivity - for this presentation the same as stress test,
What if analysis - for this presentation the same as tress test,

In the banking and lending world, a standstill agreement between a lender and borrower
halts the contractual repayment schedule for a distressed borrower and forces certain
actions that the borrower must undertake. A new deal is negotiated during the standstill
period that usually alters the loan's original repayment schedule.

A moratorium allows you to delay the payment of a debt for a finite period of time. In
the loan context, this is also known as a deferment or forbearance. If you are facing a
temporary hardship, you can request a moratorium and briefly postpone your loan
payments.

Moratorium is a sort of granting of a ’holiday’- it is a repayment holiday where the
borrower is granted an option to not pay during the moratorium period. It is a
restructuring of the terms of the loan with the mutual consent of the lender and the
borrower.

Rollover – for this presentation the same as moratorium
HEALTH
Plank for 2 minutes everyday
Thank you!
             Contact us!
             Microfinance Centre
             Noakowskiego 10/38
             00-666 Warsaw, Poland
             +48 22 622 34 65

             kdabrowska@mfc.org.pl
You can also read