Investor Presentation August 2021 - Mapletree ...

Page created by Ronald Walsh
 
CONTINUE READING
Investor Presentation August 2021 - Mapletree ...
Investor Presentation
August 2021
Investor Presentation August 2021 - Mapletree ...
Important Notice
This presentation shall be read in conjunction with Mapletree Industrial Trust’s (“MIT”) financial results for First Quarter
Financial Year 2021/2022 in the SGXNET announcement dated 27 July 2021.

This presentation is for information only and does not constitute an offer or solicitation of an offer to sell or invitation to
subscribe for or acquire any units in Mapletree Industrial Trust (“Units”).

The past performance of the Units and MIT is not indicative of the future performance of MIT or Mapletree Industrial Trust
Management Ltd. (the “Manager”).

The value of Units and the income from them may rise or fall. Units are not obligations of, deposits in or guaranteed by the
Manager or any of its affiliates. An investment in Units is subject to investment risks, including the possible loss of the
principal amount invested. Investors have no right to request the Manager to redeem their Units while the Units are listed. It is
intended that unitholders may only deal in their Units through trading on the Singapore Exchange Securities Trading Limited
(“SGX-ST”). Listing of the Units on the SGX-ST does not guarantee a liquid market for the Units.

This presentation may also contain forward-looking statements that involve risks and uncertainties. Actual future
performance, outcomes and results may differ materially from those expressed in forward-looking statements as a result of
risks, uncertainties and assumptions. Representative examples of these factors include general industry and economic
conditions, interest rate trends, cost of capital, occupancy rate, construction and development risks, changes in operating
expenses (including employees wages, benefits and training costs), governmental and public policy changes and the
continued availability of financing. You are cautioned not to place undue reliance on these forward-looking statements, which
are based on current view of management on future events.

Nothing in this presentation should be construed as financial, investment, business, legal or tax advice and you should
consult your own independent professional advisors.

2
Investor Presentation August 2021 - Mapletree ...
Contents

    01   Key Highlights
    02   Overview of Mapletree Industrial Trust
    03   Portfolio Update
    04   1QFY21/22 Financial Highlights
    05   Outlook and Strategy

3
Investor Presentation August 2021 - Mapletree ...
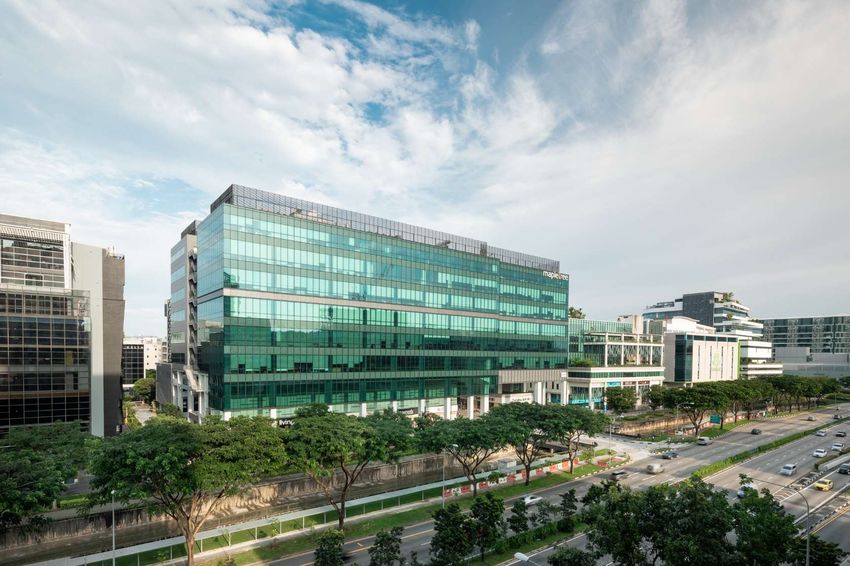
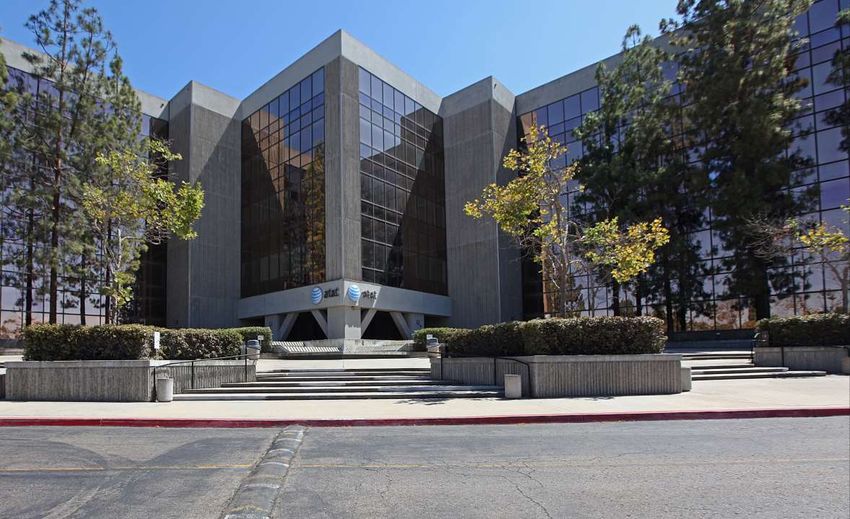
KEY HIGHLIGHTS

Data Centres, 44490 Chilum Place (ACC2), Northern Virginia
Investor Presentation August 2021 - Mapletree ...
114 Properties Across 6 Property Segments
S$6.7 billion1                                                   20.9 million2                                                     >2,000 tenants
AUM                                                              NLA (sq ft)                                                       Tenant Base

                                Light Industrial
                                   Buildings
                                     1.0%                                   Data Centres: 39.8%
                  Stack-up/Ramp-up                                          Singapore: 4.5%
                      Buildings                                             North America: 35.3%
                        7.4%

                                                                                                                                 Data Centres                         Flatted Factories
 Flatted
Factories
 22.2%                           AUM1
                              S$6.7 billion
                                                                                                                                                                   Stack-up/Ramp-up
Business Park
  Buildings                                                                                                                 Hi-Tech Buildings                               Buildings
    8.7%

               Hi-Tech Buildings
                    20.9%

    AUM by geography
    Singapore                                                                                   64.7%
                                                                                                                  Business Park Buildings                   Light Industrial Buildings
    North America                                                                               35.3%

     1   Based on MIT’s book value of investment properties as well as MIT’s interest of the joint venture with MIPL in three fully fi tted hyperscale data centres and 10 powered shell
         data centres in North America and included MIT’s right-of-use assets as at 30 Jun 2021.
5    2   Excludes the parking decks (150 Carnegie Way and 171 Carnegie Way) at 180 Peachtree .
Investor Presentation August 2021 - Mapletree ...
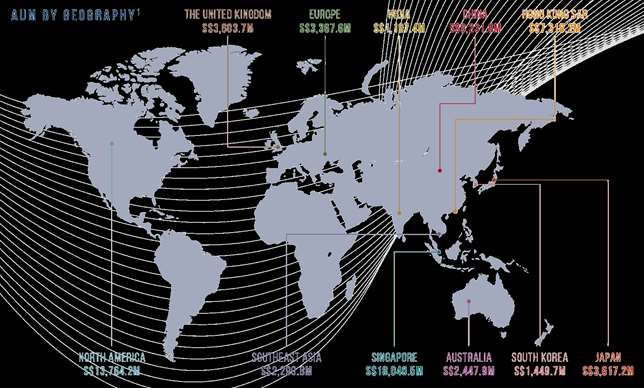
Sustainable and Growing Returns
   Distributable Income                                                                                                                                                  DPU
        (S$ million)                                                                                                                                                   (cents)

   100                                                                                                                                                             3.35
                                                                                                                                                                3.30
                                                                                                                                                                          3.50
                                                                                                                                                     3.28
                                                                                                                                   3.16
                                                                                                                       3.10 3.13                  3.10
     90
                                                                                                                                             2.87
                                                                                                                                      2.85               81.1
                                                                                                                                                                   82.7   3.00
     80
                                                                                                                                                  72.9
                                                                                                                                                                70.7
                                                                                                                                  69.4 69.270.6                           2.50
     70
                                                                                                                       63.263.5

     60
                                                                                                                                                                          2.00
     50
                                                                                                                                                                          1.50
     40

     30                                                                                                                                                                   1.00

     20
                                                                                                                                                                          0.50
     10

        0                                                                                                                                                                 0.00
                3Q¹ 4Q 1Q 2Q 3Q 4Q 1Q 2Q 3Q 4Q 1Q 2Q 3Q 4Q 1Q 2Q 3Q 4Q 1Q 2Q 3Q 4Q 1Q 2Q 3Q 4Q 1Q 2Q 3Q 4Q 1Q 2Q 3Q 4Q 1Q 2Q 3Q 4Q 1Q 2Q 3Q 4Q 1Q
                FY10/11   FY11/12   FY12/13       FY13/14    FY14/15    FY15/16     FY16/17      FY17/18     FY18/19       FY19/20              FY20/21 FY21/22

DPU
                3.45       8.41      9.24         9.92 Distributable
                                                             10.43      11.15 (S$ million)
                                                                     Income         11.39        11.75     12.16
                                                                                                   DPU (cents)             12.24                  12.55
(cents)

            1    MIT was listed on 21 Oct 2010.
    6
Investor Presentation August 2021 - Mapletree ...
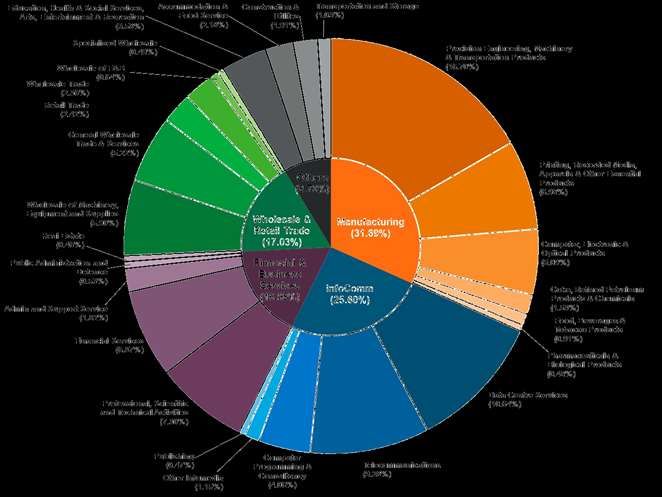
Portfolio Growth since IPO
                                                                                                                                                   FY20/21      FY21/22
  3 Asset Enhancement                                                                                                                              S$6.8b
    Initiatives (“AEI”)
                                                                                                                                       FY19/20
  5 Build-to-Suit (“BTS”)                                                                                                                 S$5.9b
    Projects                                                                                                                                          Acquisition
  9 Acquisitions                                                                                                            FY18/19
                                                                                                                                                         Remaining
                                                                                                                                                        60% interest
                                                                                                                                                       in 14 US DCs
                                                                                                                            S$4.8b
                                                                                                                  FY17/18                              US$494m
                                                                                                                  S$4.3b
                                                                                                                                                      Acquisition
                                                                                                       FY16/17                                            DC in
                                                                                           FY15/16     S$3.7b                                            Virginia
                                                                      FY14/15                                                                         US$220.9m
                                                                                           S$3.6b
                                                    FY13/14           S$3.4b
                                 FY12/13            S$3.2b
              FY11/12             S$2.9b
                                                                                                                                                             Acquisition
              S$2.7b                                                                                                                                          29 US DCs
FY10/11                                                                                                                         Acquisition                   US$1.32b
                                              AEI                         Acquisition                       BTS
S$2.2b 1                                                                   2A Changi                       1 & 1A
                                                                                                                                  Upgraded
                                          Woodlands
                                                                                                                               7 Tai Seng Drive
                                           Central                        North Street 2                 Depot Close
                                                                                                                                    to a DC
                                            S$30m                            S$12m                        S$226m
                                                                                                                                  S$95m

                                               BTS                             BTS                       Acquisition                BTS                      BTS
           Acquisition                                                       26A Ayer
                                          K&S Corporate                                                   40% interest            Mapletree                  Kolam
            11 Flatted                                                         Rajah
                                           Headquarters                                                  in14 US DCs²          Sunview Drive 1               Ayer 2
            Factories
                                              S$50m                          Crescent                     US$300m                 S$76m                  S$300m
            S$400m                                                           S$101m

  FY10/11         FY11/12         FY12/13      AEIFY13/14          FY14/15          FY15/16          FY16/17 AEI FY17/18    FY18/19     FY19/20
                                                                                                                                Acquisition             Acquisition
                                                                                                                                                   FY20/21    FY21/22
                                           Toa Payoh                                                      30A Kallang            18 Tai Seng             13 North
                                            North 1                                                          Place                                     American DCs 3
                                                                                                                                  S$268m
                                            S$40m                                                          S$77m                                         US$684m
       1     Valuation of investment properties on 31 Mar at end of each financial year.
       2     Acquired through a 40:60 joint venture with MIPL.
   7   3     Acquired through a 50:50 joint venture with MIPL.
Investor Presentation August 2021 - Mapletree ...
1QFY21/22 Highlights
 Growth driven mainly by contributions from North American data centres and
  absence of rental reliefs in 1QFY21/22
  • 1QFY21/22 Distributable Income: S$82.7 million ( 17.2% y-o-y)
  • 1QFY21/22 DPU: 3.35 cents ( 16.7% y-o-y)

 Announced US$1.32 billion acquisition of 29 data centres in the United States of
  America (the “United States”) on 20 May 2021, which was completed on
  22 Jul 2021 (the “US Portfolio Acquisition”)

 Portfolio Update
  • Average Overall Portfolio occupancy increased q-o-q from 93.7% to 94.3% in
     1QFY21/22
  • Average rental rate of Singapore Portfolio increased q-o-q from S$2.05 psf/mth to
     S$2.13 psf/mth in 1QFY21/22

 Capital management update
  • Issued inaugural S$300.0 million perpetual securities at 3.15% in May 2021
  • Successfully completed an S$823.3 million equity fund raising exercise in Jun 2021

8
Investor Presentation August 2021 - Mapletree ...
Acquisition – 29 Data Centres in the United States

                                           400 Minuteman Road, Andover                 250 Williams Street NW, Atlanta   2601 West Broadw ay Road, Tempe

                                          Announced acquisition of a portfolio of 29 data centres in the United States
    Acquisition
                                          (the “New Portfolio”) on 20 May 2021

    Vendors                               Subsidiaries of Sila Realty Trust, Inc.

    Valuation                             US$1,335.0 million1 (S$1,802.3 million)2

                                          Purchase Consideration: US$1,320.0 million (S$1,795.2 million)
    Purchase Consideration
                                          Total Acquisition Outlay: US$1,342.3 million (S$1,825.5 million)

    Land Area                             8.4 million sq ft

    Net Lettable Area                     3.3 million sq ft

    Completed                             22 Jul 2021 (Eastern Standard Time)
      1   Independent valuation by New mark Knight Frank Valuation & Advisory, LLC as at 30 Apr 2021.
9     2   Unless otherw ise stated, an illustrative exchange rate of US$1.00 to S$1.36 is used in this presentation.
Investor Presentation August 2021 - Mapletree ...
Overview of the New Portfolio

                        One of the largest owners of data centres among REITs listed in APAC1

 29
 Data Centres

                                                                                                            2
                                                                                                        Minnesota
 7.9 years                                                                                                                        1                        Massachusetts
 WALE                                                                                                                        Michigan                            1
                                                                                                                                                    1           1    Connecticut
                                                                                                                      2       1       2     Pennsylv ania
                                                                                                                    Illinois Indiana Ohio                1
 87.8%                                                                                                                                            2
                                                                                                                                                    New Jersey

 Occupancy2                             5                                                                                                      Virginia
                                                                                                    1                         1                      North
                                   California                                                                                                   1
                                                                                              Oklahoma                    Tennessee                 Carolina
                                                              2                                                                                  South
                                                                                                                                            1
 94.1%                                                   Arizona                                                                    2
                                                                                                                                                Carolina

 Freehold3                                                                                    2                                   Georgia
                                                                                            Texas
                                        Location of Properties
                                        (Number of data centres indicated in the circles)

 1.5-3.0%
 Rental escalation p.a.
 (for 89.4% of leases)
      1   By AUM.
      2   Includes 250 Williams Street NW, Atlanta w ith an occupancy of 63.5% as at 1 Jun 2021. Excluding 250 Williams Street NW, Atlan ta, New Portfolio
          occupancy w as at 98.4% as at 1 Jun 2021.
      3   All Properties are sited on freehold land, except for 2005 East Technology Circle, Tempe and part of 250 Williams Street NW, Atlanta, w hich had
10        remaining land tenures of 61.6 years and 46.7 years respectively as at 1 Jun 2021.
Redevelopment – Kolam Ayer 21
     161, 163 & 165 Kallang Way 1                                                                                                 GFA                   Plot Ratio

 Kolam Ayer 2 Cluster                       Two Flatted Factories and an amenity centre                                    506,720 sq ft                      1.5

                                                New Hi-Tech Buildings, including a
 After Redevelopment                                                                                                       865,600 sq ft                      2.5
                                            seven-storey BTS Facility for Anchor Tenant

                Artist’s impression of MIT’s new high-tech industrial                   Completed piling for Block 1 and 2. Substructure works in
                precinct with BTS Facility on the left                                  progress

          Redevelopment of Flatted Factories into a new high-tech industrial precinct at total project cost of S$300 million2
          Secured pre-commitment from a global medical device company headquartered in Germany (the “Anchor Tenant”)
           for about 24.4% of enlarged GFA (~211,000 sq ft)
          BTS Facility is 100% committed by Anchor Tenant for lease term of 15 + 5 + 5 years 3 with annual rental escalations
          Commenced construction for two industrial buildings in late Nov 2020; Construction contract of third industrial
           building was awarded in May 2021
          Expected completions of 161 & 163 Kallang Way in 2H2022 and 165 Kallang Way in 1H2023

     1   Upon commencement of the redevelopment w orks in Jul 2020, the cluster w as renamed after its new address (161, 163 & 165 Kalla ng Way).
     2   Includes the book value of the Kolam Ayer 2 Cluster at S$70.2 million as at 31 Mar 2019 prior to the commencement of the redevelopment.
11   3   Includes a rent-free period of 6 months distributed over the first six years. Anchor Tenant is responsible for all operating expense and property tax of the BTS Facility.
OVERVIEW OF
                          MAPLETREE INDUSTRIAL TRUST

Hi-Tech Building, 18 Tai Seng
Overview of Mapletree Industrial Trust
                           Mapletree Investments Pte Ltd                                          Public & Inst
                                                                                                                                  MIPL
Sponsor                    (“MIPL”)                                                               Unitholders

                                                                                                74.5%                                25.5%
                           Owns 25.5% of MIT                                                                                                 Trustee

                           Focused on (i) industrial real estate
                           assets in Singapore, excluding                                                                                    Manager
Investment
                           properties primarily used for logistics
mandate
                           purposes and (ii) data centres
                                                                                                                  MIT Portfolio              Property
                           worldwide beyond Singapore                                                                                        Manager

                           114 properties valued at S$6.7 billion1
Portfolio
                           20.9 million2 sq ft NLA

                           Mapletree Industrial Trust
Manager                    Management Ltd.
                           100% owned by the Sponsor
                           Mapletree Facilities Services
Property                   Pte. Ltd. and Mapletree US
Manager                    Management LLC
                           100% owned by the Sponsor
Trustee                    DBS Trustee Limited
     1   Based on MIT’s book value of investment properties as well as MIT’s interest of the    AUM by geography
         joint venture with MIPL in three fully fitted hyperscale data centres and 10 powered
         shell data centres in North America and included MIT’s right-of-use assets as at       Singapore                                       64.7%
         30 Jun 2021.
     2   Excludes the parking decks (150 Carnegie Way and 171 Carnegie Way) at 180              North America                                   35.3%
13       Peachtree.
Diverse Portfolio of 114 Properties

       DATA CENTRES                                         FLATTED FACTORIES
       Facilities used primarily for the storage and        High-rise multi-tenanted industrial buildings
       processing of data. These include core-and-shell     with basic common facilities used for light
       to fully-fitted facilities, which include building   manufacturing activities .
       fit-outs as well as mechanical and electrical
       systems.

       HI-TECH BUILDINGS                                    STACK-UP/RAMP-UP
                                                            BUILDINGS
       High-specification industrial buildings with
       higher office content for tenants in technology
                                                            Stacked-up factory space with vehicular
       and knowledge-intensive sectors. Usually             access to upper floors. Multi-tenanted space
       fitted with air-conditioned lift lobbies and         suitable for manufacturing and assembly
       common areas.                                        activities.

       BUSINESS PARK BUILDINGS                              LIGHT INDUSTRIAL
                                                            BUILDINGS
       High-rise multi-tenanted buildings in specially
       designated “Business Park zones”. Serve as           Multi-storey developments usually
       regional headquarters for MNCs as well as            occupied by an anchor tenant for light
       spaces for R&D and knowledge-intensive               manufacturing activities.
       enterprises.

14
Healthy Returns since IPO

 COMPARATIVE TRADING PERFORMANCE SINCE IPO¹
                 400
                                                                                                               MIT UNIT PRICE
                                                                                                                   +211.8%
                 350

                 300

                 250

                 200
                                                                                                              FTSE ST REITS INDEX
                                                                                                                    +26.8%
                 150

                 100

                  50                                                                                    FTSE STRAITS TIMES INDEX
                                                                                                                 -2.9%

                   0
                   Oct 10    Oct 11     Oct 12    Oct 13      Oct 14    Oct 15   Oct 16   Oct 17     Oct 18      Oct 19   Oct 20

                         Rebased MIT Unit Price            Rebased FTSE ST REITS Index        Rebased FTSE Straits Times Index

   MIT’s Return on                                                          Capital                Distribution                      Total
   Investment                                                          Appreciation                       Yield                     Return
   Listing on 21 Oct 2010 to 23 Aug 2021                                     211.8%²                   124.8%³                      336.6%4
   ¹ Rebased MIT’s issue price of S$0.930 and opening unit prices of FTSE ST REITs Index and FTSE Straits Times Index on
     21 Oct 2010 to 100. Source: Bloomberg.
   ² Based on MIT’s closing unit price of S$2.900 on 23 Aug 2021.
   ³ MIT’s distribution yield is based on DPU of S$1.160 over the issue price of S$0.930.
15 ⁴ Sum of distributions and capital appreciation for the period over the issue price of S$0.930.
86 Properties in Singapore

Total                         WALE        Weighted Average Unexpired          Occupancy
NLA                           (By GRI)1   Lease Term of Underlying Land1      Rate2

15.9m sq ft 2.8 years                     35.0 years                          93.4%

                                                                           Data Centres
                                                                           Hi-Tech Buildings
                                                                           Flatted Factories
                                                                           Business Park Buildings
                                                                           Stack-up/Ramp-up Buildings
                                                                           Light Industrial Buildings
     1   As at 30 Jun 2021.
     2   For 1QFY21/22.
16
28 Data Centres Across North America

Total                                       WALE                                 Weighted Average Unexpired                                        Occupancy
NLA1                                        (By GRI)2                            Lease Term of Underlying Land3                                    Rate4

5.0m sq ft                                  6.0 years                            Freehold                                                          97.8%

                                                                                                                  Ontario
                                                                                                                       1
                                                                                        Wisconsin
                                                                                              1

                                                                                                              1
                                                                                                     Michigan                                  1   Massachusetts
                                                                                                                       Pennsylvania
                                                                                                                                         1
                                                                                                                            1
                                                                                                                                     New Jersey
                                                               2

                                                            Denver                                                              7   Virginia
                                   1

                            California                                                                    1                 2       North Carolina
                                                                                                    Tennessee
                                                        1
                                                Arizona                                                            4
                                                                            4
                                                                                                           Georgia
                                                                        Texas
     MIT’s 28 Data Centres in North America
     *Number of data centres indicated in the circles

     1   Excluded the parking decks (150 Carnegie Way and 171 Carnegie Way) at 180 Peachtree, Atlanta.
     2   As at 30 Jun 2021.
     3   All properties are sited on freehold land, except for the parking deck (150 Carnegie Way) at 180 Peachtree, Atlanta and 2055 East Technology Circle, Phoenix.
17   4   For 1QFY21/22.
Reputable Sponsor with Aligned Interest
About the Sponsor, Mapletree Investments
      Leading real estate development, investment, capital and property management company
      As at 31 Mar 2021, the Sponsor owns and manages S$66.3 billion of assets across Asia Pacific,
       Europe, the United Kingdom and North America, of which S$13.8 billion is located in North America
      Right of first refusal to MIT over future sale of 50% interest in Mapletree Rosewood Data Centre Trust
       (“MRODCT”)

18
PORTFOLIO
              UPDATE

Hi-Tech Buildings, build-to-suit project for HP
Portfolio Overview
                                                                       Singapore                     North American                                      Overall
                                                                        Portfolio                           Portfolio                                   Portfolio

         Number of properties                                                       86                                      28                                    114

         NLA (million sq ft)                                                     15.9                                    5.01                                  20.91
         Occupancy (%)
          1QFY21/22                                                              93.4                                    97.8                                  94.32
          4QFY20/21                                                              92.9                                    97.6                                  93.72

SEGMENTAL OCCUPANCY RATES1

     98.2%2 98.3%2            98.5% 99.0%                                                              96.7% 96.9%                                     93.7%2 94.3%2
                                                                               89.9% 91.0%
                                                       84.2% 83.6%                                                             80.4% 78.7%

         Data Centres       Hi-Tech Buildings         Business Park          Flatted Factories Stack-up/Ramp-up               Light Industrial            Overall
                                                        Buildings                                  Buildings                     Buildings                Portfolio

                                                 Left Bar (4QFY20/21)                                Right Bar (1QFY21/22)

     1    Excludes the parking decks (150 Carnegie Way and 171 Carnegie Way) at 180 Peachtree.
     2    Based on MIT’s 50% interest of the joint venture w ith MIPL in three fully fitted hyperscale data centres and 10 pow ered shell data centres in North America
          through MRODCT.
20
Lease Expiry Profile

 EXPIRING LEASES BY GROSS RENTAL INCOME1
 As at 30 June 2021

     WALE based on date of commencement of leases (years)2

     Singapore Portfolio                                                      2.8

     North American Portfolio                                                 6.0

     Overall Portfolio1                                                       3.7

                                                                                                                                     29.3%
                                                            25.7%

                                   19.4%

           10.6%                                                                     9.0%
                                                                                                              6.0%

           FY21/22                 FY22/23                 FY23/24                  FY24/25                 FY25/26            FY26/27 & Beyond

      Data Centres (Singapore)              Data Centres (North America)         Hi-Tech Buildings                     Business Park Buildings
      Flatted Factories                     Stack-up / Ramp-up Buildings         Light Industrial Buildings

     1   Based on MIT’s 50% interest of the joint venture with MIPL in three fully fitted hyperscale data centres and 10 powered shell data centres in
         North America through MRODCT.
     2
         Refers to leases which commenced prior to and on 30 Jun 2021.
21
Large and Diversified Tenant Base

 TOP 10 TENANTS BY GROSS RENTAL INCOME1
 As at 30 June 2021
          7.4%
                                                 Over 2,000 tenants
                          6.3%
                                                 Largest tenant contributes 7.4% of Portfolio’s Gross Rental Income
                                                 Top 10 tenants forms about 32.1% of Portfolio’s Gross Rental Income

                                                                                                          Hi-Tech Buildings     Data Centres

                                         3.6%
                                                        3.1%
                                                                       2.9%

                                                                                      2.3%            2.1%
                                                                                                                     1.5%           1.5%           1.4%

                                    Global Social                    Global                                                      Fortune 25
                                       Media                       Colocation                                                    Investment
                                     Company2                       Provider2                                                   Grade-Rated
                                                                                                                                 Company2
     1   Based on MIT’s 50% interest of the joint venture with MIPL in three fully fitted hyperscale data centres and 10 powered shell data centres in
         North America through MRODCT.
     2   The identities of the tenants cannot be disclosed due to the strict confidentiality obligations under the lease agreements.
22
Tenant Diversification Across Trade Sectors1
                  No single trade sector accounted >17% of Portfolio’s Gross Rental Income

     By Gross Rental Income
     As at 30 Jun 2021
     1
         Based on MIT’s 50% interest of the joint venture with MIPL in three fully fitted hyperscale data centres and 10 powered shell data centres in
23       North America through MRODCT.
Singapore Portfolio Performance
Occupancy                                                                                                                                            Gross Rental Rate
                                                                                                                                                        S$ psf/mth
100%                                                                                                                                                             $2.50
                                                                                                                                                                  92.9% 93.4%
                                                                                                                                                          92.2%
                                                                                                                                                  91.5%
                                                                                                                90.5% 90.2% 90.5% 90.7% 90.2%

90%

                                                                                                                              $2.12                                       $2.13
                                                                                                                      $2.10           $2.11
                                                                                                              $2.10

80%
                                                                                                                                                          $2.11
                                                                                                                                          $2.08

                                                                                                                                                  $2.03
                                                                                                                                                                  $2.05           $2.00
70%

60%

50%                                                                                                                                                                               $1.50

40%

30%
                                                                                                                                                                                  $1.00
20%

10%

 0%                                                                                                                                                                               $0.50
        3Q 4Q 1Q 2Q 3Q 4Q 1Q 2Q 3Q 4Q 1Q 2Q 3Q 4Q 1Q 2Q 3Q 4Q 1Q 2Q 3Q 4Q 1Q 2Q 3Q 4Q 1Q 2Q 3Q 4Q 1Q 2Q 3Q 4Q 1Q 2Q 3Q 4Q 1Q 2Q 3Q 4Q 1Q
       FY10/11   FY11/12    FY12/13     FY13/14     FY14/15     FY15/16     FY16/17     FY17/18     FY18/19           FY19/20                 FY20/21 FY21/22

   24                                                 Occupancy (LHS)        Rental Rate (RHS)
Rental Revisions (Singapore)

    GROSS RENTAL RATE (S$ PSF/MTH) 1
    For Period 1QFY21/22
                                                                                                                                      Before Renewal
                                                                                                                                      After Renewal
                                                  $3.69 $3.43        $3.75                                                            New Leases

                                                           $3.59
                                                                                                                                      Passing Rent
                           $3.18 $2.60

                   $1.90 $1.91                                                      $1.94 $1.91
                                                                                                   $1.69
                                                                                                                  $1.38 $1.38 $1.50   $1.42 $1.42
                                                                                           $1.76
                                                                                                                                            $1.44
                                                                                                                        $1.27

                  Hi-Tech Buildings                 Business Park                  Flatted Factories              Stack-Up/Ramp-Up    Light Industrial
                                                      Buildings                                                        Buildings         Buildings

Renewal                 6 Leases                      16 Leases                      75 Leases                       5 Leases          2 Leases
Leases                (13,627 sq ft)                 (62,062 sq ft)                (181,455 sq ft)                 (49,342 sq ft)     (9,715 sq ft)
New                     7 Leases                       4 Leases                      68 Leases                       2 Leases
                                                                                                                                          N.A.2
Leases                (18,762 sq ft)                  (9,641 sq ft)                (147,312 sq ft)                 (12,120 sq ft)
1   Gross Rental Rate figures exclude short term leases; except Passing Rent figures w hich include all leases.
2   Not applicable as there w ere no new leases secured in the quarter.

25
Healthy Tenant Retention (Singapore)

 LONG STAYING TENANTS                                            RETENTION RATE FOR 1QFY21/22

                             Up to 1 yr
                              10.8%
                                                                                                                 100.0%
 >10 yrs
  32.3%                                                                                  88.3%
                                            >1 to 2 yrs                                                                                     81.8%
                                               8.1%                                                  78.2%
                                                                             68.1%
                           4 yrs or
                             less
               More than    36.1%                 > 2 to 3 yrs                                                                47.5%
                 4 yrs                               11.1%
                63.9%

                                                >3 to 4 yrs
                                                   6.1%            N.A.
                                                                     Data    Hi-Tech     Business     Flatted    Stack-up /     Light      Singapore
>5 to 10 yrs                            >4 to 5 yrs                Centres   Buildings     Park      Factories   Ramp-up      Industrial    Portfolio
   24.7%                                   6.9%                  (Singapore)             Buildings               Buildings    Buildings

                                      As at 30 Jun 2021            Based on NLA.
                                      By number of tenants.        Not applicable for Data Centres (Singapore) as there were no leases
                                                                   due for renewal.

  63.9% of the tenants have leased the properties for more than 4 years
  Tenant retention rate of 81.8% in 1QFY21/22
 26
Acquisition - 8011 Villa Park Drive
     Acquisition                              Acquisition of a data centre located in Virginia, the United States

     Address

                                              8011 Villa Park Drive, Richmond, Virginia

     Tenant                                   The Bank of America Corporation

     Land Area                                About 2.0 million sq ft

     Net Lettable Area                        701,321 sq ft

                                                   Fully leased on a triple net basis with balance lease term of more than five years
                                                   Initial lease term expiring on 10 Jun 2022 with three 5-year renewal options 1
     Lease Term
                                                   Zero base rent from 13 Mar 2021 to 10 Jun 2022
                                                   Rent to commence after 10 Jun 2022

     Finalisation of
                                              US$220.9 million (approximately S$300.4 million3)
     Purchase Consideration2

     Completed                                12 Mar 2021 (Eastern Standard Time)

     1   The Bank of America Corporation has renew ed the first of three additional terms of five years.
     2   Refer to purchase consideration after the extension term base rent to be paid by the tenant w as finalised on 19 Jul 2021.
27   3   Unless otherw ise stated, an illustrative exchange rate of US$1.00 to S$1.36 is used in this presentation.
Divestment – 26A Ayer Rajah Crescent
 Sale Price                                                                   GFA                                            Completed

 S$125.0 million                                                        384,802 sq ft                                         25 Jun 2021

                                                                          Exercise of option to purchase 26A Ayer Rajah
                                                                           Crescent by Equinix Singapore1
                                                                          Seven-storey data centre developed by MIT for
                                                                           Equinix in Jan 2015
                                                                          30-year land lease commenced on 22 May 2013
                                                                          Contributed about 2.0% to MIT’s portfolio gross
                                                                           revenue in FY20/21
                                                                          Sale Price is in line with valuation of S$125.0 million2
                                                                          Net divestment gains of S$15.7 million will be
                                                                           distributed over eight quarters from 2QFY21/22
 26A Ayer Rajah Crescent

     1   Refers to the exercise of option to purchase 26A Ayer Rajah Crescent w ithin the Lease Agreement betw een MIT and Equinix dated 1 Mar 2015. 26A Ayer Rajah
         Crescent is the only property in MIT’s portfolio w ith such option to purchase being granted to the tenant.
     2   Based on the annual valuation as at 31 Mar 2020 being the FY19/20 year-end valuation prior to the sale and purchase agreement entered into on 14 Aug 2020.
28
FY20/21 Sustainability Progress
     Environmental                    Social                     Governance

     First foray into renewable
                                       S$12.7 million
     energy at two MIT’s
                                       rental reliefs in
     properties with generating
                                       FY20/21
     capacity of 848.8 kWp
                                                                  Inaugural submission
                                                                 to GRESB Real Estate
                                                                   Assessment 2021
     Secured inaugural                 Donated over 2
     S$300.0 million                   million disposable
     sustainability-linked facility    medical masks
                                                                Framework Alignment

     11.5% reduction in                65% of employees
     average building electricity      received trainings
     intensity from FY19/20            relating to ESG topics

                                       ‘Pack a Bag’ CSR           Please refer to Sustainability
     16.3% reduction in
                                       initiative raised          Report 2020/2021 for details
     average building water                                       on MIT’s sustainability
                                       S$7,350 for 71
     intensity from FY19/20                                       performance.
                                       beneficiaries

29
1QFY21/22
                                              FINANCIAL HIGHLIGHTS

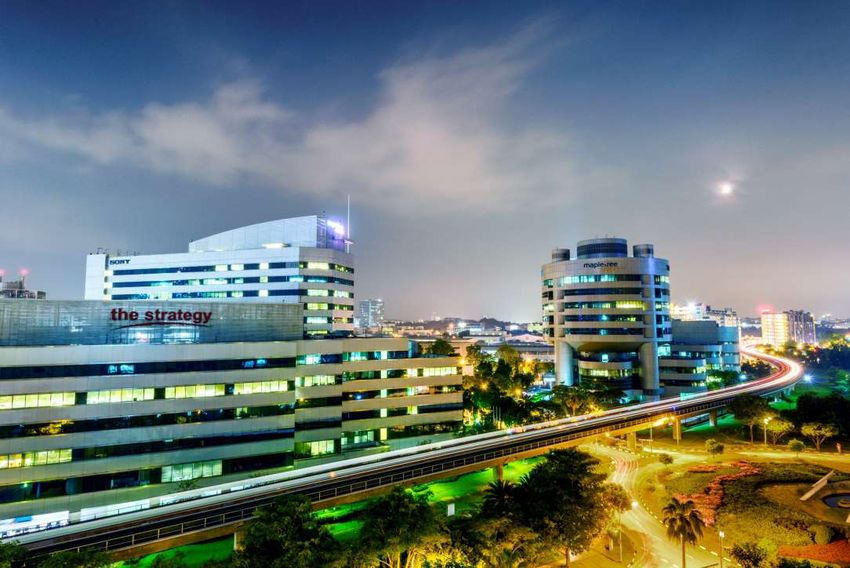
Business Park Buildings, The Strategy and The Synergy
Statement of Profit or Loss (Year-on-Year)
                                                                                        1QFY21/22                 1QFY20/21
                                                                                                                                                   / ()
                                                                                          (S$’000)                  (S$’000)
     Gross revenue                                                                          128,059                    99,106                      29.2%
     Property operating expenses                                                            (23,340)                  (20,454)                     14.1%
     Net property income                                                                    104,719                    78,652                      33.1%
     Borrowing costs                                                                        (15,238)                  (10,568)                     44.2%
     Trust expenses                                                                         (12,436)                   (9,337)                    33.2%
     Share of joint ventures’ results 1                                                         8,980                   13,748                   (34.7%)
     Profit before income tax                                                                 86,025                    72,495                     18.7%
     Income tax expense                                                                       (1,414)                            -                          *
     Profit for the period                                                                     84,611                   72,495                     16.7%
     Profit attributable to perpetual securities holders                                       1,295                           -                            *
     Profit attributable to Unitholders                                                       83,316                    72,495                    14.9%
     Net non-tax deductible items                                                             (7,248)                  (11,384)                  (36.3%)
     Distributions declared by joint ventures                                                   6,628                     9,447                  (29.8%)
     Amount available for distribution to Unitholders                                         82,696                    70,558                     17.2%
     Distribution per Unit (cents)                                                               3.35                     2.872                   16.7%
     * Not meaningful
     1   Share of joint ventures’ results relates to MIT’s equity interest in the joint ventures with MIPL. The results of the joint ventures were equity
         accounted at the Group level. With effect from 1 Sep 2020, upon completion of the acquisition of the remaining 60% interest, financial results
         of the 14 data centres in the United States of America previously held under Mapletree Redwood Data Centre Trust had been consolidated.
     2
         Excludes tax-exempt income withheld amounting to S$7.1 million.

31
Statement of Profit or Loss (Qtr-on-Qtr)
                                                                                        1QFY21/22                4QFY20/21
                                                                                                                                                 / ()
                                                                                          (S$’000)                 (S$’000)
     Gross revenue                                                                          128,059                  121,062                      5.8%
     Property operating expenses                                                           (23,340)                 (29,254)                   (20.2%)
     Net property income                                                                    104,719                   91,808                     14.1%
     Borrowing costs                                                                        (15,238)                 (14,797)                     3.0%
     Trust expenses                                                                         (12,436)                 (12,237)                     1.6%
     Net fair value loss on investment properties and
                                                                                                     -               (87,083)                            *
     investment property under development
     Share of joint venture’s results 1                                                        8,980                    9,204                   (2.4%)
     Profit /(loss) before income tax                                                         86,025                 (13,105)                            *
     Income tax expense                                                                      (1,414)                 (32,697)                  (95.7%)
     Profit /(loss) for the period                                                            84,611                 (45,802)                            *
     Profit attributable to perpetual securities holders                                       1,295                          -                          *
     Profit/(loss) attributable to Unitholders                                               83,316                  (45,802)                            *
     Net non-tax deductible items                                                            (7,248)                 110,426                             *
     Distribution declared by joint venture                                                    6,628                    6,124                     8.2%
     Amount available for distribution to Unitholders                                        82,696                    70,748                    16.9%
     Distribution per Unit (cents)                                                              3.35                    3.302                     1.5%
     * Not meaningful
     1   Share of joint venture’s results relates to MIT’s equity interest in the joint venture with MIPL. The results of the joint venture was equity
         accounted at the Group level.

     2   Includes tax-exempt income amounting to S$7.1 million, which was previously withheld in 1QFY20/21 and subsequently distributed in
32       4QFY20/21.
Statement of Financial Position

                                                                                         30 Jun 2021           31 Mar 2021                  / ()

     Total assets (S$’000)                                                                  6,990,532              6,391,619                9.4%
     Total liabilities (S$’000)                                                             2,040,045              2,496,619              (18.3%)
     Net assets attributable to Unitholders (S$’000)                                        4,651,040              3,895,000               19.4%

     Net asset value per Unit (S$)1                                                                  1.75                  1.66             5.4%

     1   Net tangible asset per Unit was the same as net asset value per Unit as there were no intangible assets as at reporting dates.

33
Strong Balance Sheet

                                                                30 Jun 2021                                    31 Mar 2021

     Total debt (MIT Group)                                 S$1,787.2 million                               S$2,245.2 million

     Weighted average tenor of debt                               2.8 years                                       3.6 years

     Aggregate leverage ratio1                                      31.0%                                           40.3%

     Strong balance sheet to pursue growth opportunities

      ‘BBB+’ rating with Stable Outlook by Fitch Ratings

      100% of loans unsecured with minimal covenants

      Raised S$300 million from issuance of perpetual securities and about S$823.3 million
       from equity fund raising exercise

      US Portfolio Acquisition funded by debt and proceeds from equity fund raising
       exercise in Jun 2021
 1
      In accordance with Property Funds Guidelines, the aggregate leverage ratio includes proportionate share of aggregate leverage as well as
      deposited property values of joint venture. As at 30 Jun 2021, aggregate leverage including MIT’s proportionate share of joint venture is
      S$2,334.0 million.
34
Well Diversified Debt Maturity Profile
 DEBT MATURITY PROFILE
 As at 30 June 2021

       20.4%      21.0%                 21.4%

                              15.5%               14.7%

                              101.9
                  330.9
       364.7                            382.4
                                                  202.3                            7.0%

                              175.0
                                                                                   125.0
                   45.0                            60.0

      FY21/22    FY22/23     FY23/24   FY24/25   FY25/26     FY26/27    FY27/28   FY28/29
                              MTN                          Bank Loans
     Amounts in S$ million

                             Weighted Average Tenor of Debt = 2.8 years

35
Risk Management

                                                                30 Jun 2021       31 Mar 2021

     Fixed as a % of total debt                                     95.8%           76.8%

     Weighted average hedge tenor                                 2.8 years        3.0 years

     Weighted average all-in funding
                                                                     2.7%            2.8%
     cost for the quarter
     Interest coverage ratio (“ICR”)
                                                                  6.8 times        6.0 times
     for the quarter

     ICR for the trailing 12 months1                              6.3 times        6.4 times

     Adjusted ICR for the trailing 12
                                                                  6.1 times        6.4 times
     months1

      High ratio of fixed rate debt to total debt due to repayment of unhedged debt

 1
      Calculated in accordance with Property Funds Guidelines dated 16 Apr 2020

36
OUTLOOK AND
Data Centres, 7337 Trade Street,
San Diego
                                      STRATEGY
Singapore Industrial Property Market
DEMAND AND SUPPLY FOR MULTI-USER FACTORIES                  DEMAND AND SUPPLY FOR BUSINESS PARKS

 Total stock for factory and business park space: 39.2 million sq m
 Potential net new supply of 1.8 million sq m in 20211, of which
     •      Multi-user factory space accounts for 0.6 million sq m
     •      Business park space accounts for 0.2 million sq m
     •      Moderation in quantum of industrial land released through Industrial Government Land Sales
            Programme since 2013
 Median rents for industrial real estate for 2Q20211
     •      Multi-user Factory Space: S$1.77 psf/mth (1.7% q-o-q)
     •      Business Park Space: S$4.20 psf/mth (0.0% q-o-q)

38   1   JTC J-Space, 22 Jul 2021
Outlook
Singapore

 Challenging operating environment in view of uncertainty over trajectory of
  economic recovery from COVID-19 pandemic
     • Singapore economy expanded by 14.7% y-o-y in the quarter ended 30 Jun 2021, faster
       than the 1.5% growth in the preceding quarter1
     • While business sentiments have remained expansionary for the second consecutive
       quarter in 3Q2021, the changes were limited to the financial services, manufacturing
       and services sectors2

 Impact on Singapore Portfolio
     • As at 30 Jun 2021, rental arrears of more than one month was about 1.1% of previous
       12 months’ gross revenue. This was an improvement from 1.2% as at 31 Mar 2021

      1   Source: Ministry of Trade and Industry, 11 Aug 2021.
39    2
          Source: Singapore Commercial Credit Bureau, 3Q2021.
Outlook
North America

 Resilient asset class with growth opportunities
     • According to 451 Research3, North America is the world’s second largest data centre
       region, which accounted for about 30.5% of the global insourced and outsourced data
       centre space (by net operational sq ft)
     • Leased data centre supply (by net operational sq ft) and demand (by net utilised sq ft)
       are expected to grow at a compound annual growth rate of 7% and 8% respectively
       between 2019 and 2025F
     • The pandemic has boosted data centre demand in the short and, potentially, long term.
       451 Research also expected more demand for edge infrastructure and sustainable data
       centres as environmental concerns become more important to local governments and
       end users

      3   Source: North American Data Centre Market Overview , 451 Research/S&P Global Market Intelligence, 2021.

40
Diversified and Resilient

                                      Anchored by large and diversified tenant base with low dependence
    Stable and
                                       on any single tenant or trade sector
 Resilient Portfolio
                                      Focus on tenant retention to maintain a stable portfolio occupancy

           Enhanced
                                      More than S$900 million of committed facilities available
           Financial
                                      Healthy interest coverage ratio of 6.1 times 1
           Flexibility

                                      Completed US$1.32 billion acquisition of 29 data centres located in
       Growth by
                                       the United States
     Acquisitions and
                                      Redevelopment at 161, 163 & 165 Kallang Way to be slated for full
      Developments
                                       completion in 1H2023

       1    Refers to adjusted interest coverage ratio for the trailing 12 months.
41
End of Presentation
For enquiries, please contact Ms Melissa Tan, Director, Investor Relations,
DID: (65) 6377 6113, Email: melissa.tanhl@mapletree.com.sg
You can also read