Investor Presentation May 2021 - Mapletree Industrial Trust

Page created by Melvin Swanson
 
CONTINUE READING
Investor Presentation May 2021 - Mapletree Industrial Trust
Investor Presentation
May 2021
Investor Presentation May 2021 - Mapletree Industrial Trust
Important Notice
This presentation shall be read in conjunction with Mapletree Industrial Trust’s (“MIT”) financial results for Fourth Quarter
Financial Year 2020/2021 in the SGXNET announcement dated 29 April 2021.

This presentation is for information only and does not constitute an offer or solicitation of an offer to sell or invitation to
subscribe for or acquire any units in Mapletree Industrial Trust (“Units”).

The past performance of the Units and MIT is not indicative of the future performance of MIT or Mapletree Industrial Trust
Management Ltd. (the “Manager”).

The value of Units and the income from them may rise or fall. Units are not obligations of, deposits in or guaranteed by the
Manager or any of its affiliates. An investment in Units is subject to investment risks, including the possible loss of the
principal amount invested. Investors have no right to request the Manager to redeem their Units while the Units are listed. It is
intended that unitholders may only deal in their Units through trading on the Singapore Exchange Securities Trading Limited
(“SGX-ST”). Listing of the Units on the SGX-ST does not guarantee a liquid market for the Units.

This presentation may also contain forward-looking statements that involve risks and uncertainties. Actual future
performance, outcomes and results may differ materially from those expressed in forward-looking statements as a result of
risks, uncertainties and assumptions. Representative examples of these factors include general industry and economic
conditions, interest rate trends, cost of capital, occupancy rate, construction and development risks, changes in operating
expenses (including employees wages, benefits and training costs), governmental and public policy changes and the
continued availability of financing. You are cautioned not to place undue reliance on these forward-looking statements, which
are based on current view of management on future events.

Nothing in this presentation should be construed as financial, investment, business, legal or tax advice and you should
consult your own independent professional advisors.

2
Investor Presentation May 2021 - Mapletree Industrial Trust
Contents

    01   Key Highlights
    02   Overview of Mapletree Industrial Trust
    03   Portfolio Update
    04   4Q & FY20/21 Financial Highlights
    05   Outlook and Strategy

3
Investor Presentation May 2021 - Mapletree Industrial Trust
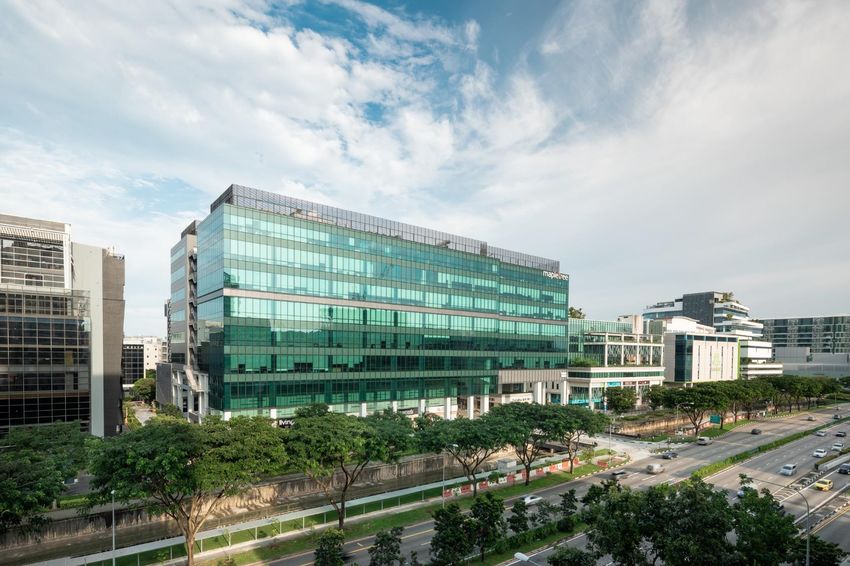
KEY HIGHLIGHTS

Data Centres, 44490 Chilum Place (ACC2), Northern Virginia
Investor Presentation May 2021 - Mapletree Industrial Trust
115 Properties Across 6 Property Segments
S$6.8 billion1                                                    21.3 million2                                                      >2,000 tenants
AUM                                                               NLA (sq ft)                                                        Tenant Base

                                 Light Industrial
                                    Buildings
                                      1.0%                                   Data Centres: 41.2%
                   Stack-up/Ramp-up                                          Singapore: 6.2%
                       Buildings                                             North America: 35.0%
                         7.2%

                                                                                                                                   Data Centres                         Flatted Factories
     Flatted
    Factories
     21.7%
                                  AUM1
                               S$6.8 billion
Business Park                                                                                                                                                       Stack-up/Ramp-up
  Buildings                                                                                                                   Hi-Tech Buildings                              Buildings
    8.5%

                Hi-Tech Buildings
                     20.4%

    Portfolio value by geography
    Singapore                                                                                    65.0%
                                                                                                                   Business Park Buildings                  Light Industrial Buildings
    North America                                                                                35.0%

      1   Based on MIT’s book value of investment properties as well as MIT’s interest of the joint venture with Mapletree Investments Pte Ltd (“MIPL”) in three fully fitted hyperscale
          data centres and 10 powered shell data centres in North America and included MIT’s right of use assets of S$26.3 million as at 31 Mar 2021.
5     2   Excludes the parking decks (150 Carnegie Way and 171 Carnegie Way) at 180 Peachtree.
Investor Presentation May 2021 - Mapletree Industrial Trust
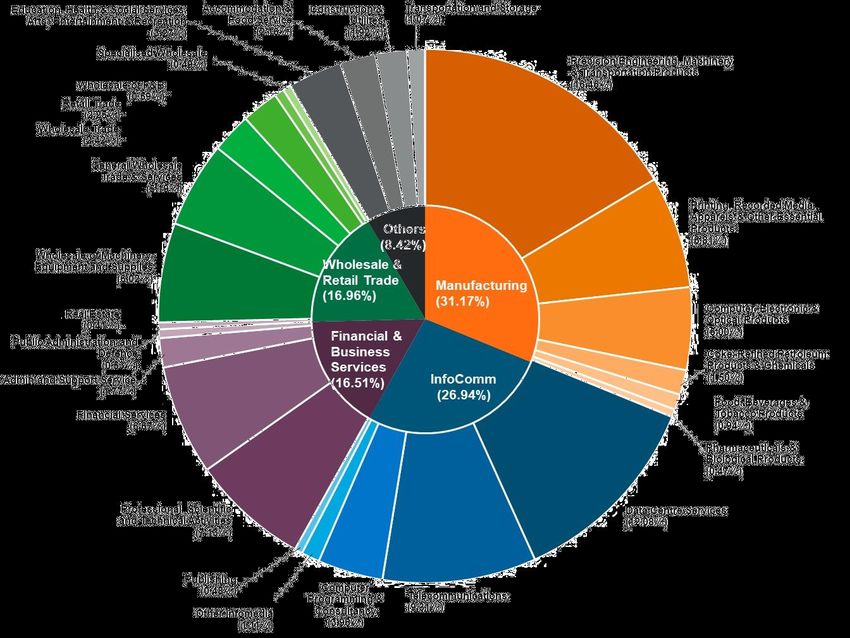
Sustainable and Growing Returns
   Distributable Income                                                                                                                                                                   DPU
        (S$ million)                                                                                                                                                                     (cents)

   100                                                                                                                                                                                3.30   3.50
                                                                                                                                                                               3.28
                                                                                                                                                            3.133.16
                                                                                                                                                3.073.083.10
     90                                                                                                                     3.00
                                                                                                                                    2.95
                                                                                                                                        3.003.01                         3.10
                                                                                                        2.85        2.882.92    2.88                                2.85
                                                                                                                                                                        2.87                 3.00
                                                                                            2.792.822.81    2.832.83                                                             81.1
                                                                                        2.73
     80                                                                         2.672.65
                                                                            2.60
                                                            2.472.512.512.51                                                                                                 72.9
                                                        2.43                                                                                                             70.6        70.7
                                                    2.37                                                                                                       69.4 69.2                     2.50
     70                                 2.262.292.32
                                    2.22
                                2.16                                                                                                                   63.263.5
                            2.05                                                                                                                    59.9
                        1.98                                                                                                                    58.3
     60             1.93                                                                                                            55.5
                                                                                                                                        56.956.7
                                                                                                                            54.053.5                                                         2.00
                                                                                                                    51.852.9
                                                                                                50.350.451.550.651.1
                                                                                        48.248.9
     50                                                                     45.446.046.7
                1.52
                                                                42.242.642.8
                                                            41.1
                                                    38.940.2                                                                                                                                 1.50
     40                                 36.937.537.7
                                35.235.8
                            31.6
                    28.329.0
     30                                                                                                                                                                                      1.00
                22.3

     20
                                                                                                                                                                                             0.50
     10

        0                                                                                                                                                                                    0.00
                3Q¹ 4Q 1Q 2Q 3Q 4Q 1Q 2Q 3Q 4Q 1Q 2Q 3Q 4Q 1Q 2Q 3Q 4Q 1Q 2Q 3Q 4Q 1Q 2Q 3Q 4Q 1Q 2Q 3Q 4Q 1Q 2Q 3Q 4Q 1Q 2Q 3Q 4Q 1Q 2Q 3Q 4Q
                FY10/11     FY11/12         FY12/13         FY13/14         FY14/15         FY15/16         FY16/17         FY17/18         FY18/19         FY19/20         FY20/21

DPU
                 3.45        8.41            9.24            9.92 Distributable
                                                                         10.43 Income
                                                                                   11.15        11.39
                                                                                       (S$ million)                          11.75
                                                                                                                             DPU (cents)12.16                12.24           12.55
(cents)

            1     MIT was listed on 21 Oct 2010.
    6
Investor Presentation May 2021 - Mapletree Industrial Trust
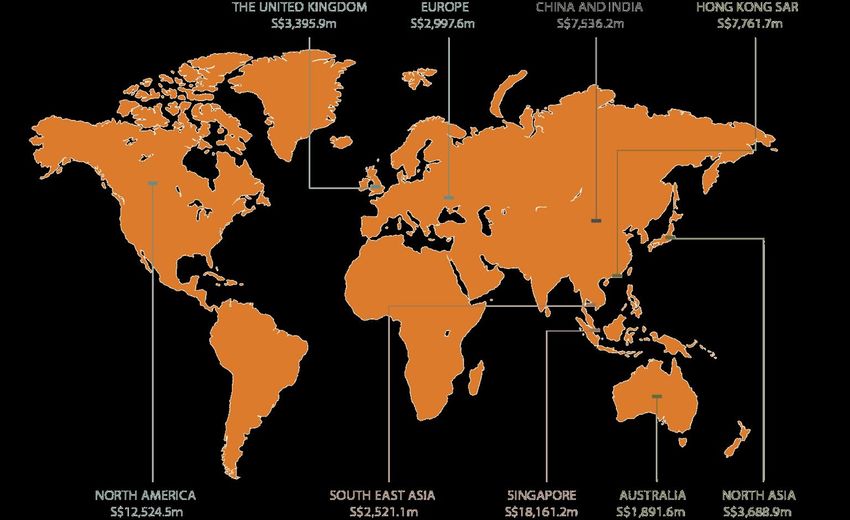
Portfolio Growth since IPO
                                                                                                                                                            FY20/21
 3 Asset Enhancement                                                                                                                                         S$6.8b

   Initiatives (“AEI”)
 5 Build-to-Suit (“BTS”)
                                                                                                                                              FY19/20
                                                                                                                                               S$5.9b
   Projects
 8 Acquisitions                                                                                                                    FY18/19
                                                                                                                                   S$4.8b
                                                                                                                     FY17/18
                                                                                                                     S$4.3b
                                                                                                        FY16/17
                                                                                           FY15/16      S$3.7b                                             Acquisition
                                                                      FY14/15                                                                                Remaining
                                                                                           S$3.6b
                                                    FY13/14           S$3.4b                                                                                60% interest
                                 FY12/13            S$3.2b                                                                                                 in 14 US DCs
                                 S$2.9b                                                                                                                     US$494m
             FY11/12
             S$2.7b
FY10/11                                                                                                                                                   Acquisition
                                                                          Acquisition                   BTS                    Acquisition                    DC in
                                              AEI
S$2.2b1                                                                    2A Changi                   1 & 1A
                                                                                                                              Upgraded                       Virginia
                                          Woodlands
                                                                                                                           7 Tai Seng Drive
                                           Central                        North Street 2             Depot Close                                           US$208m
                                                                                                                               to a DC
                                           S$30m                              S$12m                   S$226m
                                                                                                                                 S$95m

                                               BTS                             BTS                   Acquisition                  BTS                    BTS
           Acquisition                                                       26A Ayer
                                         K&S Corporate                                                40% interest           Mapletree                   Kolam
            11 Flatted
                                         Headquarters                         Rajah                  in14 US DCs²          Sunview Drive 1               Ayer 2
            Factories
                                             S$50m                           Crescent                 US$300m                    S$76m                  S$300m
            S$400m                                                           S$101m

  FY10/11          FY11/12           FY12/13AEI         FY13/14           FY14/15          FY15/16      FY16/17
                                                                                                         AEI         FY17/18 Acquisition
                                                                                                                                 FY18/19       FY19/20Acquisition
                                                                                                                                                            FY20/21
                                          Toa Payoh                                                   30A Kallang              18 Tai Seng            13 North
                                           North 1                                                      Place                   S$268m              American DCs3
                                            S$40m                                                       S$77m                                           US$684m
       1    Valuation of investment properties on 31 Mar at end of each financial year.
       2    Acquired through a 40:60 joint venture with MIPL.
  7    3    Acquired through a 50:50 joint venture with MIPL.
Investor Presentation May 2021 - Mapletree Industrial Trust
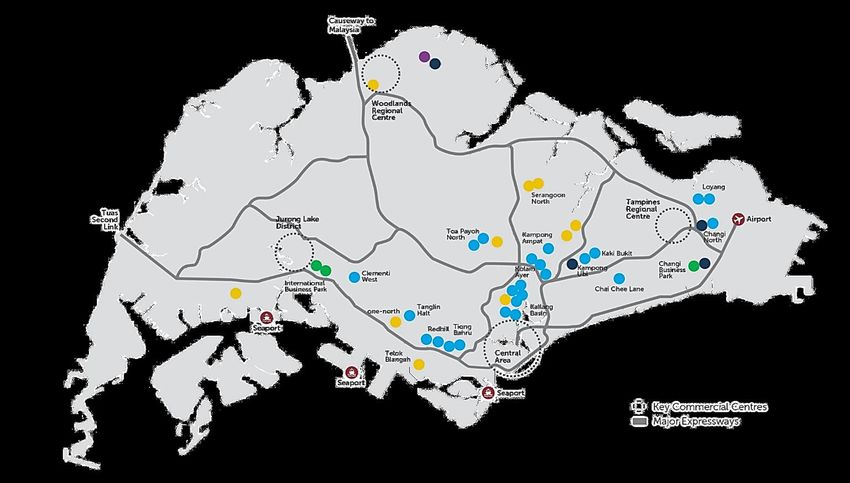
4QFY20/21 Highlights
 Growth underpinned by higher contribution from North American data centres but
  partly offset by rental reliefs and redevelopment of Kolam Ayer 2 Cluster
  • FY20/21 Distributable Income: S$295.3 million ( 11.3% y-o-y)
  • FY20/21 DPU: 12.55 cents ( 2.5% y-o-y)
  • 4QFY20/21 Distributable Income and DPU were S$70.7 million ( 2.3% y-o-y)
      and 3.30 cents ( 15.8% y-o-y)
  • 4QFY20/21 DPU included release of tax-exempt income amounting to S$7.1 million
      (equivalent to DPU of 0.30 cent) which was previously withheld

 Completed the acquisition of a data centre in Virginia, United States of America (the
  “United States”) on 12 Mar 2021

 Portfolio update
  • Average Overall Portfolio occupancy increased q-o-q from 93.1% to 93.7% in 4QFY20/21
  • Portfolio valuation of 115 properties increased 14.7% y-o-y to S$6,762.2 million

 Capital management update
  • Strong balance sheet with more than S$600 million of committed facilities available
  • Healthy interest coverage ratio of 6.4 times1 in 4QFY20/21
  • Successfully priced inaugural S$300 million perpetual securities at 3.15%
     on 3 May 2021

    1   Refers to the interest coverage ratio for the trailing 12 months.
8
Investor Presentation May 2021 - Mapletree Industrial Trust
Acquisition - 8011 Villa Park Drive
                                    Acquisition of a data centre and office located in the State of Virginia, the United States
    Acquisition
                                    (the “Property”)

    Address                         8011 Villa Park Drive, Richmond, Virginia

    Tenant                          Multinational company with strong credit standing (the “New Tenant”)

    Land Area                       About 2.0 million sq ft

    Net Lettable Area               About 700,000 sq ft

                                         Fully leased on a triple net basis with balance lease term of more than five years
                                         Initial lease term expiring on 10 Jun 2022 with three 5-year renewal options1
    Lease Term
                                         Zero base rent from 13 Mar 2021 to 10 Jun 2022
                                         Rent to commence after 10 Jun 2022

    Purchase
                                    US$207.8 million (approximately S$282.6 million3)
    Consideration2

    Completed                       12 Mar 2021 (Eastern Standard Time)

     1   The New Tenant has renewed the first of three additional terms of five years.
     2   Refers to the Purchase Consideration payable upon completion of the acquisition after taking into account the upfront discount of US$16.9 million
         (approximately S$23.0 million) (the “Upfront Discount”). In the absence of rental income from the Property from 13 Mar 2021 to 10 Jun 2022, the
         Vendor will provide the Upfront Discount on the Purchase Consideration based on the lower end of the range of the extension term base rent to be paid by
         the New Tenant.
     3   Unless otherwise stated, an illustrative exchange rate of US$1.00 to S$1.36 is used in this presentation.
9
Investor Presentation May 2021 - Mapletree Industrial Trust
Redevelopment – Kolam Ayer 2
  161, 163 & 165 Kallang Way1                                                                                                   GFA                   Plot Ratio

  Kolam Ayer 2 Cluster                    Two Flatted Factories and an amenity centre                                    506,720 sq ft                      1.5

                                               New Hi-Tech Buildings, including a
  After Redevelopment                                                                                                    865,600 sq ft                      2.5
                                           seven-storey BTS Facility for Anchor Tenant

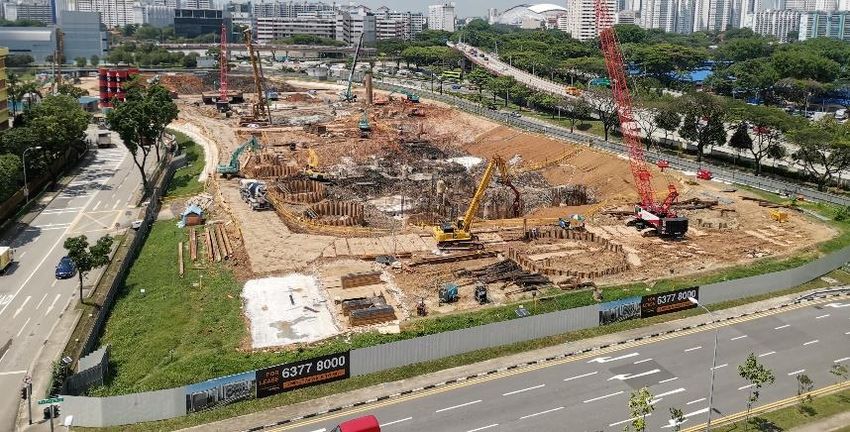
               Artist’s impression of MIT’s new high-tech industrial                  Piling and substructure works in progress
               precinct with BTS Facility on the left

    Redevelopment of Kolam Ayer 2 Flatted Factory Cluster into a new high-tech industrial precinct at total project cost
     of S$300 million2
    Secured pre-commitment from a global medical device company headquartered in Germany (the “Anchor Tenant”)
     for about 24.4% of enlarged GFA (~211,000 sq ft)
    BTS Facility is 100% committed by Anchor Tenant for lease term of 15 + 5 + 5 years3 with annual rental escalations
    Commenced construction for two industrial buildings in late Nov 2020; Construction contract of third industrial
     building to be awarded at a later date
    Completion in 2H2022
   1   Upon commencement of the redevelopment works in Jul 2020, the cluster was renamed after its new address (161, 163 & 165 Kallang Way).
   2   Includes the book value of the Kolam Ayer 2 Cluster at S$70.2 million as at 31 Mar 2019 prior to the commencement of the redevelopment.
10 3   Includes a rent-free period of 6 months distributed over the first six years. Anchor Tenant is responsible for all operating expense and property tax of the BTS Facility.
OVERVIEW OF
                          MAPLETREE INDUSTRIAL TRUST

Hi-Tech Building, 18 Tai Seng
Overview of Mapletree Industrial Trust
                           Mapletree Investments Pte Ltd                                          Public & Inst
                                                                                                                                  MIPL
Sponsor                    (“MIPL”)                                                               Unitholders

                                                                                                72.5%                                27.5%
                           Owns 27.5% of MIT                                                                                                 Trustee

                           Focused on (i) industrial real estate
                           assets in Singapore, excluding                                                                                    Manager
Investment
                           properties primarily used for logistics
mandate
                           purposes and (ii) data centres
                                                                                                                  MIT Portfolio              Property
                           worldwide beyond Singapore                                                                                        Manager

                           115 properties valued at S$6.8 billion1
Portfolio
                           21.3 million2 sq ft NLA

                           Mapletree Industrial Trust
Manager                    Management Ltd.
                           100% owned by the Sponsor
                           Mapletree Facilities Services
Property                   Pte. Ltd. and Mapletree US
Manager                    Management LLC
                           100% owned by the Sponsor

Trustee                    DBS Trustee Limited
     1   Based on MIT’s book value of investment properties as well as MIT’s interest of the
                                                                                                AUM by geography
         joint venture with MIPL in three fully fitted hyperscale data centres and 10 powered
         shell data centres in North America and included MIT’s right of use assets of S$26.3
                                                                                                Singapore                                        65.0%
         million as at 31 Mar 2021.
     2   Excludes the parking decks (150 Carnegie Way and 171 Carnegie Way) at 180
                                                                                                North America                                    35.0%
12       Peachtree.
Diverse Portfolio of 115 Properties

       DATA CENTRES                                         FLATTED FACTORIES
       Facilities used primarily for the storage and        High-rise multi-tenanted industrial buildings
       processing of data. These include core-and-shell     with basic common facilities used for light
       to fully-fitted facilities, which include building   manufacturing activities.
       fit-outs as well as mechanical and electrical
       systems.

       HI-TECH BUILDINGS                                    STACK-UP/RAMP-UP
                                                            BUILDINGS
       High specification industrial buildings with
       higher office content for tenants in technology      Stacked-up factory space with vehicular
       and knowledge-intensive sectors. Usually             access to upper floors. Multi-tenanted space
       fitted with air-conditioned lift lobbies and         suitable for manufacturing and assembly
       common areas.                                        activities.

       BUSINESS PARK BUILDINGS                              LIGHT INDUSTRIAL
                                                            BUILDINGS
       High-rise multi-tenanted buildings in specially
       designated “Business Park zones”. Serve as           Multi-storey developments usually
       regional headquarters for MNCs as well as            occupied by an anchor tenant for light
       spaces for R&D and knowledge-intensive               manufacturing activities.
       enterprises.

13
Healthy Returns since IPO

 COMPARATIVE TRADING PERFORMANCE SINCE IPO¹
                    400
                                                                                                                 MIT UNIT PRICE
                                                                                                                    +203.2%
                    350

                    300

                    250

                    200
                                                                                                                FTSE ST REITS INDEX
                                                                                                                      +26.7%
                    150

                    100

                     50                                                                                  FTSE STRAITS TIMES INDEX
                                                                                                                   0.0%

                      0
                      Oct 10    Oct 11     Oct 12    Oct 13   Oct 14     Oct 15   Oct 16    Oct 17     Oct 18      Oct 19    Oct 20

                            Rebased MIT Unit Price        Rebased FTSE ST REITS Index          Rebased FTSE Straits Times Index

     MIT’s Return on                                                        Capital               Distribution                          Total
     Investment                                                        Appreciation                      Yield                         Return
     Listing on 21 Oct 2010 to 4 May 2021                                   203.2%²                    121.2%³                        324.4%4

     ¹   Rebased MIT’s issue price of S$0.930 and opening unit prices of FTSE ST REITs Index and FTSE Straits Times Index on
         21 Oct 2010 to 100. Source: Bloomberg.
     ²   Based on MIT’s closing unit price of S$2.820 on 4 May 2021.
     ³   MIT’s distribution yield is based on DPU of S$1.127 over the issue price of S$0.930.
14   ⁴   Sum of distributions and capital appreciation for the period over the issue price of S$0.930.
87 Properties in Singapore

Total                           WALE        Weighted Average Unexpired          Occupancy
NLA                             (By GRI)1   Lease Term of Underlying Land1      Rate2

16.3m sq ft 3.1 years                       35.3 years                          92.9%

                                                                             Data Centres
                                                                             Hi-Tech Buildings
                                                                             Flatted Factories
                                                                             Business Park Buildings
                                                                             Stack-up/Ramp-up Buildings
                                                                             Light Industrial Buildings
     1   As at 31 March 2021.
     2   For 4QFY20/21.
15
28 Data Centres Across North America

Total                                        WALE                                 Weighted Average Unexpired                                       Occupancy
NLA1                                         (By GRI)2                            Lease Term of Underlying Land3                                   Rate4

5.0m sq ft                                   6.2 years                            Freehold                                                         97.6%

                                                                                                                  Ontario
                                                                                                                       1
                                                                                         Wisconsin
                                                                                               1

                                                                                                              1
                                                                                                      Michigan                                 1   Massachusetts
                                                                                                                       Pennsylvania
                                                                                                                                         1
                                                                                                                            1
                                                                                                                                     New Jersey
                                                                2

                                                             Denver                                                             7   Virginia
                                   1

                            California                                                                    1                 2       North Carolina
                                                                                                     Tennessee
                                                        1
                                                 Arizona                                                           4
                                                                             4
                                                                                                              Georgia
                                                                         Texas
     MIT’s 28 Data Centres in North America
     *Number of data centres indicated in the circles

     1    Excluded the parking decks (150 Carnegie Way and 171 Carnegie Way) at 180 Peachtree, Atlanta.
     2    As at 31 Mar 2021.
     3    All properties are sited on freehold land, except for the parking deck (150 Carnegie Way) at 180 Peachtree, Atlanta and 2055 East Technology Circle, Phoenix.
16   4    For 4QFY20/21.
Reputable Sponsor with Aligned Interest
About the Sponsor, Mapletree Investments
      Leading real estate development, investment, capital and property management company
      As at 31 Mar 2020, the Sponsor owns and manages S$60.5 billion of assets across Asia Pacific,
       Europe, the United Kingdom and North America, of which S$12.5 billion is located in North America
      Right of first refusal to MIT over future sale of 50% interest in Mapletree Rosewood Data Centre Trust
       (“MRODCT”)

17
PORTFOLIO
             UPDATE

Hi-Tech Buildings, build-to-suit project for HP
Portfolio Overview
                                                                      Singapore                     North American                                      Overall
                                                                       Portfolio                           Portfolio                                   Portfolio

         Number of properties                                                      87                                     28                                   115

         NLA (million sq ft)                                                    16.3                                    5.01                                 21.31

         Occupancy (%)
          4QFY20/21                                                             92.9                                   97.6                                  93.72
          3QFY20/21                                                             92.2                                   97.6                                  93.12

SEGMENTAL OCCUPANCY RATES1

     98.2%2 98.2%2            98.3% 98.5%
                                                                              89.7% 89.9%             92.9% 96.7%                                    93.1%2 93.7%2
                                                      85.9% 84.2%
                                                                                                                             80.4% 80.4%

         Data Centres       Hi-Tech Buildings         Business Park         Flatted Factories Stack-up/Ramp-up               Light Industrial           Overall
                                                        Buildings                                 Buildings                     Buildings               Portfolio

                                                Left Bar (3QFY20/21)²                              Right Bar (4QFY20/21)²

     1    Excludes the parking decks (150 Carnegie Way and 171 Carnegie Way) at 180 Peachtree.
     2    Based on MIT’s 50% interest of the joint venture with MIPL in three fully fitted hyperscale data centres and 10 powered shell data centres in North America
          through MRODCT.
19
Lease Expiry Profile

 EXPIRING LEASES BY GROSS RENTAL INCOME1
 As at 31 March 2021

     WALE based on date of commencement of leases (years)2

     Singapore Portfolio                                                     3.1

     North American Portfolio                                                6.2

     Overall Portfolio1                                                      4.0

                                                                                                                                       30.4%
                                                             24.7%

                                    18.2%
           14.8%

                                                                                       5.9%                     6.0%

           FY21/22                 FY22/23                  FY23/24                  FY24/25                 FY25/26           FY26/27 & Beyond

      Data Centres (Singapore)              Data Centres (North America)           Hi-Tech Buildings                    Business Park Buildings
      Flatted Factories                     Stack-up / Ramp-up Buildings           Light Industrial Buildings

     1   Based on MIT’s 50% interest of the joint venture with MIPL in three fully fitted hyperscale data centres and 10 powered shell data centres in
         North America through MRODCT.
     2   Refers to leases which commenced prior to and on 31 Mar 2021.
20
Large and Diversified Tenant Base

 TOP 10 TENANTS BY GROSS RENTAL INCOME1
 As at 31 March 2021

          7.3%
                                                Over 2,000 tenants
                          6.4%                  Largest tenant contributes 7.3% of Portfolio’s Gross Rental Income
                                                Top 10 tenants forms about 33.3% of Portfolio’s Gross Rental Income

                                                                                                          Hi-Tech Buildings      Data Centres

                                        3.8%
                                                        3.6%

                                                                       2.9%
                                                                                       2.7%
                                                                                                      2.2%

                                                                                                                     1.5%            1.5%           1.4%

                                                                                                                      Fortune 25
                                                   Global Social                       Global
                                                                 Multinational                                       Investment
                                                      Media                          Colocation
                                                                  Company2                                           Grade-Rated
                                                    Company2                          Provider2
                                                                                                                      Company2

     1   Based on MIT’s 50% interest of the joint venture with MIPL in three fully fitted hyperscale data centres and 10 powered shell data centres in
         North America through MRODCT.
     2   The identities of the tenants cannot be disclosed due to the strict confidentiality obligations under the lease agreements.
21
Tenant Diversification Across Trade Sectors1
                  No single trade sector accounted >17% of Portfolio’s Gross Rental Income

         By Gross Rental Income
         As at 31 Mar 2021
     1   Based on MIT’s 50% interest of the joint venture with MIPL in three fully fitted hyperscale data centres and 10 powered shell data centres in
22       North America through MRODCT.
Singapore Portfolio Performance
Occupancy                                                                                                                                                                                                                                                                              Gross Rental Rate
                                                                                                                                                                                                                                                                                          S$ psf/mth
100%                                                                                                                                                                                                                                                                                               $2.50
                                      95.1% 95.0% 94.9% 95.0% 95.2% 95.4% 95.5%                                                                   94.7% 94.6%
                        94.3% 94.5%                                               93.9%
                93.2%                                                                                                               93.5% 93.8%                 93.0% 92.5%           93.1% 92.6%                                                                                                         92.9%
        92.3%                                                                             92.5%                                                                               92.1%                                                                                                               92.2%
                                                                                                  91.3% 90.7% 91.5% 90.8%                                                                                                                                                   90.7% 90.2%
                                                                                                                                                                                                                                                                                          91.5%
                                                                                                                            90.2%                                                                   90.4% 90.1%
                                                                                                                                                                                                                  89.6%                           89.8% 90.5% 90.2% 90.5%
90%                                                                                                                                                                                                                       87.8%           87.7%
                                                                                                                                                                                                                                  86.2%

                                                                                                                                                                                                                                                                    $2.12
                                                                                                                                                                                                                                                            $2.10              $2.11
                                                                                                                                                                                                                                                    $2.10
80%
                                                                                                                                                                                                               $2.01
                                                                                                                                                                                                                                                                                                  $2.11
                                                                                                                                                                                                          $1.97                                                                  $2.08
                                                                                                                                                                                        $1.95 $1.94                                               $2.07
                                                                                                                                                                                                                              $2.05                                                                       $2.05   $2.00
                                                                                                                                                          $1.90                                                      $2.02                 $2.04                                          $2.03
                                                                                                                                                  $1.89
                                                                                                                                        $1.88
70%                                                                                                                           $1.86
                                                                                                                                                                                         $1.94
                                                                                                                                                          $1.92 $1.92         $1.93
                                                                                                    $1.75
                                                                                          $1.73                                $1.84
                                                                        $1.71 $1.70                                   $1.83
                                                                                                              $1.82
60%                                                                                                   $1.77

                            $1.54             $1.55                $1.68
                                      $1.53
                  $1.52
                                                                $1.61
                                                        $1.59
50%                                             $1.56                                                                                                                                                                                                                                                             $1.50
                $1.49
        $1.45

40%

30%
                                                                                                                                                                                                                                                                                                                  $1.00
20%

10%

 0%                                                                                                                                                                                                                                                                                                               $0.50
        3Q 4Q 1Q 2Q 3Q 4Q 1Q 2Q 3Q 4Q 1Q 2Q 3Q 4Q 1Q 2Q 3Q 4Q 1Q 2Q 3Q 4Q 1Q 2Q 3Q 4Q 1Q 2Q 3Q 4Q 1Q 2Q 3Q 4Q 1Q 2Q 3Q 4Q 1Q 2Q 3Q 4Q
       FY10/11              FY11/12                     FY12/13               FY13/14                         FY14/15                   FY15/16                     FY16/17                      FY17/18                      FY18/19                       FY19/20                    FY20/21
   23                                                                                                          Occupancy (LHS)                                      Rental Rate (RHS)
Rental Revisions (Singapore)

    GROSS RENTAL RATE (S$ PSF/MTH)1, 2
    For Period 4QFY20/21
                                                                                                                            Before Renewal
                                        $4.67
                                                                                                                            After Renewal
                                                                                                                            New Leases
                                                                          $3.55                                             Passing Rent
                                $3.22

                                                                  $3.35

                        $1.98   $1.91
                                                                                             $1.68 $1.63 $1.67
                                                                                                                      $1.29 $1.25
                                                                                                     $1.61                          $1.10
                                                                                                                            $1.25

                         Hi-Tech Buildings              Business Park Buildings               Flatted Factories   Stack-Up/Ramp-Up Buildings

Renewal                     12 Leases                          1 Lease                         103 Leases               5 Leases
Leases                    (90,505 sq ft)                     (7,551 sq ft)                   (375,616 sq ft)          (38,180 sq ft)
                             2 Leases                         4 Leases                         58 Leases                6 Leases
New Leases
                           (2,828 sq ft)                    (12,622 sq ft)                   (161,060 sq ft)         (108,038 sq ft)
1    Gross Rental Rate figures exclude short term leases; except Passing Rent figures which include all leases.
2    Excluded rental rate for the sole renewal lease at the Business Park Buildings for confidentiality.

24
Healthy Tenant Retention (Singapore)

  LONG STAYING TENANTS                                           RETENTION RATE FOR 4QFY20/21

                            Up to 1 yr
                              9.5%
                                                                                                                 100.0%
  >10 yrs                                                                                94.3%
   31.6%                                   >1 to 2 yrs                        89.7%
                                                                                                                                            85.7%
                                              8.8%                                                   82.2%

                           4 yrs or
                             less
               More than    35.4%                 > 2 to 3 yrs
                 4 yrs                               11.0%
                64.6%

                                                 >3 to 4 yrs
                                                    6.1%           N.A.                                                         0.0%
                                                                     Data    Hi-Tech     Business     Flatted    Stack-up /     Light      Singapore
>5 to 10 yrs                             >4 to 5 yrs               Centres   Buildings     Park      Factories   Ramp-up      Industrial    Portfolio
   26.1%                                    6.9%                 (Singapore)             Buildings               Buildings    Buildings

                                      As at 31 Mar 2021            Based on NLA.
                                      By number of tenants.        Not applicable for Data Centres (Singapore) as there were no leases
                                                                   due for renewal.

  64.6% of the tenants have leased the properties for more than 4 years
  Tenant retention rate of 85.7% in 4QFY20/21
 25
Proposed Divestment – 26A Ayer Rajah Crescent1

 Sale Price                                                                 GFA                                            Completion

 S$125.0 million                                                       384,802 sq ft                                           2Q2021

                                                                         Exercise of option to purchase 26A Ayer Rajah
                                                                          Crescent by Equinix Singapore2
                                                                         Seven-storey data centre developed by MIT for
                                                                          Equinix in Jan 2015
                                                                         30-year land lease commenced on 22 May 2013
                                                                         Sale Price is in line with valuation of
                                                                          S$125.0 million3
                                                                         Sale Price is 18.1% above development cost of
                                                                          S$101.4 million and the estimated transaction cost of
                                                                          S$5.2 million
                                                                         Contributed about 2.0% to MIT’s portfolio gross
                                                                          revenue in FY20/21
 26A Ayer Rajah Crescent                                                 Use of sale proceeds to fund committed investments,
                                                                          reduce existing debt and/or make distributions to
                                                                          unitholders

     1   Subject to approval by JTC Corporation.
     2   Refers to the exercise of option to purchase 26A Ayer Rajah Crescent within the Lease Agreement between MIT and Equinix dated 1 Mar 2015. 26A Ayer Rajah
         Crescent is the only property in MIT’s portfolio with such option to purchase being granted to the tenant.
     3   Based on the annual valuation as at 31 Mar 2020.
26
4Q & FY20/21
                                              FINANCIAL HIGHLIGHTS

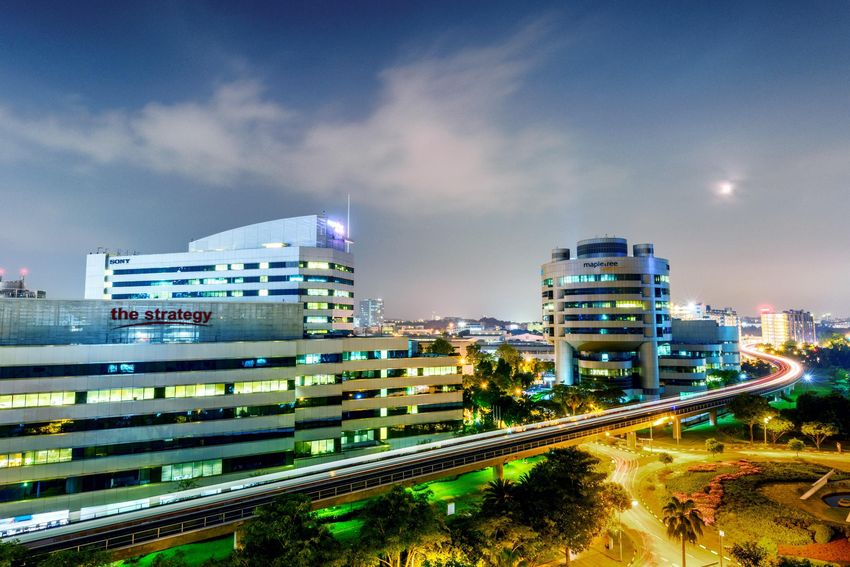
Business Park Buildings, The Strategy and The Synergy
Statement of Profit or Loss (Year-on-Year)
                                                                                                              4QFY20/21                      4QFY19/20
                                                                                                                                                                                    / ()
                                                                                                                (S$’000)                       (S$’000)

     Gross revenue                                                                                               121,062                          101,801                          18.9%

     Property operating expenses                                                                                 (29,254)                        (23,545)                          24.2%

     Net property income                                                                                          91,808                           78,256                          17.3%

     Borrowing costs                                                                                              (14,797)                       (11,029)                          34.2%

     Trust expenses                                                                                              (12,237)                         (8,185)                          49.5%

     Net fair value (loss)/gain on investment properties and investment property
                                                                                                                  (87,083)                         50,798                                 *
     under development

     Share of joint ventures’ results1                                                                               9,204                         60,897                         (84.9%)

     - Net profit after tax                                                                                          9,274                         13,619                         (31.9%)

     - Net fair value (loss)/gain on investment properties                                                             (70)                        47,278                                 *

     (Loss)/profit before income tax                                                                              (13,105)                        170,737                                 *

     Income tax expense                                                                                           (32,697)                              (7)                     >100.0%

     - Current income tax                                                                                            (345)                              (7)                     >100.0%

     - Deferred tax                                                                                               (32,352)                                -                               *

     (Loss)/profit for the period                                                                                 (45,802)                        170,730                                 *

     Net non-tax deductible/(chargeable) items                                                                    110,426                       (111,419)                                 *

     Cash distributions declared by joint ventures                                                                   6,124                          9,842                         (37.8%)

     Amount available for distribution                                                                             70,748                         69,153                             2.3%

     Distribution per Unit (cents)                                                                                    3.30                           2.85                          15.8%

     * Not meaningful
     1    Share of joint ventures’ results relates to MIT’s equity interest in the joint ventures with MIPL. The results of the joint ventures were equity accounted at the Group level. With
          effect from 1 Sep 2020, upon completion of the acquisition of the remaining 60% interest, financial results of the 14 data centres in the United States previously held under
28        Mapletree Redwood Data Centre Trust (“MRDCT”) had been consolidated.
Statement of Profit or Loss (Year-on-Year)
                                                                                                                FY20/21                         FY19/20
                                                                                                                                                                                   / ()
                                                                                                                (S$’000)                        (S$’000)

   Gross revenue                                                                                                447,203                          405,858                          10.2%

   Property operating expenses                                                                                  (96,212)                        (87,789)                            9.6%
   Net property income                                                                                          350,991                          318,069                          10.4%

   Borrowing costs                                                                                               (52,888)                       (45,019)                          17.5%

   Trust expenses                                                                                               (42,285)                        (33,155)                          27.5%

   Net fair value (loss)/gain on investment properties and investment property
                                                                                                                 (87,083)                         50,798                                 *
   under development

   Share of joint ventures’ results1                                                                               44,797                         76,506                         (41.4%)
   - Net profit after tax                                                                                          44,867                         29,228                          53.5%

   - Net fair value (loss)/ gain on investment properties                                                             (70)                        47,278                                 *

   Effects from deemed disposal of investments in
                                                                                                                 (15,662)                                -                               *
     joint venture2

   Profit before income tax                                                                                      197,870                         367,199                         (46.1%)

   Income tax expense                                                                                            (33,373)                            (56)                      >100.0%

   - Current income tax                                                                                              (826)                           (56)                      >100.0%

   - Deferred tax                                                                                                (32,547)                                -                               *

   Profit for the year                                                                                           164,497                         367,143                         (55.2%)

   Net non-tax deductible/(chargeable) items                                                                       94,595                      (125,950)                                 *

   Cash distributions declared by joint ventures                                                                   36,172                         24,144                          49.8%
   Amount available for distribution                                                                             295,264                        265,337                           11.3%
   Distribution per Unit (cents)                                                                                    12.55                          12.24                           2.5%

   * Not meaningful
    1    Share of joint ventures’ results relates to MIT’s equity interest in the joint ventures with MIPL. The results of the joint ventures were equity accounted at the Group level. With
         effect from 1 Sep 2020, upon completion of the acquisition of the remaining 60% interest, financial results of the 14 data centres in the United States previously held under
         MRDCT had been consolidated.
    2    Effects from deemed disposal of investments in joint venture refer to remeasurement of the Group’s 40% equity interest in MRDCT to its fair value at acquisition date. This is
         in accordance to the accounting standards where carrying amount of investment is remeasured to its fair value and amounts previously recognised in other comprehensive
29       income are reclassified to the Consolidated Statement of Profit or Loss.
Statement of Profit or Loss (Qtr-on-Qtr)
                                                                                                               4QFY20/21                      3QFY20/21
                                                                                                                                                                                    / ()
                                                                                                                 (S$’000)                       (S$’000)

    Gross revenue                                                                                                 121,062                        123,685                           (2.1%)

    Property operating expenses                                                                                   (29,254)                       (24,756)                           18.2%

    Net property income                                                                                            91,808                          98,929                          (7.2%)

    Borrowing costs                                                                                                (14,797)                       (15,508)                         (4.6%)

    Trust expenses                                                                                                (12,237)                        (10,987)                         11.4%

    Net fair value loss on investment properties and investment property under
                                                                                                                   (87,083)                                 -                            *
    development

    Share of joint ventures’ results1                                                                                9,204                           9,571                         (3.8%)

    - Net profit after tax                                                                                           9,274                           9,571                         (3.1%)

    - Net fair value loss on investment properties                                                                     (70)                                 -                            *

    Effects from deemed disposal of investments in joint venture2                                                            -                    (15,662)                               *

    (Loss)/Profit before income tax                                                                                (13,105)                         66,343                               *

    Income tax expense                                                                                             (32,697)                          (475)                       >100.0%

    - Current income tax                                                                                              (345)                          (324)                           6.5%

    - Deferred tax                                                                                                 (32,352)                          (151)                       >100.0%

    (Loss)/Profit for the period                                                                                   (45,802)                         65,868                               *

    Net non-tax deductible items                                                                                   110,426                           6,545                       >100.0%

    Cash distributions declared by joint ventures                                                                    6,124                           8,661                        (29.3%)

    Amount available for distribution                                                                               70,748                         81,074                         (12.7%)

    Distribution per Unit (cents)                                                                                     3.30                            3.28                          0.6%

   * Not meaningful
   1     Share of joint ventures’ results relates to MIT’s equity interest in the joint ventures with MIPL. The results of the joint ventures were equity accounted at the Group level. With
         effect from 1 Sep 2020, upon completion of the acquisition of the remaining 60% interest, financial results of the 14 data centres in the United States previously held under
         MRDCT had been consolidated.
   2     Effects from deemed disposal of investments in joint venture refer to remeasurement of the Group’s 40% equity interest in MRDCT to its fair value at acquisition date. This is
         in accordance to the accounting standards where carrying amount of investment is remeasured to its fair value and amounts previously recognised in other comprehensive
30       income are reclassified to the Consolidated Statement of Profit or Loss.
Statement of Financial Position

                                                           31 Mar 2021           31 Dec 2020              / ()      31 Mar 2020          / ()

     Total assets (S$’000)                                     6,391,619             6,167,895             3.6%           5,187,883       23.2%

     Total liabilities (S$’000)                                2,496,619             2,181,378           14.5%            1,627,762       53.4%
     Net assets attributable to
                                                               3,895,000             3,986,517           (2.3%)           3,560,121        9.4%
     Unitholders (S$’000)

     Net asset value per Unit (S$)1                                    1.66                  1.70        (2.4%)                   1.62     2.5%

     1   Net tangible asset per Unit was the same as net asset value per Unit as there were no intangible assets as at reporting dates.

31
Portfolio Valuation
                                                             Valuation as at 31 Mar 2021                  Valuation as at
     Property segment                                    Local currency                                      31 Mar 2020    Capitalisation rate
                                                                                           S$ million 1     (S$ million)2
                                                                (million)

     Data Centres (Singapore)                                     S$406.8                        406.8              415.5      6.00% to 6.50%

     Hi-Tech Buildings                                          S$1,374.5                      1,374.5            1,374.8      5.25% to 6.50%

     Business Park Buildings                                      S$575.1                        575.1              588.3               5.75%

     Flatted Factories                                          S$1,474.3                      1,474.3            1,506.6      6.00% to 7.25%

     Stack-up/Ramp-up Buildings                                   S$490.5                        490.5              488.7               6.50%

     Light Industrial Buildings                                    S$70.9                         70.9              74.0       6.00% to 6.25%

     Singapore Portfolio                                        S$4,392.1                      4,392.1            4,447.9

     Data Centres (North America) (100%)                      US$2,711.5                       3,633.7            3,413.2      5.50% to 8.00%
     MIT’s Interest in
                                                              US$1,768.6                       2,370.1            1,446.7
     North American Portfolio

     Total Portfolio                                                                           6,762.2            5,894.6

         Total valuation of 115 properties in MIT’s portfolio was S$6,762.2 million
         Increase in portfolio value was mainly due to the acquisition of the remaining 60% interest in 14 data
          centres in North America and the acquisition of 8011 Villa Park Drive, Richmond, Virginia
         Net asset value per Unit increased from S$1.62 as at 31 Mar 2020 to S$1.66 as at 31 Mar 2021

      1   Based on applicable Mar 2021 month end exchange rate of US$1 to S$1.34012.
      2   Based on applicable Mar 2020 month end exchange rate of US$1 to S$1.38619.
32
Strong Balance Sheet

                                                                31 Mar 2021                                    31 Dec 2020

     Total debt (MIT Group)                                  S$2,245.2 million                              S$1,949.3 million

     Weighted average tenor of debt                                3.6 years                                      3.2 years

     Aggregate leverage ratio1                                       40.3%                                          37.3%

 Strong balance sheet to pursue growth opportunities

  ‘BBB+’ rating with Stable Outlook by Fitch Ratings

  100% of loans unsecured with minimal covenants

  Successfully priced inaugural S$300 million perpetual securities at 3.15% on 3 May 2021
     Non-call period of five years with first reset on 11 May 2026 and subsequent resets
       occurring every five year thereafter
     Post-issuance, MIT’s aggregate leverage ratio is expected to fall from
       40.3% as at 31 Mar 2021 to 36.0%

 1    In accordance with Property Funds Guidelines, the aggregate leverage ratio includes proportionate share of aggregate leverage as well as
      deposited property values of joint venture. As at 31 Mar 2021, aggregate leverage including MIT’s proportionate share of joint venture is
33    S$2,798.5 million.
Well Diversified Debt Maturity Profile
DEBT MATURITY PROFILE
As at 31 March 2021
     More than S$600 million of committed facilities available

                                                          23.7%

       16.4%       16.9%                     16.9%

                                                          472.0      12.7%

                    335.0        7.8%
       368.0                                 379.7
                                                                     285.5                5.6%

                                175.0
                                                                                          125.0
                    45.0                                   60.0

      FY21/22     FY22/23      FY23/24      FY24/25     FY25/26     FY26/27    FY27/28   FY28/29
                                MTN                               Bank Loans
     Amounts in S$ million

34
                            Weighted Average Tenor of Debt = 3.6 years
Risk Management
                                                               31 Mar 2021        31 Dec 2020

     Fixed as a % of total debt                                     76.8%           96.2%

     Weighted average hedge tenor                                 3.0 years        3.0 years

     Weighted average all-in funding
                                                                     2.8%            2.9%
     cost for the quarter
     Interest coverage ratio for the
                                                                  6.0 times        6.4 times
     quarter
     Interest coverage ratio for the
                                                                  6.4 times        7.2 times
     trailing 12 months1

 1    Calculated in accordance with Property Funds Guidelines dated 16 Apr 2020

35
OUTLOOK AND
Data Centres, 7337 Trade Street,
San Diego
                                      STRATEGY
Singapore Industrial Property Market
DEMAND AND SUPPLY FOR MULTI-USER FACTORIES                  DEMAND AND SUPPLY FOR BUSINESS PARKS

 Total stock for factory and business park space: 39.0 million sq m
 Potential net new supply of 2.0 million sq m in 20211, of which
     •      Multi-user factory space accounts for 0.8 million sq m
     •      Business park space accounts for 0.2 million sq m
     •      Moderation in quantum of industrial land released through Industrial Government Land Sales
            Programme since 2013
 Median rents for industrial real estate for 1Q20211
     •      Multi-user Factory Space: S$1.74 psf/mth (1.2% q-o-q)
     •      Business Park Space: S$4.20 psf/mth (5.0% q-o-q)

37   1   JTC J-Space, 22 Apr 2021
Outlook
Singapore

 Challenging operating environment in view of uncertainty over trajectory of economic recovery
  from COVID-19 pandemic
     • Singapore economy grew by 0.2% y-o-y in the quarter ended 31 Mar 2021, a turnaround from the
       2.4% contraction in the preceding quarter1
     • While business sentiment among local firms in 2Q2021 turned positive after fourth consecutive
       quarters in negative territory, the optimism was limited to the financial, manufacturing and wholesale
       sectors2

 Impact on Singapore Portfolio
     • Rental reliefs of about S$12.7 million had been extended to tenants in FY20/21, which comprised
       MIT’s COVID-19 Assistance and Relief Programme and mandated rental reliefs under the COVID-19
       (Temporary Measures) Act
     • Rental arrears of more than one month improved from 1.4% as at 31 Dec 2020 to 1.2% as at
       31 Mar 2021

      1   Source: Ministry of Trade and Industry (Advance Estimates), 14 Apr 2021.
38    2   Source: Singapore Commercial Credit Bureau, 2Q2021.
Outlook
North America

 Resilient asset class with growth opportunities
     • CBRE expects investment in data centres in North America to increase in 2021 based on strong
       revenue growth projection3. There will also be more supply entering the market due to the increased
       construction pipeline of 457.8 megawatts (“MW”) across primary markets in 2020, compared to
       183.0MW in 2019. Out of the 457.8MW under construction, approximately 239MW has been
       preleased, mainly to hyperscale and cloud service providers, which will continue to make up the bulk
       of the leasing volume in 2021
     • New and evolving technologies such as 5G, edge computing and Internet of Things will continue to
       drive interest from operators to diversify their portfolios to serve smaller secondary and tertiary
       markets

      3   Source: CBRE North American Data Center Report H2 2020, 8 Mar 2021.

39
Diversified and Resilient

                         Anchored by large and diversified tenant base with low dependence
    Stable and            on any single tenant or trade sector
 Resilient Portfolio
                         Focus on tenant retention to maintain a stable portfolio occupancy

        Enhanced         Committed facilities of more than S$600 million available
        Financial
        Flexibility      Healthy interest coverage ratio of 6.4 times in 4QFY20/21

                         Completed the acquisition of a data centre located in Virginia,
        Growth by         United States
     Acquisitions and
      Developments       Redevelopment of the Kolam Ayer 2 Cluster remains on track for
                          completion in 2H2022

40
End of Presentation
For enquiries, please contact Ms Melissa Tan, Director, Investor Relations,
DID: (65) 6377 6113, Email: melissa.tanhl@mapletree.com.sg
You can also read