Comparison of Ductless and Ducted Heat Pump Retrofits in Manufactured Homes - Energy Trust of Oregon 421 SW Oak St. #300 Portland, OR 97204
←
→
Page content transcription
If your browser does not render page correctly, please read the page content below

Comparison of Ductless and
Ducted Heat Pump Retrofits
 in Manufactured Homes
            January 5, 2018

        Energy Trust of Oregon
         421 SW Oak St. #300
         Portland, OR 97204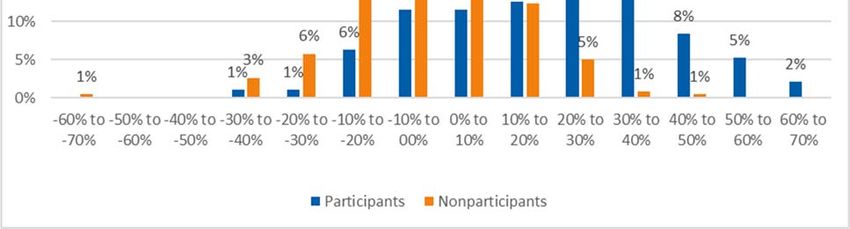
Prepared by:
   Matei Perussi
 Jeremy Eckstein
Cynthia Kan, PhD
   Karen Horkitz

        Cadmus
Table of Contents
Executive Summary ....................................................................................................................................... 1
      Conclusions and Recommendations ...................................................................................................... 2
Introduction .................................................................................................................................................. 5
      Goals and Research Questions ............................................................................................................... 6
Methodology................................................................................................................................................. 7
      Utility Billing Analysis ............................................................................................................................. 7
      Characteristics, System Costs, and Comparison of Heat Pump System Types..................................... 12
Utility Billing Analysis Results ..................................................................................................................... 13
      Energy Savings – All Ductless Heat Pumps ........................................................................................... 13
      Energy Savings by Existing Heating System .......................................................................................... 14
      Energy Savings – Savings by Heating Zone ........................................................................................... 15
      Energy Savings – Savings by Pre‐Usage Quartile .................................................................................. 16
Characteristics, System Costs, and Comparison with Ducted Heat Pumps ................................................ 17
      Ductless Heat Pump System Characteristics ........................................................................................ 17
      Ductless Heat Pump System Costs ....................................................................................................... 20
      Comparison of Ductless Heat Pumps with Ducted Heat Pumps .......................................................... 22
Conclusions and Recommendations ........................................................................................................... 25
Appendix A – Additional Subgroup Analysis ............................................................................................... 27
Appendix B. Oregon Heating Zone by County ............................................................................................ 30

                                                                                i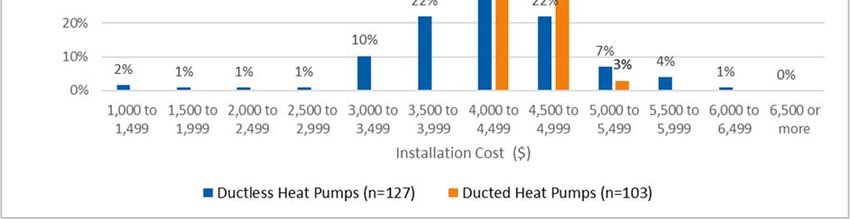
Executive Summary
Energy Trust of Oregon considers ducted and ductless heat pump retrofits in manufactured homes to be
a significant energy savings opportunity. In 2015 and 2016, Energy Trust ran a pilot to install ducted heat
pumps in manufactured homes. In the fall of 2017, Cadmus conducted a billing analysis of these ducted
heat pumps and found that they saved on average 3,269 kWh per year, or 21% of the pre‐installation
electricity use.

Following that study, Energy Trust commissioned Cadmus to conduct a similar billing analysis to evaluate
the savings from ductless heat pumps in manufactured homes installed through its Existing Homes
program in 2012–2016 and to compare the savings and costs between ductless and ducted heat pumps.

Cadmus’ analysis of ductless heat pumps and ducted heat pumps in manufactured homes found that the
two types of systems, on average, had very similar savings and installation costs despite differences in
reported savings, as shown in Table 1. The differences between reported and evaluated savings resulted
in realization rates that differ significantly —126% for ductless heat pumps and 75% for ducted heat
pumps. Because ducted systems were installed in homes that previously had electric forced‐air furnaces,
we compared these against the subset of ductless heat pumps that had also been installed in homes
with electric forced‐air furnaces.

              Table 1. Ductless and Ducted Heat Pump Average Savings and Cost Comparison
                                                          Energy Savings                           Installed Cost*    Savings
                                    Average        As a                                                                 per
        Heat Pump Type                                               Reported        Realization
                                     kWh       Percentage     n                                    Average     n       Dollar
                                                                    kWh per unit        Rate                         (kWh/$)
                                    per unit   of Pre‐NAC
 Ductless Heat Pumps**               3,324         22%        84        2,646          126%        $4,501     170     0.74
 Ducted Heat Pumps                    3,269          21%       78         4,367         75%        $4,511     103     0.72
 *Installation costs include both the cost of labor and the costs of the equipment
 ** Installations in homes with electric forced‐air furnaces

Cadmus reviewed Energy Trust’s program data to analyze the cost profile of the ducted and ductless
systems installed in manufactured homes. Installation costs for ductless heat pumps varied significantly;
however, costs were not sensitive to a wide range of variables, including home size and age. One
exception was the Portland Metro area, where ductless heat pump installation costs were higher than
the rest of the state (likely due to a higher cost of living than elsewhere in Oregon). Installation costs for
ducted heat pump systems installed through the pilot were clustered much more closely than ductless
systems. This difference reflects the distinct designs of the two programs: the ducted heat pump pilot
was designed with a tight cost structure, while the ductless heat pump incentive is applied to installation
costs determined by the open market.

Cadmus also reviewed program data for ductless heat pumps to identify outliers and blank entries for
key data fields. We requested original documents for 35 projects and received invoices and applications

                                                               1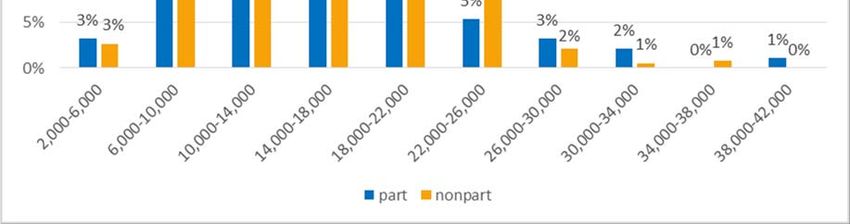
for 30 of these. Based on that documentation, we made two corrections to systems install cost, four
corrections to home age, and seven corrections to system capacity.
Conclusions and Recommendations
Ducted and ductless heat pumps provide similar savings at comparable costs. The billing analysis for
ducted and ductless heat pumps in manufactured homes showed almost identical savings on the basis
of annual kWh and percentage of pre‐installation usage for both system types. The annual savings for
homes with electric forced‐air furnaces were 3,324 kWh for ductless heat pumps and 3,269 kWh for
ducted heat pumps. Despite, or perhaps due to the difference in program delivery, average costs and
savings per dollar spent on system cost were also almost identical: $4,501 installed cost and 0.74 kWh
per dollar for ductless heat pumps and $4,511 installed cost and 0.72 kWh per dollar for ducted heat
pumps. Cadmus found greater variance in cost of the ductless heat pumps incentivized through the
market‐based program. Offering the ductless heat pump measure in conjunction with cost‐controls,
such as was done with the ducted heat pump pilot, should reduce the variance in cost and potentially
lower the average cost.
Recommendation: Offer incentives for both ducted and ductless heat pumps for manufactured
homes. Work with the PMC to explore whether the cost of a ductless heat pump retrofit will
respond to the same strategies used in the ducted heat pump pilot.
Although ducted and ductless heat pump savings are very similar, the realization rates for the two
systems differ. The billing analysis of the two system types showed a realization rate of 126% for
ductless heat pumps and 75% for ducted heat pumps in manufactured homes. This major difference
suggests that Energy Trust underestimated the savings for ductless heat pumps and overestimated the
savings of ducted heat pumps in manufactured homes.
Recommendation: Revise ex ante savings estimates for ductless and ducted heat pumps for
manufactured homes to more closely reflect evaluated savings.
Program design appears to significantly affect individual installation costs of ductless and ducted heat
pumps. There was higher variance in installation costs for ductless heat pumps than for ducted heat
pumps, despite the similarities in technology and housing stock. This variance is likely explained, in part,
by the different program designs. The ducted heat pump pilot was delivered by four vetted contractors
who were paid a fixed rate for the installation, whereas ductless heat pumps were installed by many
contractors in a market‐based program design. Although the average installation costs of these systems
were similar, customers installing a ductless heat pump had much more uncertainty in the price they
would pay. Such price inconsistency could affect uptake of this measure.
Recommendation: If Energy Trust chooses to move forward in promoting ductless and ducted
heat pumps in manufactured homes, it should consider the approach of its ducted heat pump
pilot for both technologies. With more consistent pricing, and potentially lower retrofit costs,
this design is likely to drive higher measure uptake than the market‐based design currently used
for ductless heat pumps.
2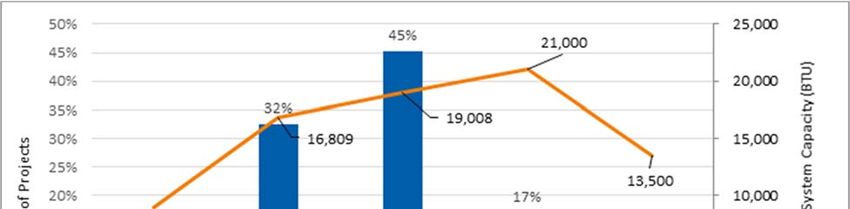
Ductless heat pump program data contained some errors and missing information. Cadmus reviewed
the program data for ductless heat pumps and selected a sample of projects that appeared to be
outliers and in need of further investigation. We compared the program data for these projects against
their original project documentation and found errors that indicate an opportunity for Energy Trust to
improve its data entry process. Cadmus also found fields in the program data that were frequently
missing information, such as the HSPF and SEER.
Recommendation: Conduct quality review checks of the program data against project
documents to improve the accuracy and completeness of the data. Consider prioritizing the
review of project files with values that appear to be missing or outliers.
3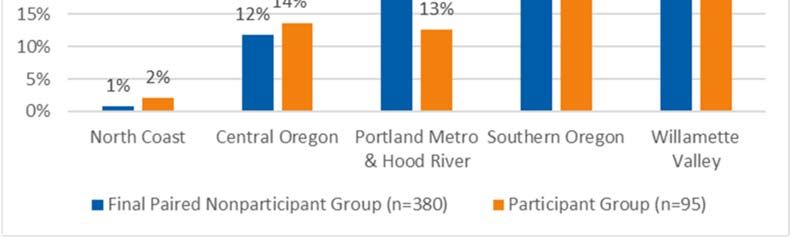
MEMO
   Date: April 5, 2018
    To: Board of Directors
  From: Marshall Johnson, Residential Senior Program Manager
         Dan Rubado, Evaluation Project Manager
Subject: Staff Response to the Comparison of Ductless and Ducted Heat Pump Retrofits in
         Manufactured Homes Report

        After the completion of its successful pilot of ducted heat pump retrofits in manufactured homes with
        electric forced air furnaces, Energy Trust commissioned Cadmus to analyze ductless heat pumps (DHPs)
        supported by its Existing Homes program and compare the savings and costs to the heat pump pilot.
        This goal of the study was to help Energy Trust determine the most cost‐effective electric heating
        system for manufactured homeowners and decide which technology to promote in this market. The
        study found that DHPs provided comparable savings to ducted heat pumps at a very similar cost. These
        findings led Energy Trust’s Residential program to pursue a strategy to promote both technologies in
        manufactured homes. In addition, the DHP savings estimates from the study were significantly higher
        than Energy Trust’s deemed savings. Thus, Energy Trust will adjust its deemed savings for DHPs in
        manufactured homes based on this study.

        Given that the DHPs were installed through the open market, while the ducted heat pump pilot used a
        competitively selected pool of contractors and price controls to constrain costs, there is probably room
        to significantly reduce the installed costs of DHPs in manufactured homes. If the Residential program
        can bring down the cost of DHPs, using a similar strategy to the ducted heat pump pilot, DHPs will be the
        more cost‐effective technology. The Residential program is currently planning a new campaign to
        promote DHPs and ducted heat pumps using the principles tested in the ducted heat pump pilot. This
        effort should drive down installation costs for both technologies, improving cost‐effectiveness and
        driving higher uptake in the market. If successful, this strategy has the potential to reach a large number
        of manufactured homes across the state and achieve substantial energy savings.

                                                            4
Introduction
Given the potentially high energy savings that can be achieved with heat pump retrofits in electric‐
heated manufactured homes, Energy Trust of Oregon is interested in understanding the savings that can
be achieved with two types of heat pump systems—ducted and ductless—and which of these
technologies is more likely to be cost‐effective. Energy Trust commissioned Cadmus to analyze and
compare the installation costs and energy savings of these two measures.

Since 2008, Energy Trust has offered incentives for ductless heat pump system retrofits in electric‐
heated, single‐family homes. Energy Trust currently provides incentives for nearly 2,000 single‐family
ductless heat pump retrofit projects in Oregon each year. This technology has been slower to catch on in
manufactured homes, however, probably because of financial barriers. Nevertheless, the high
prevalence of electric resistance heat and lower insulation levels in manufactured homes means there is
a great opportunity for energy savings in this market.

Energy Trust provided incentives for just 16 and 18 ductless heat pumps in manufactured homes in 2012
and 2013, respectively. To accelerate the adoption of the technology in this market, Energy Trust’s
Existing Homes program, implemented by program management contractor (PMC) CLEAResult, offered
a bonus incentive in 2014 and 2015. The bonus boosted ductless heat pump installations to 82 in 2015
and the increase was sustained, to some degree, even after the bonus ended.

In 2016, Energy Trust decided to test whether central, ducted heat pump retrofits could be affordably
installed in manufactured homes with electric forced air furnaces as an alternative to a ductless heat
pump. Energy Trust launched a pilot through its Existing Homes program to offer low‐cost, flat‐fee,
ducted heat pump retrofits to owners of manufactured homes. The retrofits were installed by four
vetted trade ally contractors, selected through a competitive process, who were paid a fixed rate per
project. Cadmus’ evaluation of the pilot showed that this strategy successfully drove demand for ducted
heat pump retrofits in this market.1 Cadmus also conducted a billing analysis to analyze the energy
savings of these ducted heat pumps. The energy savings were 3,269 kWh per year, on average, or 21%
of pre‐installation electricity usage.

In the wake of this successful pilot, Energy Trust decided to explore which heat pump system – ducted
or ductless – would be a more cost‐effective technology in reducing electric loads in manufactured
homes with electric forced air furnaces. Given the measures were offered under different program
designs (limited contractor pilot vs. market‐based program), the comparison should be interpreted with
this context in mind as the pilot may have resulted in lowering the cost of ducted heat pump retrofits.

1
    Cadmus delivered the “Existing Manufactured Homes Heat Pump Evaluation Final Report” to the Energy Trust
    of Oregon on November 7, 2017.

                                                     5
Goals and Research Questions
The goal of this study was to analyze the electricity savings and cost of ductless heat pump retrofits in
manufactured homes in Oregon that were heated by an electric forced air furnace or zonal electric
heaters. The secondary goal was to compare the energy savings and installation costs between ductless
and ducted heat pumps in similar homes with electric forced air furnaces.
The primary research questions for this study were these:
What are the typical electricity savings of ductless heat pump systems installed in manufactured
homes with either an electric forced‐air furnace or zonal electric heat?
Are there important differences in electric savings by system characteristics, region, housing
characteristics, or other factors?
What is the typical installation cost of ductless heat pump systems installed in homes with either
an electric forced air furnace or zonal electric heat?
Are there important differences in installation cost by system characteristics, region, housing
characteristics, or other factors?
How do electric savings and installation costs compare between the two system types in homes
with electric forced air furnaces?
Which type of heating system retrofit provides the most cost‐effective energy savings in
manufactured homes?
6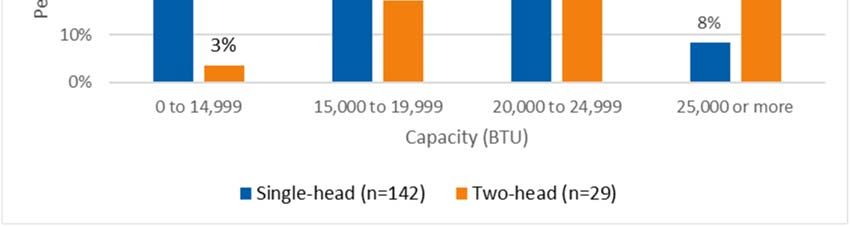
Methodology
In October 2017, Cadmus conducted a billing analysis of manufactured homes that had participated in
the ductless heat pump incentive offering, analyzed program data, and compared the results from this
study to the results from the 2015/2016 manufactured homes heat pump pilot.
Utility Billing Analysis
The billing analysis assessed the energy savings associated with the ductless heat pumps installed in
manufactured homes from 2012 to 2016. Cadmus used a variable degree‐day, household‐level
regression modeling method, similar to the Princeton Scorekeeping Method (PRISM).2 We determined
the final adjusted gross savings as the difference of the pre‐/post‐installation change in consumption of
the ductless heat pump participants and a matched comparison group. We used the comparison group
to account for exogenous factors that could have affected energy consumption during the 2011–2017
timeframe.
Cadmus created the final billing analysis dataset from the following:
Ductless heat pump participant characteristics, collected and provided by Energy Trust
(including installation dates, square footage, heat sources, baseline equipment, and expected
savings for the entire ductless heat pump participant population).
Comparison group customer characteristics, selected by Cadmus from customers who received
an Energy Trust incentive for a minor measure, free duct‐sealing service, or Energy Saver Kit for
manufactured homes from 2008 through 2016. The initial comparison group comprised nearly
8,000 electric customers in Oregon. Of these, approximately 4,500 customers were located in
the same cities as customers that received rebates from Energy Trust for installing ductless heat
pumps in manufactured homes and were therefore considered for the final matched sample
selection. We matched nonparticipant consumption to participant consumption at the quartile
and heating zone levels. To ensure a more accurate representation of the nonparticipant change
in usage, we selected four times more nonparticipants than participants in the heating zone and
quartile matching process.
Utility billing data, provided by Energy Trust, including participant and nonparticipant billing
data from 2011 through August 2017. The billing data also included customer information and
incidental program participation information for other measures supported by Energy Trust. The
final billing analysis sample consisted of 95 participants and 380 comparison homes.
Oregon weather data, including daily average temperatures from January 2011 to August 2017
for 22 weather stations, corresponding with Energy Trust participant locations. Cadmus also
obtained typical meteorological year 3 (TMY3) normal weather values for these stations from
2
Fels, M. "PRISM: An Introduction." Energy and Buildings 9, #1‐2, pp. 5‐18. 1986. Available online:
www.marean.mycpanel.princeton.edu/~marean/images/prism_intro.pdf
7the National Oceanic and Atmospheric Administration (NOAA). We used TMY3 data to calculate
energy use under normal weather conditions.
Cadmus matched participant data with utility billing data, mapping daily heating degree‐days (HDDs)
and cooling degree‐days (CDDs) to respective monthly billing periods using zip codes. For participants,
we defined the billing analysis pre‐period as the 12 months before the measure installation date and the
post‐period as the 12 months following the measure installation date (the month of installation was
removed from the analysis). Participant installations occurred between 2012 and 2016.
For nonparticipants, we used the average participant installation dates by county as the nonparticipant
pre/post cutoff dates.3 These more detailed county‐level averages assured that the nonparticipant
pre/post periods more closely represented the participant pre‐periods, rather than just using one overall
average participant installation date.
Data Screening
Cadmus developed the final analysis samples by cleaning the data and selecting treatment and
comparison group accounts that met the following criteria.
Nonparticipants in the same cities as the participants
A minimum of 300 days in each of the pre‐ and post‐periods (i.e., before the earliest installation
and after the latest reported installation)
A consumption change of less than 70% of pre‐pilot usage in either direction, removing large
outlier homes with non‐program related changes
The same occupant was present throughout the pre‐ and post‐periods
No installation of other Energy Trust measures saving more than 10% of ductless heat pump
savings in the analysis period by participants and nonparticipants4
Cadmus also screened individual monthly billing data to check for vacancies, outliers, and seasonal
usage changes, and removed participants and non‐participants from the sample if they would introduce
a bias to the analysis. Table 2 shows participant and nonparticipant screening criteria and attrition used
for the billing analysis.
3
The nonparticipant increases in usage by average participant installation year ranged between 89 kWh to 131
kWh. Thus, the nonparticipant change is stable by the average cutoff year selected.
4
The evaluated ductless heat pump measures accounted for 99% of the savings claimed by Energy Trust at the
participant sites. Cadmus removed participants who installed other Energy Trust measures that accounted for
over 10% of the ductless heat pump ex ante savings in the analysis period. Because ductless heat pumps had a
very large influence on electricity usage, the impact of other program measures was expected to be very
minimal, at most 1%.
8Table 2. Screen for Inclusion in Billing Analysis
Nonparticipant Participant Remaining Remaining
Screen Attrition Attrition Nonparticipant Participant
(n) (n) (n) (n)
Original DHP and Nonparticipant
‐ ‐ 7,819 197
Population
Matched Billing Data Sample (keep only
nonparticipant residential accounts in 3,368 23 4,451 174
participant cities)
Less than 300 Days in Pre‐ or Post‐Period 426 18 4,025 156
Changed Consumption by More Than 70%
137 ‐ 3,888 156
from Pre‐ to Post‐Period
Remove Customers who Moved from Pre‐
776 34* 3,112 122
to Post‐Period
Nonparticipants or Participants who
357 19 2,755 103
Installed Measures in Analysis Period
Billing Data Outliers, Vacancies, and
389 8 2,366 95
Seasonal Usage
Nonparticipant Heating Zone Quartile
1,986 ‐ 380 95
Matching
Final Sample 380 95
* Cadmus also estimated savings including 23 of the 34 customers who moved and who passed all the screens. Eleven
customers failed other screens and would have been dropped anyway. We found that the customers who moved had an
unusually high realization rate of 152% and a low relative precision of +‐39%. These customers were excluded because their
savings were unusually high and the consumption behavior of the occupants were significantly different.
Nonparticipant and Participant Sample Distribution by Energy Trust Region and Pre‐Retrofit
Usage
Figure 1 shows the participant Energy Trust regional distribution and compares this against final paired
nonparticipant groups. Although Cadmus created the nonparticipant group by matching the heating
zone5 and pre‐period usage quartile, the figure shows good matching at the regional level as well.
5
Nonparticipants were drawn from the same cities as the participants, although the matching to participants
was not done at the city level.
9Figure 1. Regional Distribution of Participant and Matched Nonparticipant Homes
Figure 2 shows the distribution of pre‐retrofit kWh usage for the participant and matched
nonparticipant groups, which is similar across most of the usage bins. The average pre‐period usage was
nearly identical between participants and nonparticipants, 14,860 kWh and 14,858 kWh, respectively.
Figure 2. Pre‐Retrofit Usage (kWh) for Participants and Nonparticipants
10PRISM Models
Cadmus estimated site‐level heating and cooling PRISM models for various heating and cooling base
temperatures in both the pre‐ and post‐period for each customer using the following specification:
Where for each customer ‘i’ and monthly billing period ‘t’:
ADCit = Average daily kWh consumption
i = The participant intercept, representing the average daily kWh baseload
1 = The model space heating slope (used only in the heating only, heating +
cooling model)—average change in daily usage resulting from an
increase of one daily heating degree‐day (HDD)
AVGHDDit = The base 45–65°F average daily HDDs for the specific location (used only
in the heating only, heating + cooling model)
2 = The model space cooling slope (used only in the cooling only, heating +
cooling model)—average change in daily usage resulting from an
increase of one daily cooling degree‐day (CDD)
AVGCDDit = The base 65–85°F average daily CDDs for the specific location (used only
in the cooling only, heating + cooling model)
it = The error term
Cadmus used a grid‐search PRISM method that allowed the heating degree base temperatures to vary
from 45 to 65 and the cooling base temperatures to vary from 65 to 85. If a heating and cooling model
yielded incorrect negative coefficient signs for all models, we also estimated heating‐only and cooling‐
only model specifications. We selected as the final model the one with positive coefficient signs for the
heating and/or cooling slopes and the highest r‐square. Using the above model, we computed weather‐
normalized annual kWh consumption for each site in both the pre‐ and post‐pilot periods as:
∗ 365
Where, for each customer ‘i’ and for the annual pre‐ and post‐ Pilot time periods ‘t’:
NACi = Normalized annual consumption (kWh)
i * 365 = Annual baseload kWh usage (non‐weather sensitive)
LRHDDit = Annual, long‐term heating degree‐days of a normal weather year from
NOAA TMY3 data, based on home location
1 LRHDDit = Weather‐normalized, annual heating usage (kWh)
(i.e., heat‐NAC)
11LRCDDit = Annual, long‐term cooling degree‐days of a normal weather year from
NOAA TMY3 data, based on home location
2 LRCDDit = Weather‐normalized, annual cooling usage
(i.e., cool‐NAC)
Savings Calculation
Cadmus derived adjusted gross energy savings using the following equation to adjust the evaluated
participant savings based on changes in the comparison group energy use. This adjustment accounted
for exogenous factors that occurred outside the effect of interest (all terms in the equation are
averages). Similar to a straight difference‐in‐difference approach, this method accounted for potential
discrepancies between each group’s pre‐treatment weather‐normalized annual usage.
. .
. .
. .
Subgroup Analysis
Wherever an analysis subset variable was available for both participant and nonparticipant groups,
Cadmus calculated the adjusted gross savings by comparing the participant subgroup with the same
nonparticipant subgroup. However, we note that we did not match the nonparticipant group by pre‐
period usage to the participant group at the subgroup level. As a result, the pre‐period nonparticipant
usage may not match the participant usage within each subgroup. In addition, the weighted savings of
subgroups may not match the overall results. If a variable was available only for participants, only the
overall nonparticipant group change in usage was applied to obtain the adjusted gross savings.
Characteristics, System Costs, and Comparison of Heat Pump System Types
Cadmus reviewed Energy Trust’s program data to analyze system characteristics and costs for ductless
heat pumps. We first screened the data for outliers that could indicate errors in data entry and for blank
fields for key variables. We then gave Energy Trust a targeted list of 35 projects and asked to review
original project documents such as customer applications and contractor invoices. Energy Trust provided
incentive application forms and invoices for 30 projects.
We reviewed the original project documents for a total of 140 items, or data fields, including system
install cost, home age, home size, and ductless heat pump capacity. After correcting a number of errors
in the program data, Cadmus analyzed the data to identify any trends in ductless heat pump system
costs and characteristics. We conducted cross‐tab analysis for a range of variables, including installation
cost, number of indoor heads, installation year, existing heating system type (baseboard or electric
furnace), ductless heat pump brand, participant region, home size, system efficiency and capacity, and
home age.
We also compared the installation costs and energy savings of both ductless and ducted heat pump
systems, drawing on results from the ducted heat pump analysis, by normalizing both groups’ savings by
system capacity, and including only the systems that replaced electric furnaces.
12Utility Billing Analysis Results
This section presents the evaluated savings for ductless heat pump installations in absolute and
percentage terms. Cadmus also calculates the realization rate as the evaluated savings divided by the
Energy Trust’s reported savings.6
Energy Savings – All Ductless Heat Pumps
Ductless heat pump participants achieved a 22% reduction in overall electric usage, an average of
3,294 kWh per year, as illustrated in Table 3. With reported savings averaging 2,711 kWh, this translates
to a 122% realization rate. This table and all subsequent tables that show savings results include
adjusted gross savings, which Cadmus calculated based on the difference in percentage change between
participant and comparison homes. Additionally, we report savings as a percentage of pre‐installation
normalized annual consumption (Pre‐NAC), which is a helpful metric for comparing and assessing the
magnitude of measure impacts.
Table 3. Overall Ductless Heat Pump Energy Savings
Relative Savings as % of Pre‐
Pre‐NAC Average Savings (kWh) Realization
Group n Precision at 90% NAC
(kWh) Rate
Evaluated Reported Confidence Evaluated Reported
Comparison 380 14,858 ‐103 N/A N/A ±193% ‐1% N/A
Participant 95 14,860 3,192 2,711 118% ±19% 21% 18%
Adj. Gross
95 14,860 3,294 2,711 122% ±19% 22% 18%
Savings
Table 4 summarizes the changes in base load and weather‐sensitive (heating + cooling) energy
consumption from the pre‐ to post‐installation periods. The results show that participants decreased
their base loads by 438 kWh and their weather sensitive usage by 2,845 kWh. PRISM models, however,
do not always accurately disaggregate the base, heating, and cooling loads.
Table 4. Overall Ductless Heat Pump Savings (Weather Sensitive and Base Load)
Change in Relative
Pre‐ Pre‐ Change
Base Load Weather Precision
Base Base Weather in
Change as % Sensitive Use Weather
Group n Load Load Sensitive Weather
of Pre‐Base as % of Pre‐ Sensitive
Usage Change Usage Sensitive
Load Use Weather Savings at
(kWh) (kWh) Use
Sensitive Use 90%
Comparison 380 7,449 ‐399 ‐5% 7,409 296 4% ±34%
Participant 95 7,336 45 1% 7,524 3,146 42% ±14%
Adj. Gross
95 7,336 438 6% 7,524 2,845 38% ±13%
Savings
6
Reported savings are obtained from the program data field called “working_kwh”
13Figure 3 shows the distribution of savings for participants and nonparticipants. Nonparticipants
increased their usage, on average, leading to a positive adjustment to participants’ average savings.
Figure 3. Percentage Savings Distribution
Energy Savings by Existing Heating System
Cadmus also analyzed savings for participants based on the kind of electric heating equipment already in
the home at the time participants had the ductless heat pumps installed. As shown in Table 5, the
average savings and realization rates for participants with electric furnaces were similar to those of all
participants.
Table 5. Participant Savings by Existing Heating System
Average Savings Relative Savings as %
Pre‐ (kWh) Realization of Pre‐NAC
Group n Precision at
NAC Rate
Evaluated Reported 90% Confidence Evaluated Reported
Homes with Electric Furnaces
Comparison 336 14,817 ‐207 N/A N/A ±102% ‐1% N/A
Participant 84 14,815 3,117 2,646 118% ±21% 21% 18%
Adj. Gross Savings 84 14,815 3,324 2,646 126% ±21% 22% 18%
Homes with Zonal Electric Heat (Participant only)
Comparison 380 14,858 ‐103 N/A N/A ±193% ‐1% N/A
Participant 11 15,203 3,762 3,205 117% ±41% 25% 21%
Adj. Gross Savings 11 15,203 3,867 3,205 121% ±40% 25% 21%
Although savings were slightly higher for participants with zonal (baseboard) electric heating systems,
the relative precision of these estimates was ±40%, significantly worse than for all participants. In this
analysis, Cadmus selected a separate nonparticipant group with electric furnaces that was matched only
14to the group of participants with electric furnaces, which had an increase in usage of 207 kWh
(compared to the increase of 103 kWh in the overall comparison group in Table 3). The difference
between nonparticipant groups is not statistically significant. There was insufficient sample to obtain a
matched nonparticipant group for zonal heating, so Cadmus used the comparison group from the
overall analysis.
Among ductless heat pump retrofits in homes with electric forced‐air furnaces, 71 installations had a
single indoor unit and 13 installations had two indoor units. The adjusted gross savings by number of
heads are shown in Table 6.
Table 6. Adjusted Gross Savings by Number of Heads (Forced‐Air Furnace Replacement Only)
Number Relative Savings as %
Pre‐ Average Savings (kWh) Realization
of n Precision of Pre‐NAC
NAC Rate
Heads Evaluated Reported at 90% Evaluated Reported
1 71 14,403 3,085 2,630 117% 10% 21% 18%
2 13 17,063 2,990 2,738 109% 25% 18% 16%
Energy Savings – Savings by Heating Zone
The following tables summarize savings by heating zone.7 Ductless heat pump participants were either
in heating zone 1 or in heating zone 2. Table 7 shows that participants in heating zone 1 achieved a 24%
reduction in electric usage, saving an average of 3,389 kWh per year.
Table 7. Savings by Heating Zone
Relative Savings as % of
Average Savings (kWh) Realization
Group n Pre‐NAC Precision at Pre‐NAC
Rate
Evaluated Reported 90% Confidence Evaluated Reported
Heating Zone 1
Comparison 308 14,342 96 N/A N/A ±229% 1% N/A
Participant 77 14,342 3,485 2,736 127% ±20% 24% 19%
Adj. Gross
77 14,342 3,389 2,736 124% ±22% 24% 19%
Savings
Heating Zone 2
Comparison 72 17,067 ‐954 N/A N/A ±43% ‐6% N/A
Participant 18 17,077 1,936 2,607 74% ±48% 11% 15%
Adj. Gross
18 17,077 2,890 2,607 111% ±35% 17% 15%
Savings
With reported savings of 2,736 kWh, this translates to a 124% realization rate. Participants in heating
zone 2 achieved a 17% reduction in electric usage, saving an average of 2,890 kWh per year. With
7
Heating zone 1 has fewer HDDs than Oregon’s other two heating zones and is where most of the population of
Oregon lives. The list of heating zone by county is provided in Appendix B.
15reported savings of 2,607 kWh, this translates to a 111% realization rate. The savings, realization rate,
and percent savings are not significantly different between zones 1 and 2 at the 90% confidence level.
Energy Savings – Savings by Pre‐Usage Quartile
Table 8 shows savings by pre‐usage quartiles. Participants achieved 17% to 25% reductions in electric
usage depending on the quartile. Savings by quartile increased from 1,368 kWh in quartile 1 to 5,064
kWh in quartile 4. With reported savings ranging from 2,827 kWh to 2,619 kWh, the lowest quartile
achieved a 48% realization rate while the highest quartile achieved a 193% realization rate. In the lowest
quartile, the average reported savings of 2,827 kWh is 34% of the entire pre‐period usage; as such, the
reported savings appear to be overstated. Although the difference between quartiles 1 and 4 for kWh
savings and realization rate appear substantial, the actual percent savings are not statistically different.
Table 8. Savings by Pre‐Usage Quartile
Pre‐ Relative Savings as %
Pre‐ Average Savings (kWh) Realization
Group Usage n Precision at of Pre‐NAC
NAC Rate
Quartile Evaluated Reported 90% Confidence Evaluated Reported
1 100 8,263 ‐480 N/A N/A ±43% ‐6% N/A
2 92 11,789 ‐352 N/A N/A ±83% ‐3% N/A
Comparison
3 92 16,209 ‐169 N/A N/A ±202% ‐1% N/A
4 96 23,374 593 N/A N/A ±103% 3% N/A
1 25 8,260 889 2,827 31% ±66% 11% 34%
2 23 11,789 2,591 2,691 96% ±34% 22% 23%
Participant
3 23 16,223 3,724 2,701 138% ±26% 23% 17%
4 24 23,371 5,657 2,619 216% ±28% 24% 11%
1 25 8,260 1,368 2,827 48% ±45% 17% 34%
Adj. Gross 2 23 11,789 2,943 2,691 109% ±32% 25% 23%
Savings 3 23 16,223 3,893 2,701 144% ±26% 24% 17%
4 24 23,371 5,064 2,619 193% ±34% 22% 11%
Cadmus conducted additional analysis for various subgroups, including analysis by utility service
territory, housing vintage, and home size. The results from this additional analysis can be found in
Appendix A.
16Characteristics, System Costs, and Comparison with Ducted Heat Pumps
After reviewing Energy Trust’s program data, Cadmus made two corrections to systems install cost, four
corrections to home age, and seven corrections to system capacity. We were unable to verify data for 23
items in the participant dataset, because these items were not included in the original documents. The
results of this data cleaning exercise are not indicative of the overall quality of the data, since we
requested documents to verify outliers and missing values, and not based on a random sample.
Using the updated ductless heat pump dataset, Cadmus conducted cross‐tab analysis for a range of
variables, including installation cost, number of indoor heads, installation year, existing heating system
type (baseboard or electric furnace), manufacturer, participant region, home size, system efficiency and
capacity, and home age.
We also compared the installation costs and energy savings of both ductless and ducted heat pump
systems, drawing on results from the ducted heat pump pilot impact evaluation.
Ductless Heat Pump System Characteristics
Cadmus analyzed ductless heat pump project characteristics, such as home age, home size, type of
existing heating equipment, number of installations over time, system manufacturer, system efficiency
level, and where in the home equipment was installed. Table 9 shows the majority of units were single
indoor unit installations in slightly smaller and older homes than the installations with two indoor units.
Table 9. Summary of Ductless Heat Pump System Characteristics
Number of Average Percent of
Average Average
Indoor Average Average Average Home Size systems
Capacity Home Age
Units* Cost ($) SEER HSPF (Square replacing
(BTU) (years)
footage) furnaces
All (n=199) $ 4,582 19,691 20.0 11.0 1,195 33.5 85.9%
1 (n=148) $ 4,256 18,371 20.4 11.1 1,179 33.8 85.8%
2 (n=30) $6,102 25,935 17.5 10.7 1,234 31.0 80.0%
*n for variables will vary depending on the data that was available for each. For example, the program data only had SEER
for 50 installations, HSPF for 94 installations, and capacity for 183 installations out of a total of 199 retrofits.
As shown in Figure 4, most participants installed ductless heat pump systems in 2015, and a large
majority of homes originally had electric furnaces, whereas the others had zonal heat (baseboard) heat.
17Figure 4. Installation Year of Ductless Heat Pump and Existing Heating Equipment
FAF = forced air furnace
Figure 5 shows that one manufacturer has been the most popular since 2013, accounting for 55% of
Energy Trust‐incentivized installations from 2012 to 2016.
Figure 5. DHP Installation Manufacturers and Installation Year
25%
21%
Percentage of Projects (2012‐2016)
20%
14%
15%
12%
11%
10%
7%
6%
5%
5% 3% 4% 3% 3%
2% 2% 2%
1% 1% 1% 1% 1%
0%
0%
2012 2013 2014 2015 2016
Installation Year
Manufacturer 1 Manufacturer 2 Manufacturer 3 Manufacturer 4 n=189
18As shown in Figure 6, most single‐head ductless heat pumps had a capacity of between 15,000 BTU and
19,999 BTU (the average was 18,371 BTU), whereas two‐head systems tended to be higher capacity
systems, as expected (the average was 25,935 BTU).
Figure 6. System Capacity for Single‐Head and Two‐Head Ductless Heat Pumps
Figure 7. Shows the average system capacity for single‐head units in various home‐size bins.
Figure 7. Average System Capacity by Home Size (Single‐head units)
19Most ductless heat pump installations (82%) occurred in heating zone 1, which has fewer HDDs than
Oregon’s other two heating zones and is where most of the population of Oregon lives. Heating zone 1
includes the Willamette Valley and Portland Metro area (including Hood River). See Appendix B for a full
list of counties in each heating zone. The other 18% of ductless heat pump installations occurred in
heating zone 2, which includes parts of Southern Oregon and Central Oregon (see Figure 8, below).
Figure 8. Ductless Heat Pump Installation by Region
Ductless Heat Pump System Costs
Whether participants installed one or two indoor units with their ductless heat pump system has a
strong impact on the cost of the system. The average cost of installation was $4,582 across all systems
(n=198). The average cost was $4,256 for systems with a single indoor unit (n=148) and $6,102 for
systems with two indoor units (n=30).8 As shown in Figure 9, ductless heat pump system costs varied
significantly. For single‐head systems the minimum installation cost was $1,208 and the maximum was
$6,975, with a standard error of $88.9 For two‐head systems the maximum cost was $9,397. Cadmus
presents results for systems with a single indoor unit in much of the following analysis.
8
The program data did not include the number of indoor units for 19 systems and one system included four
indoor units. The installation cost for the project with four indoor units was $8,715.
9
Although Cadmus did not verify the installation cost for the minimum cost retrofit, we did verify a similar
installation priced at $1,474, which suggests that some units really are installed at a very low cost.
20Figure 9. Installation Costs for Single‐Head and Two‐Head Ductless Heat Pumps
We also analyzed cost by installation year, system manufacturer, existing heating system, home size,
home age, ductless heat pump system capacity, HSPF, and region. Although relatively steady over time,
across home sizes, home age, brands, and system efficiency levels, we discovered notable trends in
installation costs by region and system capacity.
As shown in Figure 10, installation costs for ductless heat pumps in the Portland Metro region were on
average more than $557 (or 12%) higher than in the rest of Oregon (where the average installation cost
was $4,200). Most participants lived in the Willamette Valley and Southern Oregon and relatively few
lived in the North Coast or Portland Metro region.
21Figure 10. Installation Cost of Single‐Head Ductless Heat Pumps by Region
Average system costs increased with system capacity, as shown in Figure 11. Lower capacity systems
were on average over $1,000 cheaper than the highest capacity systems.
Figure 11. Installation Cost of Single‐Head Ductless Heat Pumps by System Capacity
Comparison of Ductless Heat Pumps with Ducted Heat Pumps
Cadmus compared the costs and savings (performance) of the two types of heat pump systems. Because
ducted systems were installed only in homes with electric furnaces, we compared these only with the
ductless heat pumps that had been installed in homes with forced‐air electric furnaces. Given the
22measures were offered under different program designs and not intended to be a perfect comparison,
the results should be interpreted with this context in mind.
Cost Comparison
Costs for ductless and ducted heat pumps in homes with electric furnaces were almost identical.
Average installation costs (in nominal dollars) were $4,501 for a ductless heat pump system with an
electric furnace and $4,511 for a ducted heat pump. However, we found that costs were much more
narrowly distributed for ducted systems than for ductless systems, as shown in Figure 12. The standard
error was $70 for the cost of ductless heat pumps in homes with electric furnaces and $22 for ducted
heat pumps.
Figure 12. Cost Comparison of Ductless and Ducted Heat Pumps
Four vetted trade ally contractors, selected through a competitive process, installed the ducted heat
pumps during the pilot. Customers paid a flat fee of $1,000, and Energy Trust paid contractors a flat
rate, based on the system size, for the balance of the installation.
Seventy‐two contractors installed the ductless heat pumps we analyzed. Energy Trust provided an
incentive of either $800 or $1,000 and the customer paid the remainder of the cost. One of the 72
contractors that installed ductless heat pumps was also a vetted contractor of Energy Trust’s ducted
heat pump pilot. This contractor installed one ductless heat pump.
23Performance Comparison
Cadmus compared the energy savings from 84 ductless heat pumps10 installed in homes with electric
furnaces to the energy savings of 78 ducted heat pumps and found that, across both heating zones, they
performed very similarly in terms of overall savings and savings per dollar of installed cost. However,
they had significantly different realization rates and savings per ton of installed capacity, as illustrated in
Table 10. We also analyzed the relative performance of ducted and ductless heat pumps in heating
zones 1 and 2. The performance of both types of heat pump was similar across the heating zones in
terms of annual savings, savings as a percentage of pre‐installation usage, and savings per dollar spent
on installation.
Table 10. Heat Pump Savings Comparison for Homes with Electric Furnaces
Heat Pump Savings Savings as Average Savings
Realization Average Savings
Per Unit % of Pre‐ na Capacity nb per $
Type Rate Cost ($) per Ton
(kWh) NAC (Tons) (kWh/$)
Overall Sample
Ductless Heat
3,324 22% 126% 84 $4,501 1.5 170 2,274 0.74
Pumps
Ducted Heat
3,269 21% 75% 78 $4,511 2.2 103 1,461 0.72
Pumps
Heating Zone 1
Ductless Heat
3,321 23% 124% 69 $4,492 1.5 30 2,254 0.74
Pumps
Ducted Heat
3,077 20% 73% 42 $4,403 2.3 51 1,324 0.70
Pumps
Heating Zone 2
Ductless Heat
3,333c 19% 133% 15 $4,542 1.4 140 2,363 0.73
Pumps
Ducted Heat
3,447 21% 76% 36 $4,617 2.2 52 1,600 0.75
Pumps
a n for savings analysis
b n for average cost
c The participant unadjusted savings and percent savings are nearly identical between the overall Zone 2 results (Table 6)
and for the electric furnace subgroup shown here, both at 11% savings and approximately 1900 kWh savings. The difference
between this value and the value reported in Table 6 is that the comparison group from Table 6 increased usage 954 kWh or
6%, while it increased by 1,364 kWh or 8% in this electric furnace sub‐group. The sample sizes are small, and it is uncertain
why the comparison groups differed in usage.
10
Eleven installations in manufactured homes with zonal electric heat were removed from this part of the
analysis.
24Conclusions and Recommendations
Ducted and ductless heat pumps provide similar savings at comparable costs. The billing analysis for
ducted and ductless heat pumps in manufactured homes showed almost identical savings on the basis
of annual kWh and percentage of pre‐installation usage for both system types. The annual savings for
homes with electric forced‐air furnaces were 3,324 kWh for ductless heat pumps and 3,269 kWh for
ducted heat pumps. Despite, or perhaps due to the difference in program delivery, average costs and
savings per dollar spent on system cost were also almost identical: $4,501 installed cost and 0.74 kWh
per dollar for ductless heat pumps and $4,511 installed cost and 0.72 kWh per dollar for ducted heat
pumps. Cadmus found greater variance in cost of the ductless heat pumps incentivized through the
market‐based program. Offering the ductless heat pump measure in conjunction with cost‐controls,
such as was done with the ducted heat pump pilot, should reduce the variance in cost and potentially
lower the average cost.
Recommendation: Offer incentives for both ducted and ductless heat pumps for manufactured
homes. Work with the PMC to explore whether the cost of a ductless heat pump retrofit will
respond to the same strategies used in the ducted heat pump pilot.
Although ducted and ductless heat pump savings are very similar, the realization rates for the two
systems differ. The billing analysis of the two system types showed a realization rate of 126% for
ductless heat pumps and 75% for ducted heat pumps in manufactured homes. This major difference
suggests that Energy Trust underestimated the savings for ductless heat pumps and overestimated the
savings of ducted heat pumps in manufactured homes.
Recommendation: Revise ex ante savings estimates for ductless and ducted heat pumps for
manufactured homes to more closely reflect evaluated savings.
Program design appears to significantly affect individual installation costs of ductless and ducted heat
pumps. There was higher variance in installation costs for ductless heat pumps than for ducted heat
pumps, despite the similarities in technology and housing stock. This variance is likely explained, in part,
by the different program designs. The ducted heat pump pilot was delivered by four vetted contractors
who were paid a fixed rate for the installation, whereas ductless heat pumps were installed by many
contractors in a market‐based program design. Although the average installation costs of these systems
were similar, customers installing a ductless heat pump had much more uncertainty in the price they
would pay. Such price inconsistency could affect uptake of this measure.
Recommendation: If Energy Trust chooses to move forward in promoting ductless and ducted
heat pumps in manufactured homes, it should consider the approach of its ducted heat pump
pilot for both technologies. With more consistent pricing, and potentially lower retrofit costs,
this design is likely to drive higher measure uptake than the market‐based design currently used
for ductless heat pumps.
25Ductless heat pump program data contained some errors and missing information. Cadmus reviewed
the program data for ductless heat pumps and selected a sample of projects that appeared to be
outliers and in need of further investigation. We compared the program data for these projects against
their original project documentation and found errors that indicate an opportunity for Energy Trust to
improve its data entry process. Cadmus also found fields in the program data that were frequently
missing information, such as the HSPF and SEER.
Recommendation: Conduct quality review checks of the program data against project
documents to improve the accuracy and completeness of the data. Consider prioritizing the
review of project files with values that appear to be missing or outliers.
26Appendix A – Additional Subgroup Analysis
Table 11 provides additional subgroup analysis for ductless heat pumps by various subgroups. The table shows that participants in PGE’s service
territory experienced higher energy savings than participants in PacifiCorps’ service territory. The table also shows that energy savings remain
relatively even across home sizes, but are larger for the oldest homes.
Table 11. Additional Subgroup Analysis
Savings as %
Average Savings (kWh) Realization Relative Precision
Group Sub‐Group n Pre‐NAC of Pre‐NAC
Rate at 90% Confidence
Evaluated Reported Evaluated Reported
Overall Overall 95 14,860 3,294 2,711 122% 19% 22% 18%
Zone Zone 1 77 14,342 3,389 2,736 124% 22% 24% 19%
Zone Zone 2 18 17,077 2,890 2,607 111% 35% 17% 15%
Utility PAC 59 14,903 2,558 2,693 95% 29% 17% 18%
Utility PGE 36 14,789 4,499 2,740 164% 25% 30% 19%
Pre Quartile Pre Q=1 All 25 8,260 1,368 2,827 48% 45% 17% 34%
Pre Quartile Pre Q=2 All 23 11,789 2,943 2,691 109% 32% 25% 23%
Pre Quartile Pre Q=3 All 23 16,223 3,893 2,701 144% 26% 24% 17%
Pre Quartile Pre Q=4 All 24 23,371 5,064 2,619 193% 34% 22% 11%
Pre Quartile by Zone Pre Q=1 Zone 1 20 7,465 1,141 2,798 41% 62% 15% 37%
Pre Quartile by Zone Pre Q=2 Zone 1 19 11,108 2,763 2,732 101% 36% 25% 25%
Pre Quartile by Zone Pre Q=3 Zone 1 19 15,643 4,098 2,744 149% 27% 26% 18%
Pre Quartile by Zone Pre Q=4 Zone 1 19 23,512 5,671 2,666 213% 33% 24% 11%
Pre Quartile by Zone Pre Q=1 Zone 2 5 11,441 2,277 2,942 77% 54% 20% 26%
Pre Quartile by Zone Pre Q=2 Zone 2 4 15,022 3,797 2,501 152% 73% 25% 17%
Pre Quartile by Zone Pre Q=3 Zone 2 4 18,977 2,920 2,501 117% 72% 15% 13%
Pre Quartile by Zone Pre Q=4 Zone 2 5 22,836 2,755 2,441 113% 89% 12% 11%
Pre Quartile by Utility Pre Q=1 PAC 15 7,530 1,177 2,701 44% 65% 16% 36%
Pre Quartile by Utility Pre Q=2 PAC 14 12,125 1,888 2,953 64% 69% 16% 24%
Pre Quartile by Utility Pre Q=3 PAC 16 16,586 4,118 2,576 160% 26% 25% 16%
27Savings as %
Average Savings (kWh) Realization Relative Precision
Group Sub‐Group n Pre‐NAC of Pre‐NAC
Rate at 90% Confidence
Evaluated Reported Evaluated Reported
Pre Quartile by Utility Pre Q=4 PAC 14 23,659 3,182 2,559 124% 64% 13% 11%
Pre Quartile by Utility Pre Q=1 PGE 9 8,048 1,660 2,934 57% 71% 21% 36%
Pre Quartile by Utility Pre Q=2 PGE 9 11,596 3,884 2,601 149% 30% 33% 22%
Pre Quartile by Utility Pre Q=3 PGE 9 15,707 5,240 2,714 193% 18% 33% 17%
Pre Quartile by Utility Pre Q=4 PGE 9 23,804 7,243 2,711 267% 46% 30% 11%
Sqft Quartile Sqft Q=1 All 24 13,742 3,540 2,771 128% 32% 26% 20%
Sqft Quartile Sqft Q=2 All 23 13,577 3,512 2,698 130% 48% 26% 20%
Sqft Quartile Sqft Q=3 All 25 14,086 2,843 2,718 105% 36% 20% 19%
Sqft Quartile Sqft Q=4 All 23 18,150 3,347 2,655 126% 39% 18% 15%
Sqft Quartile by Zone Sqft Q=1 Zone 1 21 13,591 3,059 2,756 111% 38% 23% 20%
Sqft Quartile by Zone Sqft Q=2 Zone 1 18 13,773 4,342 2,764 157% 49% 32% 20%
Sqft Quartile by Zone Sqft Q=3 Zone 1 16 11,619 2,313 2,805 82% 58% 20% 24%
Sqft Quartile by Zone Sqft Q=4 Zone 1 22 17,503 3,789 2,642 143% 33% 22% 15%
Sqft Quartile by Zone Sqft Q=1 Zone 2 5 13,006 2,171 2,725 80% 96% 17% 21%
Sqft Quartile by Zone Sqft Q=2 Zone 2 3 14,568 4,475 2,319 193% 30% 31% 16%
Sqft Quartile by Zone Sqft Q=3 Zone 2 4 22,260 3,669 2,396 153% 75% 16% 11%
Sqft Quartile by Zone Sqft Q=4 Zone 2 6 18,268 2,017 2,792 72% 92% 11% 15%
Sqft Quartile by Utility Sqft Q=1 PAC 16 13,458 2,323 2,774 84% 63% 17% 21%
Sqft Quartile by Utility Sqft Q=2 PAC 13 11,858 2,292 2,795 82% 56% 19% 24%
Sqft Quartile by Utility Sqft Q=3 PAC 11 16,253 2,738 2,552 107% 61% 17% 16%
Sqft Quartile by Utility Sqft Q=4 PAC 19 17,423 2,794 2,638 106% 56% 16% 15%
Sqft Quartile by Utility Sqft Q=1 PGE 10 13,512 3,766 2,713 139% 29% 28% 20%
Sqft Quartile by Utility Sqft Q=2 PGE 8 17,183 7,746 2,546 304% 48% 45% 15%
Sqft Quartile by Utility Sqft Q=3 PGE 9 10,685 2,455 2,933 84% 73% 23% 27%
Sqft Quartile by Utility Sqft Q=4 PGE 9 18,182 4,532 2,751 165% 30% 25% 15%
Energy Trust Region Central Oregon 13 16,281 3,070 2,694 114% 34% 19% 17%
28Savings as %
Average Savings (kWh) Realization Relative Precision
Group Sub‐Group n Pre‐NAC of Pre‐NAC
Rate at 90% Confidence
Evaluated Reported Evaluated Reported
Energy Trust Region North Coast 2 8,010 1,633 3,013 54% 170% 20% 38%
Portland Metro &
Energy Trust Region 12 13,252 3,498 2,758 127% 41% 26% 21%
Hood River
Energy Trust Region Southern Oregon 25 16,542 2,721 2,647 103% 51% 16% 16%
Energy Trust Region Willamette Valley 43 14,220 3,678 2,726 135% 28% 26% 19%
Vintage 1960‐1969 9 16,093 4,847 2,617 185% 42% 30% 16%
Vintage 1970‐1979 38 14,055 3,088 2,674 116% 39% 22% 19%
Vintage 1980‐1989 22 14,262 3,376 2,859 118% 37% 24% 20%
Vintage 1990‐1999 21 14,372 3,032 2,623 116% 32% 21% 18%
Vintage 2000‐2014 5 23,436 3,135 2,884 109% 91% 13% 12%
29Appendix B. Oregon Heating Zone by County
Oregon Oregon
County County
Heating Zone Heating Zone
Baker 2 Malheur 1
Benton 1 Marion 1
Clackamas 1 Morrow 1
Clatsop 1 Multnomah 1
Columbia 1 Polk 1
Coos 1 Sherman 2
Crook 2 Tillamook 1
Curry 1 Umatilla 1
Deschutes 2 Union 2
Douglas 1 Wallowa 3
Gilliam 1 Wasco 1
Grant 2 Washington 1
Harney 3 Wheeler 2
Hood River 1 Yamhill 1
Jackson 1
Jefferson 2
Josephine 1
Klamath 2
Lake 2
Lane 1
Lincoln 1
Linn 1
30You can also read