Patterns of relationship between PM10 from air monitoring quality station and AOT data from MODIS sensor onboard of Terra satellite
←
→
Page content transcription
If your browser does not render page correctly, please read the page content below
Scientific Review – Engineering and Environmental Sciences (2021), 30 (2), 236–249
Sci. Rev. Eng. Env. Sci. (2021), 30 (2)
Przegląd Naukowy – Inżynieria i Kształtowanie Środowiska (2021), 30 (2), 236–249
Prz. Nauk. Inż. Kszt. Środ. (2021), 30 (2)
http://iks.pn.sggw.pl
DOI 10.22630/PNIKS.2021.30.2.20

Winai SURIYA, Poramate CHUNPANG, Teerawong LAOSUWAN
Mahasarakham University, Faculty Science

Patterns of relationship between PM10 from air monitoring
quality station and AOT data from MODIS sensor onboard
of Terra satellite

Key words: remote sensing, MODIS sensor,          problem of air pollution (Suwanprasit,
PM10, aerosol optical thickness (AOT), air        Charoenpanyanet, Pardthaisong & Sin-
quality index (AQI)                               ampol, 2018). Also, there are other caus-
                                                  es including more transportation, more
                                                  burning of forest area and open area (Su-
Introduction                                      pasri, Intra, Jomjunyong & Sampattagul,
                                                  2018).
     Currently, Thailand, especially in                Particulate matter (PM) is the parti-
the northern region, is encountering air          cles consisting of nitrogen oxide (NOx),
pollutions due to smokes, accumulation            sulfur dioxide (SO2), ammonia (NH3),
of smokes or dust in the air, which are           polycyclic       aromatic       hydrocarbons
mostly caused by the burning of forest            (PAHs) which are combined and floating
area and open area for agricultural pur-          in the air in form of dust; it can be divided
pose. Also, the terrains in many areas in         by size – the one smaller than 2.5 μm, is
the northern region are characterized by          called PM2.5, and the one smaller than
“pan” shape, with plain areas surrounded          10 μm is called PM10 (Porter & Clarke,
by mountains, and the weather is quite            1997; Meng et al., 2019). Dust is the pol-
still and dry for a long period of time;          lution that mostly affects human than
these are the reason of the accumulation          other air pollutions. Particulate mat-
of pollution which cannot be ventilated,          ter comes from both nature such as soil
therefore, the concentration of pollution         dust, sand dust, and from the matter on
is quite high especially in the urban area.       the ground blown by wind, smoke from
This causes such area to encounter the            wild fire, salty particles from seawater

236                                                      W. Suriya, P. Chunpang, T. Laosuwan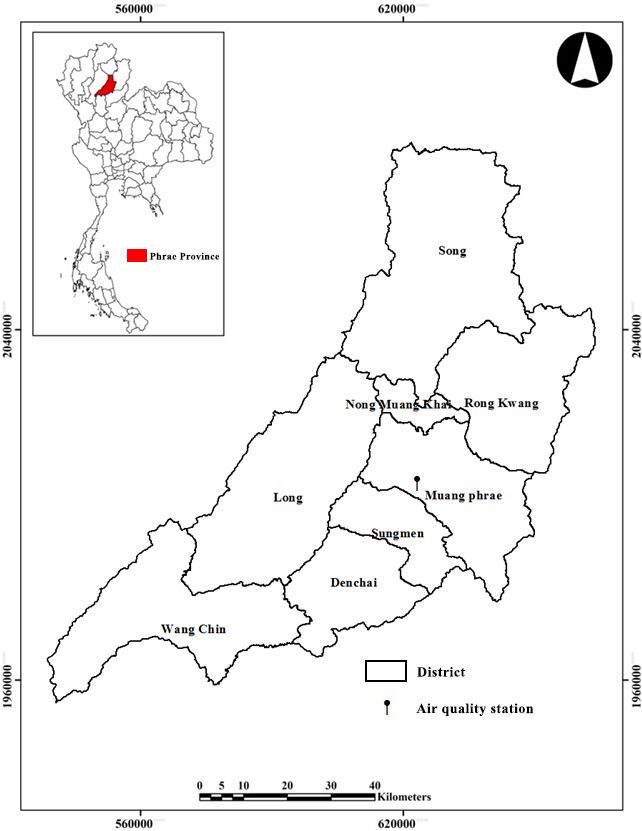
and comes from human activities such as           high, and in some monitoring stations it
dust from construction, dust from trans-          is not possible to perform real-time moni-
portation on road, smoke released from            toring which results in the limitation on
exhaust pipe of car and motorcycle, dust          the monitoring of dust in terms of space
and smoke from chimney from cremato-              and time (Outapa & Ivanovitch, 2019).
rium, incinerator of industrial plant, and        However, the problem related to dust or
the burning of agricultural residues in           PM in the northern region needs to be
open area (Pollution Control Department           solved immediately.
[PCD], 2004; Nathapindhu, Sttheetham                  According to the related researches,
& Ketkowit, 2011; World Health Or-                it was found that at present, the remote
ganization [WHO], 2017). The danger of            sensing technology was applied by us-
dust traveling into the respiratory system        ing data received from the satellite in
depends on the size, quantity, chemi-             monitoring and following the air qual-
cal properties, and biological qualities.         ity situations (Liu, Sarnat, Kilaru, Jacob
Dust, once travelling into the respiratory        & Koutrakis, 2005; Kloog, Koutrakis,
system, would accumulate in various               Coull, Lee & Schwartz, 2011; Nguyen,
parts of the respiratory system, depend-          Cressie & Braverman, 2012; Benas, Be-
ing on its size; the rough dust would be          loconi & Chrysoulakis, 2013; Vienneau
filtered by nose hair and thus falling onto       et al., 2013; Phayungwiwatthanakoon,
the primary respiratory system, and the           Suwanwaree & Dasamanda 2014; He &
fine dust and the very fine dust would            Huang, 2018). The remote sensing is the
pass into the bronchus, bronchiole, and           modern and efficient technology that can
deep into the alveoli. If a large quantity        be applied to monitor and inspect vari-
of dust is inhaled, it would affect health        ous phenomena on Earth in time (Sukit-
a lot accordingly (Adams, Greenbaum,              paneenit & Oanh, 2014; Emetere, Sanni,
Shaikh, van Erp & Russel, 2015; Green-            Okoro & Adeyemi, 2018; Rotjanakusol
Facts, 2018; United States Environmen-            & Laosuwan, 2018, 2019; Uttaruk &
tal Protection Agency [USEPA], 2018).             Laosuwan, 2019). Due to the importance
     Particulate matter PM10 is the serious       of monitoring and following up the air
problem of air pollution in the northern          quality circumstance, this study aims
region, which is mostly caused by the             to find patterns of relationship between
burning of forest area and open area and is       PM10 from the air quality station and
clearly seen during January–April of eve-         AOT data received from MODIS sensor
ry year (Amphanthong & Busababodhin,              onboard of Terra satellite in Phrae Prov-
2015). The monitoring of PM10 quantity            ince, the northern region of Thailand.
can be done by the inspection performed
at the Ground Monitoring Station of Pol-
lution Control Department (PCD) and the           Studying area and satellite data
Thai Meteorological Department (TMD);
it is not possible to install the station in          Studying area. Phrae Province
all critical areas due to the fact that the air   (Fig. 1) is located in the northern region of
monitoring device is large, the expense           Thailand, with the area of 6,538.59 km2,
spent in the operation and maintenance is         between the latitude of 17.70° to 18.84°N

Patterns of relationship between PM10 from air monitoring quality station...               237
to the longitude of 99.58° to 100.32°E; it radiometer (MODIS) sensors, the aero-
is 155 m high from moderate sea level. sol optical thickness (AOT) on land and
The province is surrounded by moun- ocean would be of the Level 2 Prod-
tains in four directions; most of the area, uct with the resolution of the image of
about 80%, are mountainous with the 10 × 10 km2 at and is the near-real-time
plain area of only 20%. The average air product data. Therefore, in this study,
temperature in Phrae in the whole year is the data from MODIS sensor onboard
about 26.4°C, with the average minimum of Terra satellite was applied with the
temperature of 21.6°C and with average code of MODO4_L2 Aerosol Product
maximum temperature of 33.2°C. (Optical_Depth_Land_And_Ocean).
Data used in the study. Data of The MODO4_L2 Aerosol Product file
Moderate Resolution Imaging Spectro- covers a five-minute time interval. The
FIGURE 1. Phrae Province, the northern region of Thailand
238 W. Suriya, P. Chunpang, T. Laosuwanoutput grid is 135 pixels in width by ¦ ( X i − X )(Yi − Y )
203 pixels in length. Every tenth file has r= (1)
¦ ( X i − X ) ¦ (Yi − Y )
2 2
an output grid size of 135 by 204 pix-
els. The MOD04_L2 Aerosol Product
files are stored in hierarchical data for- where:
mat (HDF). The data was downloaded r = 1 – perfect positive correlation,
from web interface LAADS DAAC (ht- r = –1 – perfect negative correlation.
tps://ladsweb.modaps.eosdis.nasa.gov);
the duration of 10.00–11.00 am at local The result of the analysis would
time was selected when the MODIS sen- yield correlation coefficient (r) which
sor onboard of Terra satellite orbit passes indicated the extent of relationship of
Thailand. Data used were on daily basis the data, for linear regression analysis
from 1st January to 30th April 2018. (Eq. 2), which is one statistical method
Ground temperature data. In this for examining the relationship between
study, the data of PM10 on hourly basis was two or more variables; this is divided
collected in the period from 1st January to into independent variable x and depend-
30th April 2018 during 10.00–11.00 am ent variable y. In this research, x is PM10
from the air quality station of the air4thai quantity from the air quality station of
(http://air4thai.pcd.go.th/webV2) located the air4thai and y is AOT data received
at Mueang District, Phrae Province, lo- from MODIS sensor onboard of Terra
cated Na Chak Subdistrict, Mueang Dis- satellite at the coordinate of the ground
trict, Phrae Province, with the latitude of monitoring station.
18.13°N and longitude of 100.16°E.
y = ax + b (2)
Methodology where:
x – independent variable,
Since AOT data received from y – dependent variable.
MODIS sensor onboard of Terra satellite
is in HDF or granule coverage, so before Besides, PM10 quantity obtained
analyzing AOT data, it is necessary to ad- from the monitoring station was brought
just the projection systems by georefer- to replace the value in the linear regres-
ence. In this study, the projection systems sion equality of each month in order to
were determined to be UTM WGS-84 see the density of PM10 in spatial term.
zone 47; after that, the adjusted data Finally, the distribution map of PM10 was
were brought for numerical analysis of created in spatial term under AQI which
AOT further. In this research, the cor- is the report on the weather in simple and
relation analysis using software package easy-to-understand form in order to dis-
was performed (Eq. 1) to study the rela- seminate such data to the public so that
tionship between PM10 quantity from the they could be informed of the air pollu-
air quality station of the air4thai with the tion situations. Various countries would
AOT data received from Terra MODIS have their own AQI – Thailand in this
satellite. study.
Patterns of relationship between PM10 from air monitoring quality station... 239Result of the study linear regression analysis of duration
between January and April are shown
The results of the analysis into the in Figures 2–5. In January, the data col-
relationship between PM10 and AOT lection from MODIS sensor onboard of
by using statistical method that is cor- Terra satellite (AOT) and air quality sta-
relation analysis are shown in Table 1. tions (PM10) was shown in Table 2.
According to Table 2, it was found that From Figure 2, it shows the relation-
in overall, PM10 and AOT are highly ship between the quantity of PM10 and
related, with the correlation coefficient AOT in January of Phrae Province; when
in January of r = 0.928, in February of PM10 increased, AOT would increase ac-
r = 0.919, in March of r = 0.916, and cordingly. On the contrary, when PM10
in April of r = 0.927. The results of the decreased, AOT would also decrease.
According to the linear regression analy-
TABLE 1. Correlation coefficient (r) between sis, it was found that the minimum PM10
PM10 and AOT in Thailand in 2018 in selected was 30 μg·m–3 and maximum PM10 was
months
79 μg·m–3. The linear regression equality
Month r y = 97.679x – 0.7215 and the coefficient
January 0.928 in making decision of r2 was 0.983.
February 0.919 In February, the data collection from
MODIS sensor onboard of Terra satellite
March 0.916
(AOT) and air quality stations (PM10)
April 0.927 was shown in Table 3.
TABLE 2. Data collected from MODIS sensor onboard of Terra satellite and the air quality stations in
Thailand in January 2018
PM10 PM10
Date AOT Date AOT
[μg·m–3] [μg·m–3]
5 0.309 30 19 0.408 41
6 0.325 31 20 0.457 46
7 0.358 34 21 0.498 48
8 0.601 59 22 0.553 52
9 0.481 45 23 0.715 71
10 0.449 42 24 0.708 70
11 0.426 41 25 0.562 55
12 0.384 36 26 0.821 79
14 0.393 36 27 0.801 76
15 0.452 44 28 0.547 57
16 0.391 38 29 0.485 49
17 0.486 46 30 0.491 45
18 0.479 43 31 0.624 57
240 W. Suriya, P. Chunpang, T. LaosuwanFIGURE 2. Linear regression between PM10 and AOT in Thailand in January 2018
TABLE 3. Data collected from MODIS sensor onboard of Terra satellite (AOT) and the air quality sta-
tions (PM10) in Thailand in February 2018
PM10 PM10
Date AOT Date AOT
[μg·m–3] [μg·m–3]
1 0.603 61 14 0.726 71
2 0.521 51 15 0.887 89
3 0.694 68 16 0.862 84
4 0.635 62 17 0.712 70
5 0.782 75 18 0.631 68
6 0.891 86 19 0.993 97
7 0.973 91 20 0.922 93
8 0.987 96 21 0.876 85
9 1.108 102 23 0.472 44
10 0.921 93 25 0.486 47
11 0.902 94 26 0.553 52
12 0.915 97 28 0.476 48
13 0.841 81
From Figure 3, it shows the relation- According to the linear regression analy-
ship between the quantity of PM10 and sis, it was found that the minimum PM10
AOT in February of Phrae Province; when was 44 μg·m–3 and maximum PM10 was
PM10 increased, the AOT would increase 102 μg·m–3. The linear regression equality
accordingly. On the contrary, when PM10 y = 96.643x + 1.3248 and the coefficient
decreased, AOT would also decrease. in making decision of r2 was 0.9719.
Patterns of relationship between PM10 from air monitoring quality station... 241FIGURE 3. Linear regression between PM10 and AOT in Thailand in February 2018
In March, the data collection from PM10 increased, the AOT would increase
Terra MODIS satellite (AOT) and air qual- accordingly. On the contrary, when PM10
ity stations (PM10) was shown in Table 4. decreased, AOT would also decrease. Ac-
From Figure 4, it shows the relation- cording to the linear regression analysis,
ship between the quantity of PM10 and it was found that the minimum PM10
AOT in March of Phrae Province; when was 58 μg·m–3 and maximum PM10 was
TABLE 4. Data collected from Terra MODIS satellite (AOT) and the air quality stations (PM10) in
Thailand in March 2018
PM10 PM10
Date AOT Date AOT
[μg·m–3] [μg·m–3]
2 0.587 76 18 0.681 86
3 0.596 77 19 0.807 98
4 0.773 93 20 0.954 112
5 1.064 118 21 1.136 132
6 1.663 184 22 0.975 101
7 1.134 139 23 0.682 88
8 0.981 112 24 0.691 88
9 0.394 58 25 0.741 91
11 0.403 59 26 0.809 100
13 0.449 63 27 0.748 92
14 0.561 76 28 0.759 92
15 0.846 107 29 0.862 102
16 0.908 112 30 0.754 93
17 0.795 97 31 0.783 91
242 W. Suriya, P. Chunpang, T. LaosuwanFIGURE 4. Linear regression between PM10 and AOT in Thailand in March 2018
184 μg·m–3. The linear regression equal- From Figure 5, it shows the relation-
ity y = 98.335x + 18.588 and the coeffi- ship between the quantity of PM10 and
cient in making decision of r2 was 0.9777. AOT in April of Phrae Province; when
In April, the data collection from PM10 increased, AOT would increase ac-
MODIS sensor onboard of Terra satellite cordingly. On the contrary, when PM10
(AOT) and air quality stations (PM10) decreased, AOT would also decrease.
was shown in Table 5. According to the linear regression analy-
TABLE 5. Data collected from MODIS sensor onboard of Terra satellite (AOT) and the air quality sta-
tions (PM10) in Thailand in March 2018
PM10 PM10
Date AOT Date AOT
[μg·m–3] [μg·m–3]
1 0.782 56 17 0.526 32
2 0.754 52 19 0.572 37
3 0.761 50 20 0.754 56
4 0.857 66 21 0.952 74
5 0.731 53 22 1.132 90
7 0.586 37 23 1.053 87
9 0.706 51 24 1.204 99
10 0.701 47 25 1.426 114
11 0.864 65 26 0.857 65
12 0.947 78 27 0.535 32
13 1.065 84 28 0.554 31
14 1.075 82 29 0.493 21
15 1.063 85 30 0.482 24
16 0.725 54
Patterns of relationship between PM10 from air monitoring quality station... 243FIGURE 5. Linear regression between PM10 and AOT in Thailand in April 2018
sis, it was found that the minimum PM10 of air and the quality of air affected the
was 21 μg·m–3 and maximum PM10 was health in February. The people who live
114 μg·m–3. The linear regression equal- in the blue area and green area can do
ity y = 99.137x – 21.28 and the coefficient outdoor activities and tour normally; and
in making decision of r2 was 0.9861. the people who live in yellow zone can
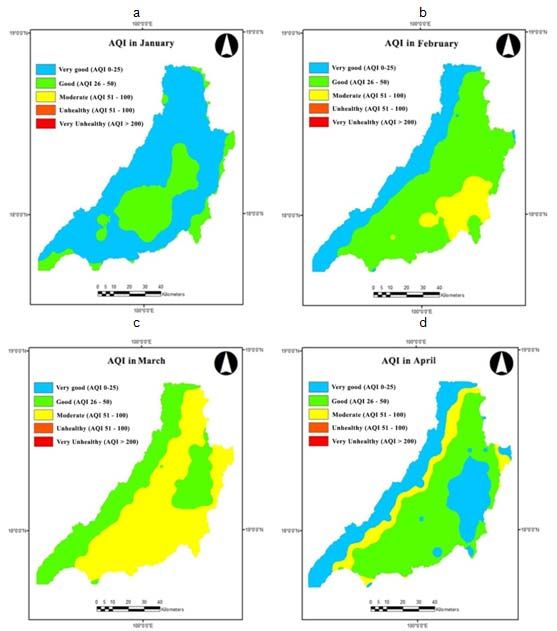
Furthermore, the result of the distri- do outdoor activities normally except for
bution map creation of PM10 in spatial someone who is vulnerable was found to
term under AQI of Thailand (Table 6) to have primary symptom such as cough,
show that whether PM10 has effect on being hard to breathe, eye irritation;
the health or not can be seen from the so, the period of time to do outdoor ac-
entire Figure 6. According to Figure 6a, tivities should be reduced. According to
it was found that Phrae Province had air Figure 6c, it was found that Phrae Prov-
of good quality and moderate quality in ince had moderate quality and the qual-
January; the people can do outdoor activ- ity of air affected the health in March.
ities and tour normally. From Figure 6b, The people who live in the blue area and
it was found that Phrae Province had green area can do outdoor activities and
good quality of air and moderate quality tour normally; and the people who live
TABLE 6. Criteria for AQI in Thailand
PM10
AQI Levels of health concern Colors
[μg·m–3]
0–25 0–50 very good blue
26–50 51–80 good green
51–100 81–120 moderate yellow
101–200 121–180 unhealthy orange
> 201 181 very unhealthy red
244 W. Suriya, P. Chunpang, T. LaosuwanFIGURE 6. The air quality index in Thailand in 2018 in selected months: a – January; b – February; c – March; d – April in yellow zone can do outdoor activi- time to do outdoor activities should be ties normally except for someone who reduced. From Figure 6d, it was found is vulnerable was found to have primary that Phrae Province had good quality of symptom such as cough, being hard to air and moderate quality of air and the breathe, eye irritation; so, the period of quality of air affected the health in April. Patterns of relationship between PM10 from air monitoring quality station... 245
The people who live in the blue area and      and dependent variable (y) were consist-
green area can do outdoor activities and      ent, with the coefficient of decision of r2
tour normally; and the people who live        being near 1 in every month also. In Feb-
in yellow zone can do outdoor activi-         ruary–April period in Phrae Province,
ties normally except for someone who          it was the time when quantity of PM10
is vulnerable was found to have primary       affected health according to the AQI
symptom such as cough, being hard to          standard of Thailand. In addition, the
breathe, eye irritation; so, the period of    result from this research was consistent
time to do outdoor activities should be       and was in the same direction with the
reduced.                                      research on “Satellite measurements of
    In addition, PM10 is a major air pollu-   aerosol optical depth and carbon monox-
tion problem in Northern Thailand. The        ide and comparison with ground data” by
problem is evident during the dry season      Lalitaporn and Mekaumnuaychai (2020),
from December to April each year. As          which indicated PM10. High levels of
a result of this study, it was found that     PM10 occur more frequently from March
the most common problem of PM10 was           to April. Furthermore, PM10 is higher in
in March, during which time. However,         the morning than in the afternoon.
the main causes of PM10 in Northern                In bringing AOT data obtained from
Thailand are caused by open-air burn-         MODIS sensor onboard of Terra satellite
ing activities, forest fires, agricultural    to be applied in this research, the advan-
waste incineration, incineration, and the     tage was that this was near-real-time data
occurrence of forest fires in neighboring     and covered wide area (10 × 10 km2 per
countries.                                    1 pixel). However, AOT data were clas-
                                              sified by passive remote sensing system,
                                              with disadvantage of that in some days,
Conclusions                                   there might be cloud over the area mak-
                                              ing it impossible to monitor AOT quanti-
     According to the study into the pat-     ty. On part of PM10 data from the ground
tern of relationship between PM10 from        monitoring station, the advantage was
the ground monitoring station of the          that it was PM10 which was monitored
air4thai with AOT data received from          by direct sensor; but with disadvantage
MODIS sensor onboard of Terra satellite       that was that the PM10 monitoring tool
in Phrae Province, the northern region        cannot be installed in the station of all
of Thailand during January–April 2018,        critical area since such air monitoring
it was under the objective. It was found      tool is large and the budget to be spent
from the research that in March, PM10         on the operation and the maintenance is
was highest equal to 184 μg·m–3. In Jan-      high.
uary, where PM10 was lowest was equal
to 79 μg·m–3; the change of PM10 quan-        Acknowledgements
tity and AOT was highly related (near 1)
in every month. Besides, when the lin-            This research was financially sup-
ear regression analysis was performed, it     ported by Mahasarakham University
was found that independent variable (x)       (Grant year 2021).

246                                                 W. Suriya, P. Chunpang, T. Laosuwan
References ellite remote sensing. Environmental Science
& Technology, 39(9), 3269-3278. https://doi.
Adams, K., Greenbaum, D.S., Shaikh, R., Erp, org/10.1021/es049352m
A.M. van & Russell, A.G. (2015). Particulate Meng, X., Wu, Y., Pan, Z., Wang, H., Yin, G. &
matter components, sources, and health: Sys- Zhao, H. (2019). Seasonal Characteristics
tematic approaches to testing effects. Journal and Particle-size Distributions of Particulate
of the Air & Waste Management Association, Air Pollutants in Urumqi. International Jour-
65(5), 544-558. https://doi.org/10.1080/1096 nal of Environmental Research and Public
2247.2014.1001884 Health, 16(3), 396. https://doi.org/10.3390/
Amphanthong, P. & Busababodhin, P. (2015). ijerph16030396
Forecasting PM10 in the Upper Northern Nathapindhu, G., Sttheetham, D. & Ketkowit, K.
Area of Thailand with Grey System Theory. (2011). Public Participation in Open Burn-
Burapha Science Journal, 20(1), 15-24. ing Control. KKU Research Journal, 16(4),
Benas, N., Beloconi, A. & Chrysoulakis, N. 408-415.
(2013). Estimation of urban PM10 con- Nguyen, H., Cressie, N. & Braverman, A. (2012).
centration, based on MODIS and MERIS/ Spatial statistical data fusion for remote sens-
/AATSR synergistic observations. Atmos- ing applications. Journal of the American
pheric Environment, 79, 448-454. https://doi. Statistical Association, 107(499), 1004-1018.
org/10.1016/j.atmosenv.2013.07.012 https://doi.org/10.1080/01621459.2012.
Emetere, M.E., Sanni, S.E., Okoro, E.E. & 694717
Adeyemi, G.A. (2018). Aerosol loading and Outapa, P. & Ivanovitch, K. (2019). The effect of
its effect on respiratory dysfunction disor- seasonal variation and meteorological data
der over Dapaong-Togo. Scientific Review on PM10 concentrations in Northern Thai-
Engineering and Environmental Sciences, land. International Journal of GEOMATE,
27(4), 410-424. https://doi.org/10.22630/ 16(56), 46-53. https://doi.org/10.21660/201
PNIKS.2018.27.4.40 9.56.4558
GreenFacts (2018). Air pollution particulate mat- Phayungwiwatthanakoon, C., Suwanwaree, P.,
ter. Retrieved from: https://www.greenfacts. Dasananda, S. (2014). Application of new
org/en/particulate-matter-pm/level-2/01- MODIS-based Aerosol Index for Air Pol-
presentation.htm [access 15.08.2020]. lution Severity Assessment and Mapping
He, Q. & Huang, B. (2018). Satellite-based map- in Upper Northern Thailand. Environ-
ping of daily high-resolution ground PM2.5 ment Asia, 7(2), 133-141. https://doi.
in China via space-time regression modeling. org/10.14456/ea.2014.32
Remote Sensing of Environment, 206, 72-83. Pollution Control Department [PCD] (2004).
https://doi.org/10.1016/j.rse.2017.12.018 Air pollution. Retrieved from: http://www.
Kloog, I., Koutrakis, P., Coull, B.A., Lee, H.J. & pcd.go.th/ info_serv/air_dust.htm [access
Schwartz, J. (2011). Assessing temporally 04.05.2020].
and spatially resolved PM2.5 exposures for Porter, J.N. & Clarke, A.D. (1997). Aerosol size
epidemiological studies using satellite aero- distribution models based on in situ measure-
sol optical depth measurements. Atmospheric ments. Journal of Geophysical Research At-
Environment, 45(35), 6267-6275. https://doi. mospheres, 102(D5), 6035-6045. https://doi.
org/10.1016/j.atmosenv.2011.08.066 org/10.1029/96JD03403
Lalitaporn, P. & Mekaumnuaychai, T. (2020). Rotjanakusol, T. & Laosuwan, T. (2018). Estima-
Satellite measurements of aerosol optical tion of land surface temperature using Land-
depth and carbon monoxide and comparison sat satellite data: a case study of Mueang
with ground data. Environmental Monitor- Maha Sarakham District, Maha Sarakham
ing and Assessment, 192, 369. https://doi. Province, Thailand for the years 2006 and
org/10.1007/s10661-020-08346-7 2015. Scientific Review Engineering and
Liu, Y., Sarnat, J.A., Kilaru, V., Jacob, D.J. & Environmental Sciences, 27(4), 401-409.
Koutrakis, P. (2005). Estimating ground-level https://doi.org/10.22630/PNIKS.2018.27.
PM2.5 in the eastern United States using sat- 4.39
Patterns of relationship between PM10 from air monitoring quality station... 247Rotjanakusol, T. & Laosuwan, T. (2019). Drought Summary
Evaluation with NDVI-Based Standardized
Vegetation Index in Lower Northeastern
Patterns of relationship between PM10
Region of Thailand. Geographia Technica,
from air monitoring quality station and
14(1), 118-130. https://doi.org/10.21163/
GT_2019.141.09
AOT data from MODIS sensor onboard
Sukitpaneenit, M. & Oanh, N.T.K. (2014). of Terra satellite. Thailand, especially in the
Satellite monitoring for carbon monoxide northern region, often encounters the prob-
and particulate matter during forest fire lem of having PM10 exceeding the normal
episodes in Northern Thailand. Environ- standard level, which could do harm to peo-
mental Monitoring and Assessment, 186(4), ple’s health. Mostly, such problem is caused
2495-2504. https://doi.org/10.1007/s10661 by the burning of forest area and open area;
-013-3556-x this is clearly seen during January–April of
Suwanprasit, C., Charoenpanyanet, A., Pardthai- every year. Also, the problem as mentioned
song, L. & Sin-ampol, P. (2018). Spatial and is caused by the meteorological conditions
temporal variations of satellite-derived PM10 and the terrains in the northern region that
of Chiang Mai: an exploratory analysis. Pro- make it easy for PM10 to be accumulated.
cedia Engineering, 212, 141-148. https://doi. The aim of this study was to analyze the pat-
org/10.1016/j.proeng.2018.01.019 terns of relationship between PM10 measured
Supasri, T., Intra, P., Jomjunyong, S. & Sampatt- from the ground monitoring station and AOT
agul, S. (2018). Evaluation of Particulate data received from MODIS sensor onboard
Matter Concentration by Using a Wireless of Terra satellite in Phrae Province located in
Sensor System for Continuous Monitoring the northern region of Thailand. The method
of Particulate Air Pollution in Northern of performed was by analyzing the correla-
Thailand. Journal of Innovative Technology
tion between PM10 data obtained from the
Research, 2(1), 69-83.
ground monitoring station and the AOT data
United States Environmental Protection Agency
[USEPA] (2018). Particulate Matter (PM)
received from the MODIS sensor onboard of
Pollution. Retrieved from: https://www.epa. Terra satellite during January–April 2018. It
gov/pm-pollution/particulate-matter-pm-ba- was found from the study that the change of
sics [access 20.01.2020]. the intensity of PM10 and AOT in the climate
Uttaruk, Y. & Laosuwan, T. (2019). Drought Ana- was highly related; it appeared that the cor-
lysis Using Satellite-Based Data and Spectral relation coefficient (r) in January–April was
Index in Upper Northeastern Thailand. 0.92, 0.91, 0.91 and 0.92, respectively. This
Polish Journal of Environmental Studies, research pointed out that during February–
28(6), 4447-4454. https://doi.org/10.15244/ –April, the areas of Phrae Province had the
pjoes/94998 level of PM10 that affected health. Besides,
Vienneau, D., Hoogh, K. de, Bechle, M.J., Bee- from the method in this research, it revealed
len, R., Donkelaar, A. van, Martin, R.V., Mil- AOT data received from MODIS sensor on-
let, D.B., Hoek, G. & Marshall, J.D. (2013). board of Terra satellite could be applied in
Western European land use regression incor- order to follow up, monitor, and notify the
porating satellite- and ground-based meas- spatial changes of PM10 efficiently.
urements of NO2 and PM10. Environmental
Science & Technology, 47(23), 13555-13564.
https://doi.org/10.1021/es403089q Authors’ address:
World Health Organization [WHO] (2017). Air Winai Suriya
pollution. Retrieved from: https://www.who. (https://orcid.org/0000-0003-2214-4294)
int/docs/default-source/thailand/air-pollu- Mahasarakham University
tion/briefing-on-air-pollution-th-thai.pdf? Faculty of Science
sfvrsn=408572d4_2 [access 02.10.2020]. Department of Physics
Kham Riang, Kantarawichai
248 W. Suriya, P. Chunpang, T. LaosuwanMaha Sarakham, 44150 Thailand e-mail: kroowinai@hotmail.co.th Poramate Chunpang (https://orcid.org/0000-0003-1721-1202) Mahasarakham University Faculty of Science Space Technology and Geoinformatics Research Unit Kham Riang, Kantarawichai Maha Sarakham, 44150 Thailand e-mail: poramate_c@hotmail.com Teerawong Laosuwan – corresponding author (https://orcid.org/0000-0002-4231-9285) Mahasarakham University Faculty of Science Department of Physics Space Technology and Geoinformatics Research Unit Kham Riang, Kantarawichai Maha Sarakham, 44150 Thailand e-mail: teerawong@msu.ac.th Patterns of relationship between PM10 from air monitoring quality station... 249
You can also read