2020 Smartphone launch - July, 2020 MICROSOFT ADVERTISING
←
→
Page content transcription
If your browser does not render page correctly, please read the page content below

2020 Smartphone launch
  July, 2020

MICROSOFT ADVERTISING
Key Findings
                                                                                                                                                  Microsoft
                                                                                                                     Audience
    COVID-19                    Projections                         5G                   Query path                                               Audience
                                                                                                                      insights
                                                                                                                                                  Network

Survey research shows       Non-brand phone               5G is heating up. Carrier   Post COVID-19 we see       The majority of            The Microsoft Audience
that most respondents       searches are expected to      associations with 5G is     non-brand queries          Microsoft Network users    Network should be an
will not feel comfortable   nearly double year-over-      changing as a result of     increasingly showing up    are iPhone owners          important part of your
in-store shopping this      year (YoY) from positive      news, paid media, and       in paths and becoming a                               activation plan with
holiday season.             momentum so far in 2020       network development.        larger part of the         Additionally, mobile       Microsoft Advertising
Advertisers should                                        T-Mobile is growing         consumer search            phone customers are
prepare for online-heavy    While Apple searches are      share of mind.              journey. Using non-        also frequently in the     Click volume for Tech &
shopping.                   expected to increase, they                                brand strategically to     market for computers       Telco advertisers on the
                            may not see as big of a       Bing users need more        influence a consumer       and computer               Audience Network has
Research also shows that    spike as device launch        awareness as to why 5G      over time to search on     gadgets/gear. Customers    grown significantly in 2020
the sale of online          2019. Samsung, however,       is relevant to them- it     your brand will            in the market for mobile
handsets drastically        with multiple 5G devices      may influence decisions     significantly help as      phone service providers    Technology advertisers have
increased from 2019 to      coming, is predicted to       to buy 5G products.         paths that start with a    are frequently in the      experienced a notable lift in
2020 with this trend        spike slightly higher than                                brand query will have a    market for toys and        Search activity from users
likely to continue          2019.                         Apple 5G association        much higher probability    games.                     who have seen their
                                                          continues to be a force     of that path ending in a                              Audience Network ads
COVID-19 is changing        5G search volume is           and will be even more so    click on that brand        The majority of
the way Microsoft           experiencing the most         post launch, especially     related query.             Microsoft network users    All creative and targeting
Network users switch        growth YoY. Searches for      with the wave of Super                                 are loyal to the           strategies from Search can
phone brands and use        older phone models also       Cycle upgraders                                        smartphone brand they      be extended for further
bandwidth                   picked up post-COVID,         deciding what to                                       currently own and also     reach in Native
                            with this trend expected to   purchase next                                          price conscious
                            continue.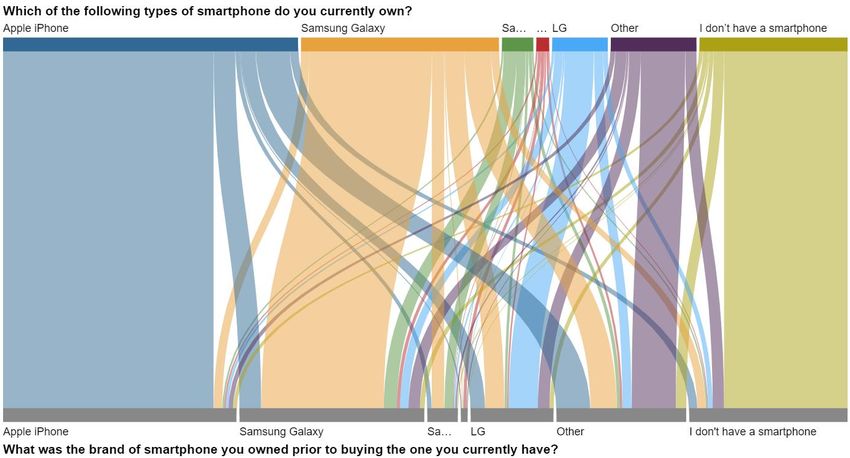
Summary of findings
           1
           2   COVID-19

           3   Projections
Contents
           4   5G updates

               Query paths &
           5   T-Mobile and Sprint
               Audience insights and Microsoft
           6   Audience Network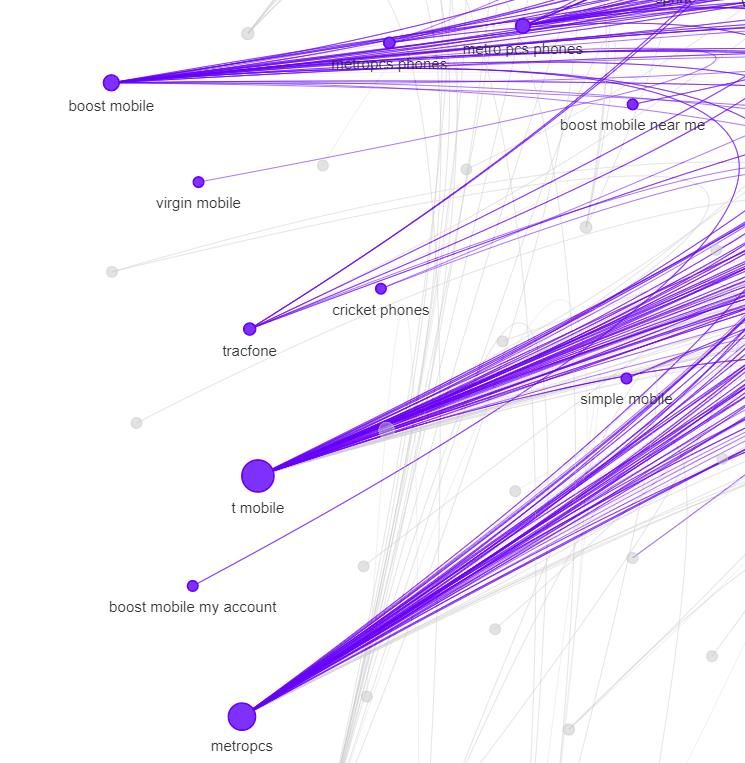
Device launch amid the COVID-19 pandemic
How is the pandemic affecting the technology hardware market?
Forecast for U.S. consumer electronic sales for 2020

                                                                “Estimates are that over 1/3 of iPhones
                                                                used globally are in “upgrade-window”,
                                     2020 forecast (in units)   something Apple are very excited about
                                                                given increased savings combined with
            Laptops         46-51M                              the release of 5G products this Fall.”

                                                                            - www.marketwatch.com

                   TVs     34-37M

    Smartphones                       138-153M

                                         Low     High
   Source: Statista 2020
Online sales of smartphones in 2020
The affect of COVID-19 on how consumers purchase smartphone

                                                                                    In 2019 the online share of
                                                                                    handset sales was 25% in China
40%                                                                                 and 14% in the U.S.. As of April
                                                                                    2020, almost 35% of handset
35%                                                                                 sales have been online in the
                                                                                    U.S. compared to ~30% in China.
30%

                                                                                    Retailers should expect that the
25%                                                                                 sale of handsets to continue

20%

15%

10%
                       January             February                 March   April

                                                      China   USA

      Source: Counterpoint Research 2020
What will it take to get shoppers back in stores?
Customers sentiment on when shopping will resume at local stores

                                                                                                                             Shopper sentiment on
                            91%               91%
                                                                                                                         returning to in-store shopping
                                                                                                                           indicates that retailers and
                                                                                                                           advertisers should plan for
                                                                     74%
                                                                                                                         online-focused holiday season
                                                                                            62%

                                                                                                                   33%

                                                                                                                                             4%

            Available vaccine and/or   No new cases in my   Number of new cases in   Government removes   I'm already comfortable I would never do this,
                 drugs to treat             country           my country slows           restrictions      doing this or will be as even after we return to
                                                                                                            soon as they reopen        "normal" times

   Source: Statista April 2020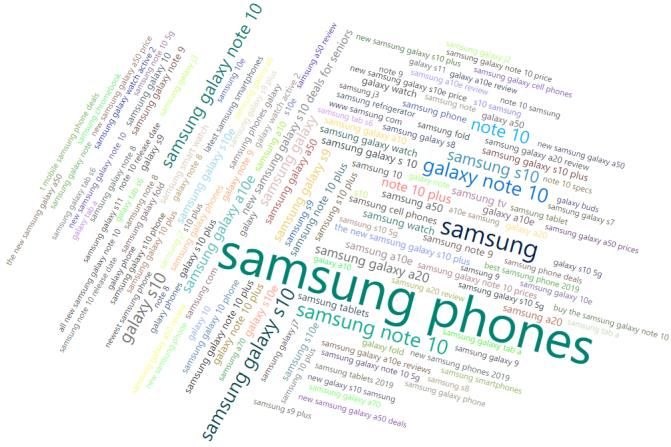
U.S. consumers are shopping much less in stores
Data from market research firm CivicScience states that 77% of customers are shopping less in stores while 31%
are shopping more online

   Are you shopping in stores (not including for groceries)                  Are you shopping online (not including for groceries)
   more or less than you typically would this time of year?                  more or less than you typically would this time of year?

            Much less                                                 57%         Much less           13%

     Somewhat less                                     20%                    Somewhat less      9%

   The same amount                                  18%                     The same amount                                   47%

    Somewhat more                3%                                          Somewhat more                  20%

          Much more             2%                                               Much more         11%

    Source: Data from market research firm, CivicScience April 2020
    https://civicscience.com/latest/ for more information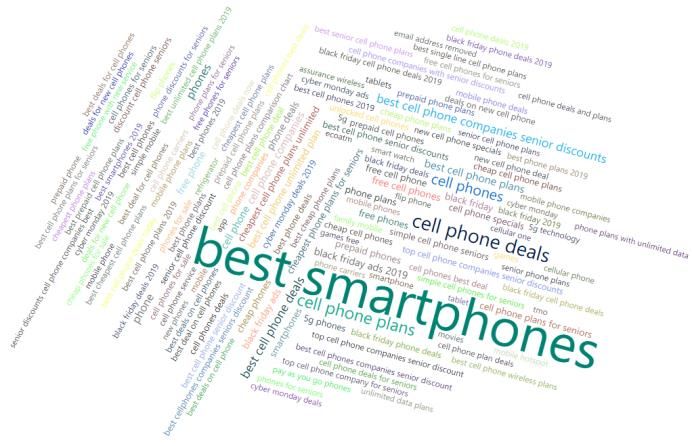
Microsoft Network consumers are attending more virtual events
Thus placing more importance on increased bandwidth, consistent data speeds, and the lack of throttling

  Virtual events
                  23% have attended a virtual event that’s
                  replaced a traditional in person event
                  A further 32% haven’t attended one yet but will
                  consider it
                  18-34s have attended virtual events more (30%)
                  35-54s are more likely to attend in future (35%)

    Source: MSN CivicScience US on site user survey 18+ years May-June 20.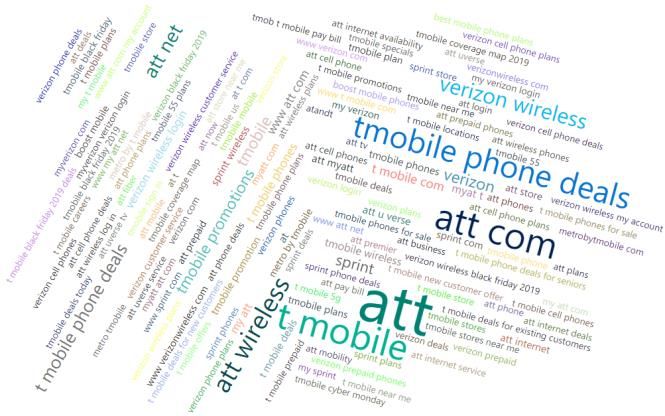
The pandemic has changed brand phone loyalties
iPhone users plan to be less loyal while Samsung users increased self-reported loyalty. Also, more people
planned to buy smartphones.
                                                                 How likely are you to switch from your current smartphone to
                                                                                  another in the next 90 days?
                50%
                        Not planning to switch from iPhone
                45%

                40%

                35%

                                                                                   Not planning to switch from Samsung Galaxy
                30%

                        Don’t own smartphone
                25%

                20%

                15%
                                                           Have neither iPhone nor Galaxy
                10%

                 5%

                 0%

                               Likely Samsung Galaxy to Other                                           Likely to switch Galaxy to iPhone

   Source: MSN Data from market research firm, CivicScience 2019 – July 12, 2020
Next steps COVID-19 • Ensure proper coverage for shopping campaigns • Consider conquest terms during launch • Communicate messaging around unlimited plans and bandwidth
Projections
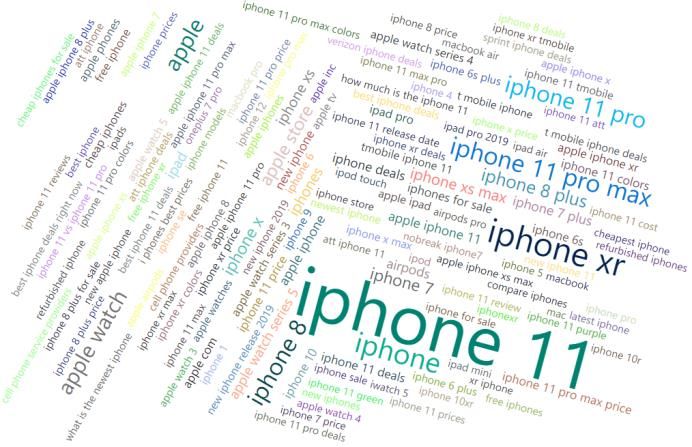
Non-brand phone searches are projected to increase
Non-brand searches relating to mobile devices

                       Pre-COVID-19 Post-COVID-19

                                                                                                                                                                 +90%
                                                                                                                                                                 Year-over-year
                                                                                                                                                                 (YoY) click growth

                                                                                                                                                                 +43%
                                                                                                                                                                 Product Ad YoY
                                                                                                                                                                 click growth

         1/1            2/1           3/1           4/1            5/1           6/1            7/1             8/1   9/1   10/1   11/1   12/1

 2020 Actuals                                                                                                                                                    +125%
 2019 Actuals                   +84%                                                   Disclaimer
                                                                                                                                                                 Mobile YoY
 2018 Actuals                   Projected 2020 YoY change                                                                                                        click growth
   Forecast                     from 2019
                                                                                                                                                 31% of clicks
   Source: Microsoft Advertising Internal Data; January 1, 2018 – June 29, 2020; methodology in notes section                                      shopping
Apple searches are expected to increase, but may see a
lower spike around their new device launch than last year
Searches for Apple mobile devices Usual iPhone launch
announcement time frame
Pre-COVID-19 Post-COVID-19
+8%
YoY click growth
+6%
Delay of launch will delay the initial
spike that begins at announcement
and carries iPhone search traffic
Product Ad YoY
through the rest of the year. This
could impact 2020 metrics all-up. click growth
1/1 2/1 3/1 4/1 5/1 6/1 7/1 8/1 9/1 10/1 11/1 12/1
2020 Actuals +3%
2019 Actuals +19% Disclaimer
Mobile YoY
2018 Actuals Projected 2020 YoY change click growth
Forecast from 2019
31% of clicks
Source: Microsoft Advertising Internal Data; January 1, 2018 – June 29, 2020; methodology in notes section shoppingSamsung mobile device searches will increase, and if
launch dates remain consistent, so will new device traffic
Searches for Samsung Galaxy phones
Pre-COVID-19 Post-COVID-19
+13%
YoY click growth
+31%
Product Ad YoY
click growth
1/1 2/1 3/1 4/1 5/1 6/1 7/1 8/1 9/1 10/1 11/1 12/1
2020 Actuals +9%
2019 Actuals +18% Disclaimer
Mobile YoY
2018 Actuals Projected 2020 YoY change click growth
Forecast from 2019
31% of clicks
Source: Microsoft Advertising Internal Data; January 1, 2018 – June 29, 2020; methodology in notes section shoppingPixel is unlikely to see major changes in search traffic
without major interest in their new device
Searches for Google Pixel
Pixel 3 launch
announcement in
Sept. 2018
-31%
YoY click growth
Pre-COVID-19 Post-COVID-19
+3%
Product Ad YoY
click growth
1/1 2/1 3/1 4/1 5/1 6/1 7/1 8/1 9/1 10/1 11/1 12/1
2020 Actuals -28%
2019 Actuals +14% Disclaimer
Mobile YoY
2018 Actuals Projected 2020 YoY change click growth
Forecast from 2019
31% of clicks
Source: Microsoft Advertising Internal Data; January 1, 2018 – June 29, 2020; methodology in notes section shopping5G traffic continues to steadily increase year over year, and
is expected to continue its upward trajectory through 2020
Searches relating to 5G
Rumors about 5G causing COVID-19;
discussion of possible Apple 5G phone;
uptick in T-Mobile 5G searches
+65%
Pre-COVID-19 Post-COVID-19 YoY click growth
+758%
Product Ad YoY
click growth
1/1 2/1 3/1 4/1 5/1 6/1 7/1 8/1 9/1 10/1 11/1 12/1
2020 Actuals +61%
2019 Actuals +127% Disclaimer
Mobile YoY
2018 Actuals Projected 2020 YoY change click growth
Forecast from 2019
31% of clicks
Source: Microsoft Advertising Internal Data; January 1, 2018 – June 29, 2020; methodology in notes section shoppingAs searches for new models go up, searches for old models
go down; old models did see a spike post-COVID-19
Searches for the latest phone models vs. older phone models
Latest Models
Older Models
Latest Model Forecast
Older Model Forecast
Linear (Latest Models)
Linear (Older Models)
Disclaimer
31% of clicks
Source: Microsoft Advertising Internal Data; January 1, 2018 – June 29, 2020; methodology in notes section shoppingNext steps Projections • Forecasts show positive momentum in search traffic through the end of 2020, meaning device launch traffic could beat that of previous years and advertisers should plan to meet this demand. Delayed launch dates would likely not impact volume, just prolong the spikes. • Searches for older phone models changed trajectory (started trending upward) post-COVID-19. This trend is predicted to continue through the end of the year, indicating that advertisers should maintain some focus on older models.
5G update
T-Mobile has gained the most share from AT&T
               Search volume share across “carrier 5G” and “carrier 5G network” terms
                        2018                                                 2019                                        2020

                                                SPRINT, 21%   VERIZON, 40%                               VERIZON, 38%                  ATT, 21%
                                                                                             ATT, 26%

                        ATT, 5%

                                                                                                                                        SPRINT, 8%
                                TMOBILE, 2%

                                                                                            SPRINT, 8%

                                                                                                                        TMOBILE, 33%
                                                                             TMOBILE, 26%

                                           VERIZON, 72%

Source: Microsoft Advertising Internal Data 2019- June 2020
T Mobile gains the most YoY share
Trended search volume share across “carrier 5G” and “carrier 5G network” terms
2019 - 2020
100%
90%
26%
80% 37% 40% 38% 40% 40% 35% 40% 40% 37% 38% 36%
46% 46% 41%
49% 46% 47%
70%
60%
16%
50% 18% 23%
16% 23% 25% 54% 30% 31%
6% 20% 39% 32% 32% 34%
40% 17% 21% 36%
10% 25%
6%
30% 6% 14% 10%
11% 13% 9% 7%
11% 7% 9% 4%
6% 7% 8%
20% 41%
33% 32% 6%
28% 23% 25% 26% 24% 24% 25%
10% 23% 21% 20% 18% 18% 20% 20%
14%
0%
ATT SPRINT TMOBILE VERIZON
Source: Microsoft Advertising Internal Data 2019- June 2020Anticipation for Apple 5G phones grows in 2020
Search volume share across “brand 5G” and “brand 5G phone” terms
2018 2019 2020
Google, Motorola
Motorola Motorola
LG, 0% 3% , 1%
, 10% , 0%
Apple, LG, 3% LG, 5%
24%
Apple,
31%
Apple,
54%
Samsung
, 36%
Samsung
Samsung
, 73%
, 60%
Source: Microsoft Advertising Internal Data 2019- June 2020Last year Microsoft Network users associated 5G with Apple as much as
they did with Samsung
Without launching a 5G handset last year, Apple has an interesting advantage due to this false perception
despite Samsung being among the first to offer 5G phones
Associate with 5G mobile phone service
17%, Samsung
Apple is also riding
momentum from recent
rumors of a full line up of 5G
iPhones, contributing to the
16% Apple
searches for 5G iPhones
Source: MSN Data from market research firm, CivicScience August, 2019Anticipation for Apple 5G phones grows in 2020
Search volume share across “brand 5G” and “brand 5G phone” terms
2019 - 2020
100% 0% 0% 0% 0% 0% 2% 0% 0% 1%
7% 6% 5% 8% 5% 0% 0%
13% 14% 10%
90% 16% 21%
27% 24% 13%
23% 28% 36% 20% 19% 27%
80%
42% 32% 42% 47%
70% 41%
60%
32%
50%
83% 87% 86%
40% 67% 76% 80% 79%
70% 74% 67%
70% 54%
30% 64%
53% 49% 54% 51%
20% 42%
10% 6%
7% 2%
0% 0% 0% 1% 0% 0% 0% 0% 0% 0% 0% 1% 0% 0% 0% 1%
Motorola Samsung Apple LG Google
Source: Microsoft Advertising Internal Data 2019- June 2020Preparing for the Apple “super cycle” may help increase 5G demand
Demand steadily rebounded in China in June, and as other
nations contain the coronavirus and lift lockdowns, the
stage is set for "massive pent up" interest in the iPhone
Over 1 out of 3
12...Roughly 350 million of Apple's 950 million iPhones iPhone users (~37%)
worldwide are set for an upgrade in the fall. With a new worldwide are due
range of phones spanning price points and 5G capability,
the company is positioned for demand to spike over the for an upgrade in
next 12 to 18 months the fall of 2020
~ Dan Ives, analyst at Wedbush Securities
Source: Ben Wink. (2020, July 13) Apple has a new Street-high price target - and the bullish analyst sees shares leaping 17% on 'massive' iPhone 12 demandHalf of Microsoft Network users require education around 5G
Based on what you currently know about 5G, which of the following benefits do you
MOST associate with 5G mobile service?
I've never heard of 5G mobile service 21%
None of these 24%
Reduced latency (response times) 5%
Lower battery consumption 4%
Increased bandwidth 9%
Improved cellular coverage 8%
Faster downloading / streaming speeds 30%
0% 5% 10% 15% 20% 25% 30% 35%
Source: MSN Data from market research firm, CivicScience August, 2019Having a 5G phone is unimportant to the majority of Microsoft Network users
How important is it to you that the next phone you get is 5G-enabled?
Extremely important 3%
Very important 7%
Somewhat important 22%
Not very important 32%
Not at all important 36%
0% 5% 10% 15% 20% 25% 30% 35% 40%
Source: MSN Data from market research firm, CivicScience August, 20195G may not be important due to the lack of awareness around 5G
Those who stated the importance of 5G in their next phone don’t know the benefits of 5G
Which of the following benefits do you MOST associate with 5G mobile service?
Segmented by those who answered “not important” to How important is it to you that the next
phone you get is 5G-enabled?
Faster downloading /
streaming speeds, 15%
I've never heard of 5G mobile
service, 21%
Improved cellular coverage,
4%
Increased bandwidth, 9%
Lower battery consumption,
4%
Reduced latency (response
times), 1%
None of these, 46%
Disclaimer
Source: MSN Data from market research firm, CivicScience August, 2019Next steps 5G • Carriers need to continue their quest to educate, differentiate, and incentivize 5G plans through brand and non brand efforts • Anticipate a big surge in 5G phones as Apple launches its first 5G device – the appetite is already there even without 5G iPhones now. Carriers need to leverage this launch to their advantage.
Query paths
The beginning of a path can illuminate what a
consumer will likely click on at the end of their
path. This was the result of the 2019 device
launch and holiday season.
Over the last 3 years the number of non-brand queries has
increased in paths for Telco and OEM’s. Consumers show us
non-brand is a significant step in the path to their last click.
                                                                                                                                  Non-brand
                                                                                                                                    38%
                                                                                                                                Apple hardware
                                                                                                                                    21%
  Non-brand                                                       Non-brand          32%   Postpaid carrier   62%
                                                                                                                                Postpaid carrier
                                                                  Apple hardware     26%   Prepaid carrier    14%                   24%
                                                                  Postpaid carrier   23%   Non-brand          13%           Samsung hardware
                                                                                                                                     8%
                                                                  Samsung hardware    9%   Samsung hardware 2.5%
                                                                                                                                Prepaid carrier
                                                                  Prepaid carrier     6%   Apple hardware     7.5%                   6%

                                                                                                                31% of clicks
   Source: Microsoft Advertising Internal Data; July 2019- December 2019                                          shopping
Consumer interest in Apple continues to be strong through
each stage of the path. However, non-brand and Samsung
hardware queries are used for cross shopping and research.
Non-brand
9%
Apple hardware
64%
Apple hardware Non-brand 11% Postpaid carrier 54%
Postpaid carrier
Apple hardware 60% Prepaid carrier 9.5% 17.5%
Postpaid carrier 17.5% Non-brand 4% Samsung hardware
4.5%
Samsung hardware 6% Samsung hardware 1.5%
Prepaid carrier
Prepaid carrier 3% Apple hardware 30% 3%
31% of clicks
Source: Microsoft Advertising Internal Data; July 2019- December 2019 shoppingNearly 50% of total queries are on a Samsung hardware
query when a path starts with Samsung. Cross shopping of
Apple and non-band make up 27% of total queries.
Non-brand
12%
Apple hardware
15%
Samsung hardware Non-brand 14.5% Postpaid carrier 51%
Postpaid carrier
Apple hardware 18.5% Prepaid carrier 11% 17%
Postpaid carrier 17% Non-brand 6% Samsung hardware
49%
Samsung hardware 42% Samsung hardware 24%
Prepaid carrier
Prepaid carrier 3.5% Apple hardware 6.5% 4%
31% of clicks
Source: Microsoft Advertising Internal Data; July 2019- December 2019 shoppingConsumers search half the time on a prepaid carrier query but
with significant interest in phones. Over 30% of queries are
for non-brand and brand phones searches.
Non-brand
12%
Apple hardware
13%
Prepaid Carrier Non-brand 16% Postpaid carrier 25%
Postpaid carrier
Apple hardware 17% Prepaid carrier 66% 17%
Postpaid carrier 19% Non-brand 3% Samsung hardware
5.5%
Samsung hardware 7.5% Samsung hardware 1%
Prepaid carrier
Prepaid carrier 36.5% Apple hardware 3% 50%
31% of clicks
Source: Microsoft Advertising Internal Data; July 2019- December 2019 shoppingPostpaid carrier category makes up most queries
overall. However, there is a strong tie with hardware. If a path
starts with a carrier it will end with one 6.6 times out of 10.
Non-brand
10%
Apple hardware
14%
Postpaid carrier Non-brand 12.5% Postpaid carrier 87%
Postpaid carrier
Apple hardware 18% Prepaid carrier 6.5% 65.5%
Postpaid carrier 56% Non-brand 2.5% Samsung
hardware
Samsung hardware 6.5% Samsung hardware 1% 5%
Prepaid carrier 4% Apple hardware 2.5% Prepaid carrier
3.5%
31% of clicks
Source: Microsoft Advertising Internal Data; July 2019- December 2019 shoppingNext steps Query path • Expand or fortify keyword portfolio to be inclusive of higher volume non-brand terms even more so on influential non- brand terms such as “best smartphones” • Trend traffic by device does not change much in terms of how the consumer searches. Make sure you are visible on all devices for all keywords • Showing up for your brands queries are more important than ever before • During the peak impact of COVID-19 we saw the average query path length shorten to 5 queries. During the holiday and phone launch season of 2019 the average query path length was 25 queries long. Be prepared for either scenario of shorter or longer paths with high keyword coverage and aggressive bids. Shorter paths gives you shorter opportunities to win the last click. Longer paths give you the opportunity to influence the last click. • Request the top queries in these categories to have expanded coverage in your portfolio
What will happen to query path
trends once T-Mobile sunsets Sprint?
The T-Mobile community of queries is strongly T-Mobile will sunset the
tied to prepaid carriers                      Sprint brand this summer

                                                                                                                 •   Unique to T-Mobile, many consumer queries
                                                                                                                     before and after a T-Mobile are related to
                                                                                                                     other prepaid carriers
                                                                                                                 •   63% of Sprint subscribers are postpaid while
                                                                                                                     15% of Sprint subscribers are in prepaid plans
                                                                                                                 •   Churn rate for Sprint prepaid subscribers is
                                                                                                                     nearly 4X greater than postpaid subscribers
                                                                                                                 •   During March, when the COVID-19 pandemic
                                                                                                                     became reality, there was an increase in queries
                                                                                                                     categorized as prepaid and non-brand
                                                                                                                 •   The potential for non-brand and prepaid
                                                                                                                     queries increases if we see a second wave of
                                                                                                                     COVID-19 in the US

Source: Microsoft Advertising Internal Data: July-Dec 2019. Sprint data source: Sprint via Statista March 2020
• If the post COVID-19 trend continues, the expectation for query paths related to carriers should show an increase of queries in the non-brand and postpaid carrier categories to fill the Sprint void
Audience insights
Proprietary Microsoft Advertising Source Data
Proprietary Microsoft Advertising Source Data
Proprietary Microsoft Advertising Source Data
Proprietary Microsoft Advertising Source Data
The majority of Microsoft Network users are iPhone users

                                                            Which of the following types of smartphones do you currently own?

                                            Apple iPhone                                                                                      38%

                                        Samsung Galaxy                                                                      24%

                           I don't have a Smartphone                                                            16%

                                                      Other                                         10%

                                                          LG                             7%

                                             Google Pixel               2%

                                  Samsung Galaxy note                             4%

                                                               0%                 5%          10%         15%         20%   25%   30%   35%     40%

  Source: MSN Data from market research firm, CivicScience April, 2019 – July 12, 2020
Overall the majority of Microsoft Network users are loyal iPhone users
Though low in number, more iPhone users are willing to switch to other manufacturers than compared to
Samsung users
How likely are you to switch from your current smartphone to another in the next 90 days?
I am not planning to switch from my iPhone 42%
43%
I am not planning to switch from my Samsung Galaxy 24%
22%
I don't own a smartphone 16%
19%
My smartphone is neither an iPhone nor a Samsung Galaxy 11%
11%
I am likely to switch from my iPhone to another manufacturer 1.9%
1.1%
I am likely to switch from my Samsung Galaxy to another manufacturer 1.8%
1.0%
I am likely to switch from my iPhone to a Samsung Galaxy 1.5%
1.4%
I am likely to switch from my Samsung Galaxy to an iPhone 1.3%
1.0%
0.0% 5.0% 10.0% 15.0% 20.0% 25.0% 30.0% 35.0% 40.0% 45.0% 50.0%
2019 2020
Source: MSN Data from market research firm, CivicScience 2019 – July 12, 2020The majority of Microsoft Network users are loyal iPhone users
Currently Previously
Have Had
71% iPhone iPhone
7% iPhone GalaxyMicrosoft Network users are slightly more likely to buy a foldable phone
32% of Microsoft Network users are interested in purchasing a foldable compared to 30% of the U.S. population
How interested would you be in buying a smartphone with a foldable touchscreen?
17%
I'm not sure
18%
52%
Not at all interested
51%
22%
Somewhat interested
24%
8%
Very Interested
8%
0% 10% 20% 30% 40% 50% 60%
US MSN
Source: MSN Data from market research firm, CivicScience February, 2020The majority of Microsoft Network users are price conscious phone buyers
85% of Microsoft Network users would not purchase a smartphone for $1,000
Would you pay $1k for a smartphone?
Yes, and I already have, 9%
Other/No opinion, 1%
Yes, I would, 4%
No, probably not, 18%
No, definitely not, 67%
Source: MSN Data from market research firm, CivicScience February, 2020Next steps Audience • Retarget users who have previously purchased an iPhone or Samsung phone • Allocate some budget for those who are also looking to switch phone brands and cross shop (conquest) • Price may be an even bigger selling point for phones this year due to the pandemic, so promotions around key times is essential to growing sales • Expand your audience targeting to include overlapping interests that may be outside of the scope of technology and devices
Microsoft Audience Network
Meet the Microsoft Audience Network

     Premium native placements
     Strict publisher standards and
     AI-powered curation

     Brand-safe experiences
     Transparency and controls for advertisers   Outlook.com    Microsoft Edge

     Highly contextual ad placements
     Based on Microsoft first-party data

     Strong industry ad performance
     Driven by leading-edge AI technology
                                                          MSN        Select publisher
                                                                         partners
Drive meaningful connections with your audience
Using Microsoft first-party intent data
1B 675M
devices running global
Windows 101 professionals3
Powered by
498M the Microsoft 200M
Advertising
monthly unique monthly unique
visitors2 visitors2
Graph
11B 64M
global monthly monthly unique
searches2 users2
1. Microsoft internal data, June 2020, (https://news.microsoft.com/bythenumbers/en/windowsdevices). 2. comScore, August 2018. 3. Omnicore, May 2019. 4. Microsoft internal data.Achieve your goals with high-performing ads
Our Audience Ads click-through rates (CTRs) outperform other native platforms delivering ads on the same properties
MSN INFOPANE OUTLOOK.COM PUBLISHER PARTNERS
2x CTR¹ 1.2x CTR² 3.5x CTR³
1. Microsoft internal data, November 2019-January 2020. 2. Microsoft internal data, July 2019-October 2019. 3. Publisher partner data and Microsoft internal data, November 2019-January 2020. Numbers
are rounded to the nearest percentage point. CTR is click-through rate.Microsoft Audience Ads
Adding images and copy to your search campaigns is one of the most important actions you
can take to make sure your ads serve on the Microsoft Audience Network
IMAGE ADS TEXT ADS PRODUCT ADSMicrosoft Audience Network exposure
drives lift on search for Tech & Telco advertisers
Microsoft Microsoft
Search Audience
Network Network +27% lift in impressions
post-exposure1
We reach over
half a billion
people worldwide
+47% lift in clicks
post-exposure1
1. Jan 2019 – Mar 2020; Exposed vs. Control lifts for both clicks and searches per user; Searches based on ad flag for selected advertiser and other advertisers in that vertical. On average, those clients saw the reported
lift in Search Impressions per user and reported lift Search Clicks per user for exposed users compared to those who were not exposed to an ad on the Microsoft Audience Network. This is based on a sample of our
pilot advertisers and is not a marketplace lift. The experienced lift is on a per-user basis for the exposed users, not the advertisers’ full search program. Technology & Telecommunications AdvertisersAudience Network click volume continues to
trend upward for Tech while CPC improves
All-up Microsoft Audience Network Tech & Telco clicks & CPC trends
Clicks Cost Per Click Linear (Clicks ) Linear (Cost Per Click )
500000 1.4
450000
1.2
400000
350000 1
300000
0.8
250000
0.6
200000
150000 0.4
100000
0.2
50000
0 0
Ensure the Audience Network is a part of your
Microsoft Advertising plan for 2020 Device Launches
Microsoft Advertising; 2020
1. Excludes non-Back-to-School Retail categoriesActivate device launch trends across
different campaign types and strategies
Respond to COVID-19
search trends by reaching
users with messaging and
promotions in which
they’re interested in during
increased stay-at-home
Activate an important COVID-19 takeaway periods and demand for
by featuring differentiation and messaging
around cost, speed, and bandwidth high speed internet
FPO = For Presentation Only, sample advertisement may not reflect an active ad or customer, and is to be used for visualization purposes only.Activate device launch trends across
different campaign types and strategies
Respond to increased
demand for high-speed
internet and 5G products
by promoting your high-
speed 5G plans and
devices to highly targeted
Activate an important 5G takeaway by audiences in a premium,
continuing your quest to educate,
differentiate, and incentivize 5G plans visible environmentExpand your shopping reach through feed-based shopping native ads Use your existing Shopping Campaigns feed from search When combined with Microsoft AI intent signals, we’ll match searchers with the items in your feed that they’ve shown interest in
Advertisers running Product Audiences1 see a 19% higher lift in clicks
compared to the average search lift
                                                     IMAGE ADS                                                                                              PRODUCT ADS

                                                                                 27%                                                                                  83%
                                                                               47%                                                                                 95%
Microsoft internal data, user clusters collected Sept 2019, MSAN Exposure and Search performance tracked Oct-Dec 2019
1.   Based on advertisers with shopping feeds who are running Audience campaigns & Product Audiences; lift metrics are not exclusive to Product Audiences
Activate across targeting features to maximize reach and click volume
Apply bid modifiers to individual segments to maintain efficiency
Product Audiences, Device Targeting, and Remarketing, Product Audiences, and Similar
Location Targeting offer the lowest CPC for Audiences generate the highest CTR for
Technology & Telecommunications advertisers Technology & Telecommunications advertisers
*Microsoft internal data, 1/1/2020 – 4/25/2020, Microsoft Audience Network, Tech & Telco L1, Technology & Telecommunication L2 Sub-VerticalsNext Steps Summary
Microsoft
Projections Audience
COVID-19 5G Query path Audience
insights
Network
• Prepare for this Forecasts show positive • Expect Hardware and • Expand or fortify • Take advantage of • Take advantage of a
holiday season to be momentum in search Software conversions keyword portfolio to overlapping growing network to
online-shopping traffic through the end to spike together be inclusive of higher audiences to broaden extend activations into
heavy of 2020, meaning device throughout the year, volume non-brand your advertising reach the Microsoft Audience
launch traffic could beat but not necessarily terms. Even more so Network
• Ensure proper that of previous years during the holiday on influential non- • Retarget users who
coverage for and advertisers should months brand terms such as have previously • Promote messaging
shopping campaigns plan to meet this “best smartphones”. purchased an iPhone around cost, plans, and
demand. Delayed launch • Carriers need to
or Samsung phone bandwidth as a
• Consider conquest dates would likely not continue their quest to
• Trend traffic by device response to COVID-19
terms during launch impact volume, just educate, differentiate,
does not change • Allocate some budget
prolong the spikes. and incentivize 5G
much in terms of how for those who are also • Reach users who are
• Communicate plans through brand
and non brand efforts the consumer looking to switch interested in 5G with
messaging around Searches for older phone searches. Make sure phone brands and your brand’s unique
unlimited plans and models changed you are visible on all cross shop (conquest) value proposition and
• Anticipate a big surge
bandwidth trajectory (started devices for all differentiation in the 5G
in 5G phones as Apple
trending upward) post- keywords. • Price may be an even space
launches its first 5G
COVID-19. This trend is bigger selling point
device – the appetite is
predicted to continue already there even • Showing up for your for phones this year • Target similar audiences
through the end of the without 5G iPhones brands queries is due to the pandemic, in Microsoft Audience
year, indicating that now. Carriers need to more important than so promotions around Network as Search,
advertisers should leverage this launch to ever before key times is essential while also testing new
maintain some focus on their advantage. to growing sales segments
older models.Appendix
Just under half of consumers are spending less during
the pandemic
         How has the COVID-19 outbreak affected your spending overall?
  90%
  80%
  70%
  60%                                                                                  I'm not sure   6%
  50%
  40%
  30%                                                                         I’m spending less now              39%
  20%
  10%
   0%                                                                 I’m spending the same amount                     45%
            3/6/2020
           2/23/2020
           2/25/2020
           2/27/2020
           2/29/2020

           3/10/2020
           3/12/2020
           3/14/2020
           3/16/2020
           3/18/2020
           3/20/2020
           3/22/2020
           3/24/2020
           3/26/2020
           3/28/2020
           3/30/2020

           4/11/2020
           4/13/2020
           4/15/2020
           4/17/2020
           4/19/2020
            3/2/2020
            3/4/2020

            3/8/2020

            4/1/2020
            4/3/2020
            4/5/2020
            4/7/2020
            4/9/2020
                                                                             I’m spending more now         10%
                                       I’m spending more now
                                      I’m spending the same amount
                                      I’m spending less now
                                      I'm not sure

Source: Data from market research firm, CivicScience Feb-April 2020
https://civicscience.com/latest/ for more information
What are consumers doing with their disposable
income during the pandemic?
What are people doing with this
Monthly % of change in disposable personal income (USA) 12.9% extra disposable money?
• Personal savings rate hit a
historic level of 33% in April
• Personal spending decreased by
13.6%
• Consumers are crediting a
combination of unknown
circumstances in the near future
along with a decrease in
opportunities to go out and
0.4% 0.3% 0.4% 0.3% 0.6% 0.3% 0.0%
0.4% 0.2%
0.6% 0.5% spend (with businesses closing
up… “shopportunities” are
limited)
- www.cnbc.com
-2.1%
Apr '19 May '19 Jun '19 Jul '19 Aug '19 Sep '19 Oct '19 Nov '19 Dec '19 Jan '20 Feb '20 Mar '20 Apr '20*
Source: Statista 2020Estimated growth of smartphone users in U.S. (in millions)
New user numbers are estimated to continually decline in the years ahead
295. 3.5%
290.64
290. 3.0%
287.79
284.49 2.5%
285.
280.54 2.0%
280.
1.5%
275.66
275.
1.0%
269.44
270. 0.5%
265. 0.0%
2019 2020* 2021* 2022* 2023* 2024*
Smartphone users USA Growth rate of smartphone users
Source: Statista 2020Where customers are starting to bounce back
U.S. customers are becoming more comfortable with low-contact commerce
Restaurant takeout 44%
Who is doing
this increase in
shopping?
Store curbside
pickup 36%
50% of adults
between 18 – 44 said
they are more
Virtual doctor visits
comfortable getting
27% takeout in May vs. April,
Food delivery 23% compared to 43% of
those aged 45-64, and
only 34% of those
over 65 years old
March April May
Source: Statista May 2020How COVID-19 has shifted how people shop in the U.S.
Items/services shoppers are acquiring online Items shoppers say they are spending less on
compared to in-store
Restaurant delivery / takeaway 31% Going out (e.g. restaurants, cinemas) 77%
Hygiene products 27% Travel (e.g. public transport, vacations) 70%
Clothing 26% Services (e.g. hairdresser) 69%
Household cleaning products 26% Clothing 49%
Supermarket food and drink… 24% Consumer electronics, furniture 34%
Health products (e.g. medicine) Hobbies 26%
21%
Investments 26%
Books 15%
Food and drinks 23%
Hobby supplies 15%
Childcare 22%
Games 13%
Home entertainment (e.g. video, games) 19%
Consumer electronics, furniture 11%
Insurance 19%
Video 11%
Source: Statista 2020Cell phone plans – comparing prepaid to postpaid
U.S. wireless carriers lost 238K prepaid in Q4 of 2019, and Breakdown of postpaid to prepaid
over 330K prepaid customers over 2019 customers per carrier
4,646
17,803
20,860
89,861
75,207
8,266
40,345
26,264
Verizon AT&T T-mobile Sprint
Postpaid PrepaidMicrosoft Network consumers are split on how they will spend on
technology after the pandemic is over
Home Technology
47% say they will spend the same or
more when the pandemic is over
52% of males / 43% of females agree
35-54s are more likely to spend the same
or more as 51% agree
Source: MSN CivicScience US on site user survey 18+ years May-June 20.Carrier 5G queries remain high in 2020
2019-2020
ATT SPRINT TMOBILE VERIZON
Source: Microsoft Advertising Internal Data 2019- June 2020The beginning of a path can illuminate what a consumer will likely click
on at the end of their path. This was the result of the 2019 season:
When a path starts with 87% of the paths ended on a Postpaid Carrier click, 7% of
a “postpaid carrier” last clicks were Prepaid Carrier, 1% were Samsung, 2.5%
related query were non-brand, and the remaining 2.5% were Apple
When a path starts with 66% of the paths ended on a prepaid click, 25% postpaid
a “prepaid carrier” carrier clicks, 3% were non-brand, 1% were Samsung, and
related query 3% of last clicks were Apple Hardware & 2% Other
When a path starts with 54% of the paths ended on a Carrier click 30% of last clicks
a “apple hardware” were Apple Hardware, 9.5% were Prepaid, 1.5% were
related query Samsung, 4% were non-brand, 1% Other
When a path starts with a 51% of paths ended in a Postpaid Carrier click, 24%
“samsung hardware” Samsung, 11% Prepaid Carrier, 7% Apple, 6% non-brand,
related query and 1% were Other Hardware clicks
When a path starts with a 62% of paths ended on a Postpaid Carrier click 14% were
“non-brand” related query Prepaid, 13% were non-brand, 8% were Apple, 3% were
Samsung
Source: Microsoft Advertising Internal Data: July-Dec 2019You can also read