Investment Strategy - Raymond James
←
→
Page content transcription
If your browser does not render page correctly, please read the page content below
Investment Strategy
                                                                                                                                              Published by Raymond James & Associates

         Andrew Adams, CFA, CMT, (727) 567-4807, Andrew.Adams@RaymondJames.com                                                                                         October 31, 2018

Charts of the Week _________________________________________________________________________________________________________________________________

Investment Strategy: "Charts of the Week"

It is fitting that today is Halloween since the stock market hasn’t been this frightening in a long time. The fact that the market has fallen is not the scary part – that happens from
time to time and, while October hasn’t exactly been fun, this drawdown is still perfectly in the realm of a normal market correction. What has scared me is that the indicators
that have done such a good job of helping us time bottoms the last few years have all been pointing toward getting some sort of oversold rally over the last week and it has not
yet arrived (though there are signs that at least a near-term low has been made). Moreover, quite a bit of technical damage has been done, and if prices don’t power higher very
soon to help quickly mitigate that damage it will only increase the odds of seeing more downside at some point ahead. Many smart people that I follow and talk to regularly
have also shown much more concern during this pullback than I can remember during other corrections, and they have mostly been stumped as to why exactly this is happening
right now. While I’ve seen many pundits make educated guesses – with varying degrees of impudence – buyers and sellers unfortunately do not fill out surveys when they place
trades explaining their reasons for getting in and out of positions. So the “why now?” question continues to be largely debated and is most likely a combination of various
factors.
Adding to the confusion is that the real intraday moves don’t seem to be happening until 2:30-4:00 p.m. There have been several instances over the last several sessions when
the market will trade up in the morning or early afternoon, and I will then get slammed with emails asking if the lows are in. My response to these has generally been that we
will have to wait until nearer the close to really gauge the direction of the market since that is typically when the big money does much of its trading. And, sure enough, we have
given back most, if not all, of the gains in the last hour on several of these potential bounce-back days. It has felt very much like the computer programs that so dominate short-
term trading in today’s market have had their algorithms switched from “buy the dips” to “sell the rips,” which has made it extremely hard to sustain any strength. It also makes
it more difficult to have much confidence in technical support levels since these do not seem to matter whenever the selling really picks up.
Yesterday, however, was a big step in the right direction. Not only was the market able to hold onto its early gains into the close, we even witnessed acceleration to the upside in
the critically important last hour and a half. It was the kind of day we have been awaiting and comes on the heels of a Monday session that was not as bad as it may have
seemed at first. The averages were hit pretty hard Monday because several marquee companies were hit hard, but more stocks in the S&P 500 advanced than declined and
small/mid-cap indices made higher lows. If all plays out like it’s supposed to now, there’s a very good chance the near-term lows have been made. Perhaps the biggest event
standing in the way of that is Apple’s earnings report after the close on Thursday, which stands out as one of the most important earnings announcements in memory. It seems
investors right now are zeroing in on any negatives found in these reports and penalizing companies for any signs of slowing growth. It goes without saying that at a time when
the broad market is already fragile, we don’t need the world’s largest stock selling off. Another market drop post-Apple earnings will likely carry into the midterm election next
Tuesday, and then perhaps once that bit of uncertainty is removed investors will feel better about dipping back in with more strength (assuming we don’t get an election
surprise that is viewed negatively by the market). Conversely, a strong Apple report may help calm the waters a bit and improve sentiment. Many investors likely don’t want to
get aggressive right before the election despite the broadest pullback we’ve seen in some time, and this is probably one of the main things contributing to the market’s inability
to rally from oversold conditions.
So, right now at least I am proceeding under the assumption that the lows have been made for this leg down, though the big question becomes how high can the market push in
the coming weeks. There remains quite a bit of overhead resistance (selling pressure) that will make it difficult to get a “V-shaped” recovery, which means some sort of eventual
retest is still a very real possibility. The situation remains fluid and we’re really taking it day by day, but to me this still looks like a bottoming process until proven otherwise.

© 2018 Raymond James & Associates, Inc., member New York Stock Exchange/SIPC. All rights reserved.
International Headquarters: The Raymond James Financial Center | 880 Carillon Parkway | St. Petersburg, Florida 33716 | 800-248-8863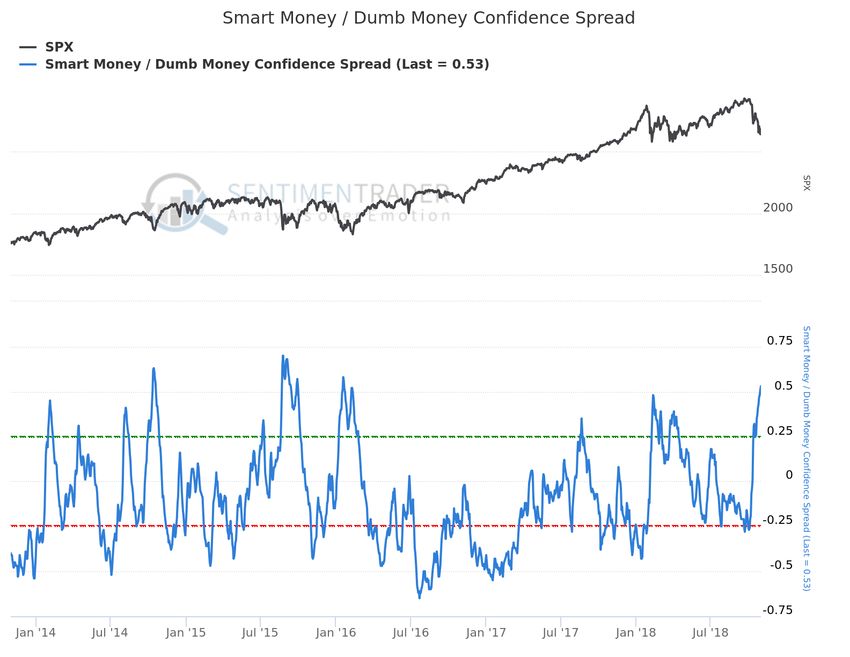
Raymond James                                                                                                                                               Investment Strategy

                                                                                        The Breadth Box (Spotlight)
While major indices like the S&P 500 and Russell 3000 can provide an idea of how stocks are doing, they don’t always tell the full story. For instance, while these indices
themselves have fallen around 11%-12% at their recent lows, the stocks that compose them were down an average of 20.2% (S&P 500) and 27.7% (Russell 3000) from their
respective 52-week highs. This is clearly worse than at the lows of February.

                                                                                                                                       Recent Low   February 9, 2018
                                                                                                                            10/30/18
                                                                                                                                       (10/29/18)        Low

                     S&P 500 Average % Below 52-Week High                                                                      19.2%     20.2%           15.1%

                  Russell 3000 Average % Below 52-Week High                                                                    26.9%     27.7%           21.5%

Source: Bloomberg; Raymond James research

© 2018 Raymond James & Associates, Inc., member New York Stock Exchange/SIPC. All rights reserved.
International Headquarters:The Raymond James Financial Center | 880 Carillon Parkway | St. Petersburg, Florida 33716 | 800-248-8863                                           2
Raymond James Investment Strategy
S&P 500 Timing Chart
The S&P 500 remains trading between two and three standard deviations beneath its 50-day moving average, some of the most oversold readings seen over the last few years.
Source: Stockcharts.com
© 2018 Raymond James & Associates, Inc., member New York Stock Exchange/SIPC. All rights reserved.
International Headquarters:The Raymond James Financial Center | 880 Carillon Parkway | St. Petersburg, Florida 33716 | 800-248-8863 3Raymond James Investment Strategy
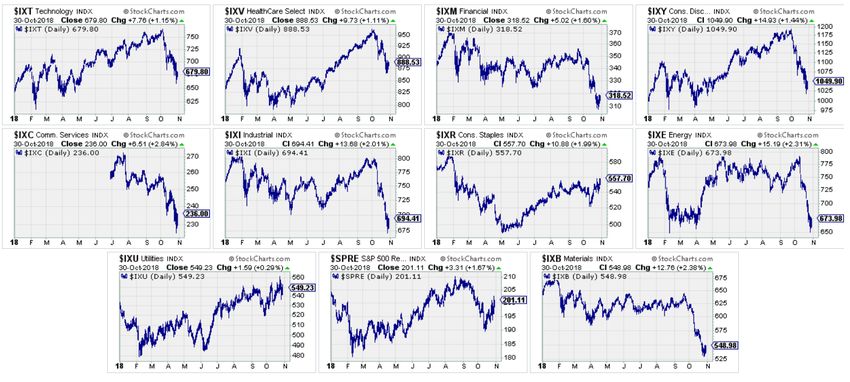
S&P 500 – Sector View
Source: Stockcharts.com
© 2018 Raymond James & Associates, Inc., member New York Stock Exchange/SIPC. All rights reserved.
International Headquarters:The Raymond James Financial Center | 880 Carillon Parkway | St. Petersburg, Florida 33716 | 800-248-8863 4Raymond James Investment Strategy
S&P 500 Breaks Through Very Short-Term Downtrend
I have watched the 30-minute chart of the S&P 500 very closely over the last couple of weeks for signs of bottoming, and finally yesterday we got the first real indication that
conditions may be changing. The green line connecting the index’s highs going back to October 17 had been acting as obvious resistance up until yesterday, but the strength in
the last half hour was enough to not only take the S&P 500 over this line, but to also close the session above it. This was step one in creating a meaningful bottom, but the index
does still have some work to do now. Next, I want to see that red resistance line that goes back to early October taken out to indicate that the near-term downtrend has ended.
To do that today it would require a close above 2700. It’s also worth noting that while the index has continued to make lower lows over the last week, it has done so each time
with less downside momentum on the 30-minute chart (RSI indicator in lower panel), further strengthening the case for a bottom.
Source: Stockcharts.com
© 2018 Raymond James & Associates, Inc., member New York Stock Exchange/SIPC. All rights reserved.
International Headquarters:The Raymond James Financial Center | 880 Carillon Parkway | St. Petersburg, Florida 33716 | 800-248-8863 5Raymond James Investment Strategy
S&P 500’s 10-Day Moving Average is Important
We also want to see the S&P 500 (and other major averages) recover the 10-day moving average (orange line) after failing a number of times to do so on the first bounce
attempt a couple of weeks ago. Here, too, on the daily chart we see that while the S&P 500 has made lower lows in recent days, it has continued to do so with less downside
momentum, indicating the move seems to be slowing down.
Source: Stockcharts.com
© 2018 Raymond James & Associates, Inc., member New York Stock Exchange/SIPC. All rights reserved.
International Headquarters:The Raymond James Financial Center | 880 Carillon Parkway | St. Petersburg, Florida 33716 | 800-248-8863 6Raymond James Investment Strategy
2775-2810 is Now the Near-Term Upside Target
While there are more possible levels of resistance above the current S&P 500 level than I can mention here without the chart getting way too busy, I am looking now for the
index to eventually retrace back into the 2775-2810 range (gray-shaded box) over the next couple of weeks IF we get follow-through from yesterday’s positive day. 2775-2810
roughly represents the zone between the 50% and 61.8% retracement of the October decline (to this point) and the upper end of that range is around where the index ran into
trouble back in mid-October. This seems a likely area for traders to target, but the S&P 500 does have some work to do to even get back to there (like breaking up through the
red downtrend line and recapturing the 200-day moving average in orange).
Source: Stockcharts.com
© 2018 Raymond James & Associates, Inc., member New York Stock Exchange/SIPC. All rights reserved.
International Headquarters:The Raymond James Financial Center | 880 Carillon Parkway | St. Petersburg, Florida 33716 | 800-248-8863 7Raymond James Investment Strategy
S&P 500 Close to Preventing at Least Some Technical Damage
As bad as the month of October has been, it has not yet done enough to cause irreparable harm to the S&P 500’s long-term uptrend going back to the 2009 bottom (green line).
The index briefly traded beneath this crucially important line, but as long as we do not see sufficient weakness today, the month will still close above it, preventing what would
otherwise be a very negative signal.
Source: Stockcharts.com
© 2018 Raymond James & Associates, Inc., member New York Stock Exchange/SIPC. All rights reserved.
International Headquarters:The Raymond James Financial Center | 880 Carillon Parkway | St. Petersburg, Florida 33716 | 800-248-8863 8Raymond James Investment Strategy
Smart Money/Dumb Money Spread at Bullish Levels
Last week I mentioned that SentimenTrader’s so-called “dumb money” confidence measure had reached bullish levels while the “smart money” confidence was also close to
hitting bullish levels. Well, now the “smart money” has made it all the way to bullish and the spread between the two measures has reached its widest point in favor of the
“smart money” since early 2016. Over the last five years, whenever this spread has exceeded 0.5, as it is now, some sort of significant low has soon followed.
Source: SentimenTrader.com
© 2018 Raymond James & Associates, Inc., member New York Stock Exchange/SIPC. All rights reserved.
International Headquarters:The Raymond James Financial Center | 880 Carillon Parkway | St. Petersburg, Florida 33716 | 800-248-8863 9Raymond James Investment Strategy
Small Caps Find Support
The small cap Russell 2000 has experienced a bit of technical damage the last two months, but it does appear to also be trying to form a bottom. It found support near levels
that also marked lows back last November and in February, and the Russell 2000 has outperformed the S&P 500 over the last few sessions (lower panel).
Source: Stockcharts.com
© 2018 Raymond James & Associates, Inc., member New York Stock Exchange/SIPC. All rights reserved.
International Headquarters:The Raymond James Financial Center | 880 Carillon Parkway | St. Petersburg, Florida 33716 | 800-248-8863 10Raymond James Investment Strategy
Semiconductor Index Shows Strength (Finally)
The Semiconductor Index (SOX) often leads the broad market, which is why we really want to see it strengthen here on any bounce attempt in the major averages. It took a nice
first step in doing so yesterday with a 4.16% gain and its first higher high and higher low since the middle of the month.
Source: Stockcharts.com
© 2018 Raymond James & Associates, Inc., member New York Stock Exchange/SIPC. All rights reserved.
International Headquarters:The Raymond James Financial Center | 880 Carillon Parkway | St. Petersburg, Florida 33716 | 800-248-8863 11Raymond James Investment Strategy
Emerging Markets at Possible Support Zone
The MSCI Emerging Markets Index has now pulled back near the 61.8% retracement level of its 2016-2018 ascent. This zone (green) also saw bottoms made back in 2014.
Sentiment for EM is still very negative, which is often when turns occur.
Source: Stockcharts.com
© 2018 Raymond James & Associates, Inc., member New York Stock Exchange/SIPC. All rights reserved.
International Headquarters:The Raymond James Financial Center | 880 Carillon Parkway | St. Petersburg, Florida 33716 | 800-248-8863 12Raymond James Investment Strategy
U.S. Dollar Close to Breaking Out Again
While most eyes have likely been on the stock market, the U.S. Dollar Index has slowly crept back up to make a new closing high yesterday. A breakout here would likely put
downward pressure on commodities priced in dollars, and, while the relationship hasn’t been perfect, a strong dollar has often helped small caps outperform large caps the last
few years. We like small caps to bounce back harder on any market rebound since they’re more beaten down, and the dollar trend appears to support that too.
Source: Stockcharts.com
© 2018 Raymond James & Associates, Inc., member New York Stock Exchange/SIPC. All rights reserved.
International Headquarters:The Raymond James Financial Center | 880 Carillon Parkway | St. Petersburg, Florida 33716 | 800-248-8863 13Raymond James Investment Strategy
Credit Spreads Still Not Indicating Major Economic/Financial Concern
One bit of good news is that while credit spreads have mostly widened a bit recently during this stock market sell-off, overall they still appear to indicate low levels of real
concern. The bond/credit market is usually pretty good at sniffing out future economic and financial worries, with spreads like the ICE BAML High Yield U.S. Master II OAS
typically spiking into recessionary and otherwise weak periods (like the end of the Dot-Com Bubble, the Financial Crisis, and the 2014-2016 oil collapse). The fact that spreads
like this one are not yet flashing major caution helps support that the current stock market drop is not the beginning of something deeper.
© 2018 Raymond James & Associates, Inc., member New York Stock Exchange/SIPC. All rights reserved.
International Headquarters:The Raymond James Financial Center | 880 Carillon Parkway | St. Petersburg, Florida 33716 | 800-248-8863 14Raymond James Investment Strategy
Important Investor Disclosures
Raymond James & Associates (RJA) is a FINRA member firm and is responsible for the preparation and distribution of research created in the United States. Raymond James & Associates is
located at The Raymond James Financial Center, 880 Carillon Parkway, St. Petersburg, FL 33716, (727) 567-1000. Non-U.S. affiliates, which are not FINRA member firms, include the
following entities that are responsible for the creation and distribution of research in their respective areas: in Canada, Raymond James Ltd. (RJL), Suite 2100, 925 West Georgia Street,
Vancouver, BC V6C 3L2, (604) 659-8200; in Europe, Raymond James Euro Equities SAS (also trading as Raymond James International), 40, rue La Boetie, 75008, Paris, France, +33 1 45 64
0500, and Raymond James Financial International Ltd., Broadwalk House, 5 Appold Street, London, England EC2A 2AG, +44 203 798 5600.
This document is not directed to, or intended for distribution to or use by, any person or entity that is a citizen or resident of or located in any locality, state, country, or other jurisdiction
where such distribution, publication, availability or use would be contrary to law or regulation. The securities discussed in this document may not be eligible for sale in some jurisdictions.
This research is not an offer to sell or the solicitation of an offer to buy any security in any jurisdiction where such an offer or solicitation would be illegal. It does not constitute a personal
recommendation or take into account the particular investment objectives, financial situations, or needs of individual clients. Past performance is not a guide to future performance,
future returns are not guaranteed, and a loss of original capital may occur. Investors should consider this report as only a single factor in making their investment decision.
For clients in the United States: Any foreign securities discussed in this report are generally not eligible for sale in the U.S. unless they are listed on a U.S. exchange. This report is being
provided to you for informational purposes only and does not represent a solicitation for the purchase or sale of a security in any state where such a solicitation would be illegal. Investing in
securities of issuers organized outside of the U.S., including ADRs, may entail certain risks. The securities of non-U.S. issuers may not be registered with, nor be subject to the reporting
requirements of, the U.S. Securities and Exchange Commission. There may be limited information available on such securities. Investors who have received this report may be prohibited in
certain states or other jurisdictions from purchasing the securities mentioned in this report. Please ask your Financial Advisor for additional details and to determine if a particular security is
eligible for purchase in your state.
The information provided is as of the date above and subject to change, and it should not be deemed a recommendation to buy or sell any security. Certain information has been obtained
from third-party sources we consider reliable, but we do not guarantee that such information is accurate or complete. Persons within the Raymond James family of companies may have
information that is not available to the contributors of the information contained in this publication. Raymond James, including affiliates and employees, may execute transactions in the
securities listed in this publication that may not be consistent with the ratings appearing in this publication.
Raymond James (“RJ”) research reports are disseminated and available to RJ’s retail and institutional clients simultaneously via electronic publication to RJ's internal proprietary websites
(RJ Investor Access & RJ Capital Markets). Not all research reports are directly distributed to clients or third-party aggregators. Certain research reports may only be disseminated on RJ's
internal proprietary websites; however such research reports will not contain estimates or changes to earnings forecasts, target price, valuation, or investment or suitability rating.
Individual Research Analysts may also opt to circulate published research to one or more clients electronically. This electronic communication distribution is discretionary and is done only
after the research has been publically disseminated via RJ’s internal proprietary websites. The level and types of communications provided by Research Analysts to clients may vary
depending on various factors including, but not limited to, the client’s individual preference as to the frequency and manner of receiving communications from Research Analysts. For
research reports, models, or other data available on a particular security, please contact your RJ Sales Representative or visit RJ Investor Access or RJ Capital Markets.
Links to third-party websites are being provided for information purposes only. Raymond James is not affiliated with and does not endorse, authorize, or sponsor any of the listed
websites or their respective sponsors. Raymond James is not responsible for the content of any third-party website or the collection or use of information regarding any website’s users
and/or members.
Additional information is available on request.
Simple Moving Average (SMA) - A simple, or arithmetic, moving average is calculated by adding the closing price of the security for a number of time periods and then dividing this total by the
number of time periods.
Exponential Moving Average (EMA) - A type of moving average that is similar to a simple moving average, except that more weight is given to the latest data.
Relative Strength Index (RSI) - The Relative Strength Index is a technical momentum indicator that compares the magnitude of recent gains to recent losses in an attempt to determine
overbought and oversold conditions of an asset.
© 2018 Raymond James & Associates, Inc., member New York Stock Exchange/SIPC. All rights reserved.
International Headquarters:The Raymond James Financial Center | 880 Carillon Parkway | St. Petersburg, Florida 33716 | 800-248-8863 15Raymond James Investment Strategy
International securities involve additional risks such as currency fluctuations, differing financial accounting standards, and possible political and economic instability. These risks are
greater in emerging markets.
Small-cap stocks generally involve greater risks. Dividends are not guaranteed and will fluctuate. Past performance may not be indicative of future results.
Investors should consider the investment objectives, risks, and charges and expenses of mutual funds and exchange-traded funds carefully before investing. The prospectus contains
this and other information about mutual funds and exchange –traded funds. The prospectus is available from your financial advisor and should be read carefully before investing.
Not approved for rollover solicitations.
For clients in the United Kingdom:
For clients of Raymond James Financial International Limited (RJFI): This document and any investment to which this document relates is intended for the sole use of the persons to
whom it is addressed, being persons who are Eligible Counterparties or Professional Clients as described in the FCA rules or persons described in Articles 19(5) (Investment professionals)
or 49(2) (High net worth companies, unincorporated associations etc) of the Financial Services and Markets Act 2000 (Financial Promotion) Order 2005 (as amended) or any other person
to whom this promotion may lawfully be directed. It is not intended to be distributed or passed on, directly or indirectly, to any other class of persons and may not be relied upon by such
persons and is therefore not intended for private individuals or those who would be classified as Retail Clients.
For clients of Raymond James Investment Services, Ltd.: This report is for the use of professional investment advisers and managers and is not intended for use by clients.
For purposes of the Financial Conduct Authority requirements, this research report is classified as independent with respect to conflict of interest management. RJFI, and Raymond James
Investment Services, Ltd. are authorised and regulated by the Financial Conduct Authority in the United Kingdom.
For clients in France:
This document and any investment to which this document relates is intended for the sole use of the persons to whom it is addressed, being persons who are Eligible Counterparties or
Professional Clients as described in “Code Monétaire et Financier” and Règlement Général de l’Autorité des Marchés Financiers. It is not intended to be distributed or passed on, directly
or indirectly, to any other class of persons and may not be relied upon by such persons and is therefore not intended for private individuals or those who would be classified as Retail
Clients.
For clients of Raymond James Euro Equities: Raymond James Euro Equities is authorised and regulated by the Autorité de Contrôle Prudentiel et de Résolution and the Autorité des
Marchés Financiers.
For institutional clients in the European Economic Area (EEA) outside of the United Kingdom:
This document (and any attachments or exhibits hereto) is intended only for EEA institutional clients or others to whom it may lawfully be submitted.
For Canadian clients:
This report is not prepared subject to Canadian disclosure requirements, unless a Canadian analyst has contributed to the content of the report. In the case where there is Canadian
analyst contribution, the report meets all applicable IIROC disclosure requirements.
Proprietary Rights Notice: By accepting a copy of this report, you acknowledge and agree as follows:
This report is provided to clients of Raymond James only for your personal, noncommercial use. Except as expressly authorized by Raymond James, you may not copy, reproduce, transmit,
sell, display, distribute, publish, broadcast, circulate, modify, disseminate or commercially exploit the information contained in this report, in printed, electronic or any other form, in any
manner, without the prior express written consent of Raymond James. You also agree not to use the information provided in this report for any unlawful purpose. This is RJA client relea sable research
This report and its contents are the property of Raymond James and are protected by applicable copyright, trade secret or other intellectual property laws (of the United States and other
countries). United States law, 17 U.S.C. Sec.501 et seq, provides for civil and criminal penalties for copyright infringement. No copyright claimed in incorporated U.S. government works.
© 2018 Raymond James & Associates, Inc., member New York Stock Exchange/SIPC. All rights reserved.
International Headquarters:The Raymond James Financial Center | 880 Carillon Parkway | St. Petersburg, Florida 33716 | 800-248-8863 16You can also read