Australian Student Accommodation 2020
←
→
Page content transcription
If your browser does not render page correctly, please read the page content below
Australia | December 2020

S P OT L I G H T    Australian Student
Savills Research
                   Accommodation 2020

                                                   Iglu South Yarra, Melbourne
Australia Student Accommodation - December 2020

      ɋ Despite challenging operating conditions                                      campus properties is expecting to stay in
        with the onset of the COVID pandemic,                                         the range of 50 – 70%
        the Australian student accommodation      ɋ Scape has dominated the mergers and
        market is set to record over $3bn in        acquisitions in the last 18 months and
        transaction volumes in 2020                 now has a portfolio of over 12,500 beds
      ɋ Sentiment remains strong for investment     and a pipeline of nearly 10,000 beds
        in 2021 with the anticipated easing of    ɋ Opportunities exist for further supply of
        international border restrictions in Q2     accommodation in all capital cities with
        allowing international students back into   diversification of product mix a key point
        the country by Semester 2                   of differentiation
      ɋ Rental levels look set to remain relatively
        static in 2021 and occupancy across off-

Australian PBSA to Enter the Third Stage of Evolution
Investor interest and transaction volumes have continued to accelerate           The border remaining closed is expected to impact international student
over the last 18 months. Despite cooling conditions following the COVID-19       arrivals towards the start of Semester 1 2021. Demand for PBSA is
pandemic, Savills forecast an improving market heading into 2021.                expected to be supplemented by domestic students who are unable to
                                                                                 study abroad and instead will remain in Australia.
The First Stage of growth in the private sector market (pre-2010) was
predominantly residential Build-To-Sell (BTS) apartment projects                 COVID has accelerated a number of trends which Savills have identified
with limited aspects of purpose built design, held in one line, or sold          as the pivot towards a Third Stage of the market emerging in 2021, which is
as individual strata units, run by third party operators. This offered           which is anticipated to include diversification of product mix and targeted
diversification to students away from University and College controlled          growth into second tier markets. Students are being offered a wider
accommodation which historically had prevailed.                                  range of tenancy periods and operators are more focussed on physical
                                                                                 and mental well-being with support in both areas increasing. ESG and
From 2010 onwards the Second Stage commenced. National and
                                                                                 sustainable investment will also be high priorities for the vast majority of
global investor / operators moved into the market and began to
                                                                                 investors in the sector.
deliver institutional grade assets of scale, coupled with enhanced
levels of service. New capital was attracted to the market by the                In the short to medium term Savills expects University participation
imbalance of supply and demand, strong growth in international                   (on and off campus) will grow, driven by lower Federal Government
students and attractive returns compared to other real estate asset              funding for new facilities including on-campus accommodation. This is
classes in Australia, and more established student accommodation                 anticipated to create more opportunity for private sector participation in
markets globally. Moving into 2019 the first portfolios were offered             partnership with Higher Education Institutions and a wider acceptance of
to the market and as widely anticipated, yields were driven down as              off-campus PBSA leading to more long-term occupancy agreements.
transactions and liquidity increased. Scape has dominated the market
                                                                                 Once the international border reopens, we anticipate an increasing
consolidating the Atira and Urbanest Platforms.
                                                                                 number of international students will be attracted to study onshore in
2020 began with record demand for operational PBSA, most schemes                 Australia, with the Higher Education sector expected to gain market share
being booked out or nearing capacity. The closure of the international           from key competitors such as the UK and US. From 2022 we anticipate
border in March had a significant impact on the ability of international         a return to strong levels of occupancy in operational accommodation.
students to arrive in Australia - most affected were Chinese students.           Investor sentiment has remained strong for forward commitment
Consequently, occupancy levels averaged 50 – 70% through Semesters               opportunities with projects programmed for 2023 and beyond openings.
1 and 2.                                                                         Significant numbers of global investors are recognising the value offered
                                                                                 by a sector with strong underlying fundamentals.

savills.com.au/studentaccommodation                                          2
Australia Student Accommodation - December 2020

                                                  Wee Hur / Y Suites A’Beckett,
                                                                    Melbourne

                       3
Australia Student Accommodation - December 2020

savills.com.au/studentaccommodation                          4
Australia Student Accommodation - December 2020

            A Focus on the Key Markets
            ɋ Sydney – land price remains high and          of stabilising occupancy pre-COVID,
              demand for competing uses continues           investor sentiment is improving, and we
              to make PBSA feasibility challenging.         expect a fresh focus on new development
              Proposed changes to planning regulations      will occur. We anticipate that these
              will potentially further restrict the near-   developments will be targeted towards
              term delivery pipeline. Savills anticipates   prime sites in immediate proximity to
              increasing supply in mixed use projects       Universities.
              alongside Co-living and Multifamily         ɋ Adelaide – several new projects have been
              (Build-to-Rent).                              delivered in the last three years and more
            ɋ Melbourne – the recent surge in delivery      supply is currently under construction.
              of new accommodation over the last three      Uptake for new accommodation has been
              years has not kept up with the increasing     solid, but rental affordability continues to
              student population and implied demand         challenge the feasibility of new projects.
              for off-campus accommodation.               ɋ Perth – delivery of new accommodation
              Development sites remain plentiful;           in recent years has been limited, but
              however, developers are expecting to          recent announcements confirming two
              focus on prime locations and to also focus    universities moving into the CBD from
              on mixed-use development.                     2025 is expected to act as a catalyst for
            ɋ Brisbane – following a large expansion in                           further supply.
              supply over the last five years and a period

       Student Accommodation Sector to Double in                                Total Value of the Sector
                            $49.7bn
       Value in the Next 171,170
                          five Years
                                 Beds                                                                       $50bn
      From 2015 to 2020 the delivery of new purpose built student                                           2025
      accommodation (PBSA) accelerated across several capital cities,
      with a strong focus on Brisbane (23% of new beds) and Melbourne
 $26.6bn                                                                                          $27bn
23,844(45% of new beds). Sydney’s supply of new accommodation has been
        Beds                                                                                      2020
      constrained by high barriers to entry including land values and the
      planning system.                                                              $11bn
                                                                                    2015
       Increasing supply coupled with lower yields and higher values has
       helped contribute to the estimated total value of the sector more
       than doubling in the last five years to $27bn. Looking forward
       to 2025 Savills is forecasting the value of the Australian student
       accommodation sector to nearly double again, reaching $50bn.

                                                                                Source: Savills

     2020                           2025

ds                 Total Value
                                                                            5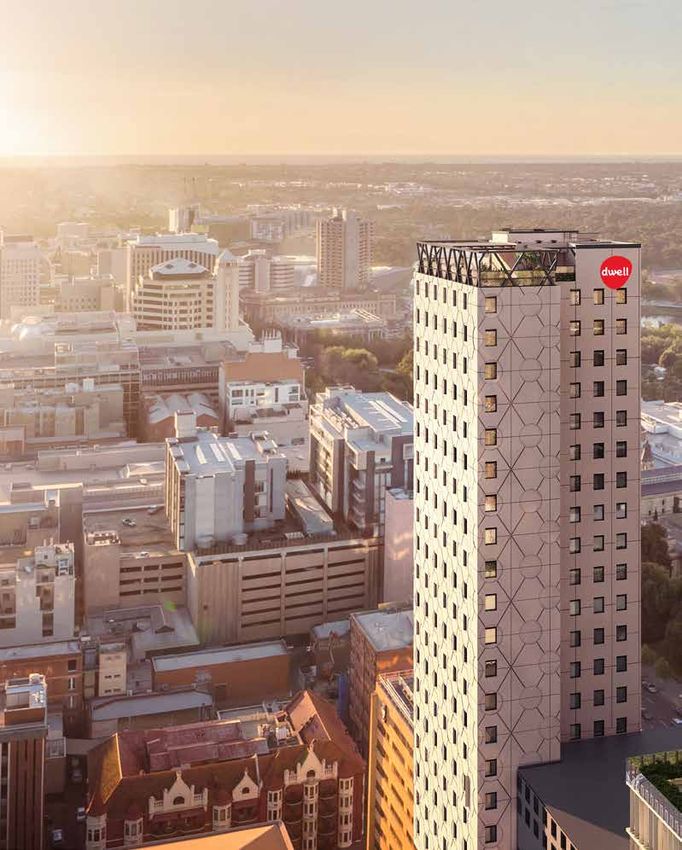
Australia Student Accommodation - December 2020

Mobility Driving Enrolments
For the past 18 years, or since the time series began in 2001,
full time University students in Australia have grown year
on year.
Initially domestic population growth and rising participation rates were the major
contributors to enrolment growth. The domestic cohort had plateaued over recent
years, however, domestic applications for undergraduate courses increased by 0.9% for
the 2020 academic year, following falls of 1.3% in 2019 and 2.6% in 2018.
As the majority of Universities return to face-to-face on campus learning for the
upcoming academic year, it is widely expected that the COVID-19 recession will lead
to even more Australians applying for University in 2021. The Federal Government has
taken action to meet anticipated demand by creating up to 30,000 additional places
for Australian students.

University Enrolment Growth
                       1,250,000                                                                                   20%

                       1,000,000                                                                                   15%
 Full time Students

                                                                                                                         Annual Growth

                        750,000                                                                                    10%

                        500,000                                                                                    5%

                        250,000                                                                                    0%

                               0                                                                                   -5%

                                      Domestic Students                           Overseas Students
                                      Domestic Student Annual Growth              Overseas Student Annual Growth

Source: Savills, Department of Education, Skills and Employment

For the second phase of this almost two-decade period, growth has been powered by
international students. In recent years, students have been moving around the world more
than ever before. In 2017, over 5 million students studied abroad, according to figures from
UNESCO.
University degrees from English-speaking countries are highly desirable for international
students and so Anglophone markets tend to be the most attractive destinations. The US
is the largest inbound market for international students, followed by the UK. Australia,
placed third, has seen fast growth in recent years, benefiting from its proximity to major
source markets such as China and boasting attractive post-study employment rights.
The latest statistics reflecting data from before the COVID-19 pandemic, shows that
international student enrolment in Australia increased by 21% between 2017 and 2019,
compared with 10% in the UK (between the 2016/17 and 2018/2019 academic year).

Global Higher Education Enrolment
                                                     1 year growth     5 year growth

                          China
                       Australia
                           India
                         Ireland
                      Singapore
               Netherlands
                          Spain
                         France
                      Germany
                        Canada
                           Italy
                       Portugal
                            UK
                         Japan
                        Austria
                             US
             South Korea
                        Finland
                       Denmark
Czech Republic
                        Poland

                               -20%    -15%       -10%       -5%        0%         5%       10%       15%          20%

Source: Savills, Department of Education, Skills and Employment

savills.com.au/studentaccommodation                                                                                                      6
Australia Student Accommodation - December 2020

                             A large proportion of these globally mobile students are from Asia.
Iglu Redfern, Sydney         China is the largest source market, but an increasing number come
                             from India, which has seen faster growth in outbound students as the
                             country’s wealth has increased.
                             In Australia, Indian University students have grown by 14% per annum
                             over the past 10 years. The number of Indian students now enrolled in
                             Australia is almost equal to the number of Chinese students enrolled in
                             Australia a decade ago.

                             International Enrolment Growth in Australia
                                                  175,000                                                  25%

                                                  150,000                                                  20%

                                                  125,000                                                  15%

                             Number of Students
                                                  100,000                                                  10%

                                                  75,000                                                   5%

                                                  50,000                                                   0%

                                                  25,000                                                   -5%

                                                       0                                                   -10%

                                                                2010       2020       10 year CAGR (RHS)

                             Source: Savills, Department of Education, Skills and Employment

                             Greater international student mobility has gone hand-in-hand with
                             a growing PBSA market. International students have contributed
                             significantly to the success of this sector. Unfamiliar with local housing
                             markets and often possessing greater budgets than domestic students,
                             they have acted as an important and growing demand base.

                             COVID Impact
                             The COVID pandemic has brought near-term challenges for the
                             University and PBSA sector. International students have borne the brunt
                             of the disruption from travel restrictions imposed in March 2020.
                             In addition to a leakage of students throughout the year repatriating
                             back to home nations, at least 74,421 Higher Education students enrolled
                             on courses were outside of Australia, as at mid-September 2020,
                             according to the Department of Home Affairs’ student visa location
                             data. These students form 25% of all international students, Chinese
                             students account for 73% of these students (54,391).
                             The real impact on student numbers moving forward will not be known
                             for some time. Early indicators suggest there is likely to be a moderate
                             fall in international onshore enrolments for Semester 1 2021 given the
                             ongoing travel and social restrictions.

                         7
Australia Student Accommodation - December 2020
Expanding Supply Pipeline
There are now 109,000 beds across the Australian accommodation beds under construction. 2021 is on track to see 9,775
new beds enter the market.
student accommodation market, 84% of all beds
are located across the eight Capital Cities. 2020 Development activity has increased throughout the year and the
saw the lowest level of new completions in over a appetite for well-located student accommodation development sites
has become even more aggressive across Sydney and Melbourne,
decade with 1,025 new beds entering the market highlighting the belief in the long-term fundamentals of the sector.
following a record year of development in 2019.
Savills are tracking over 33,000 beds which could be developed over the
next five years (to the end of 2025), 12% more beds than were delivered
In anticipation of improved trading outcomes, a number of schemes during the previous five years (2016 - 2020). Melbourne and Sydney
delayed their openings until Semester 1 2021, boosting anticipated 2021 remain the most active development markets, accounting for 57% of the
delivery levels. As it currently stands there are over 13,200 student future supply pipeline.
New Supply of Student Accommodation Five Year Supply
14,000 160,000
2011 to 2015 14,500
12,000 140,000
120,000
10,000
Annual New Supply
Total Student Beds
2016 to 2020 29,907
100,000
8,000
80,000
2021 to 2025 33,487
6,000
60,000
4,000
40,000
Source: Savills
2,000 20,000
0 0
2009
2010
2011
2012
2013
2014
2015
2016
2017
2018
2019
2020
2021 (f)
2022 (f)
2023 (f)
2024 (f)
2025 (f)
Source: Savills
Supply By Location Size of New Developments
(5 Year Period)
12,000
20
11,201
25 1
10,746
10,000
0
1-
-2
20
21
15
8,000 277
8,613
20
8,230
397
6,000
Average size
of scheme
4,000
4,264
3,386
3,166
2,720
2,000
2,434
453
1,297
0
0
Melbourne Brisbane Sydney Adelaide Perth
-2 02
Completed Beds (2015 - 2020) Pipeline Beds (2021 - 2026) 2016
Source: Savills
Source: Savills
savills.com.au/studentaccommodation 8
Australia Student Accommodation - December 2020

                                                  The Student Housing Company,
                                                    University Square, Melbourne

                       9
Australia Student Accommodation - December 2020

Where Students Live
The provision of student accommodation beds across the Australian Greater Capital Cities
remains substantially lower than global benchmark cities. As an example, 36% of all full-time
students in London have access to a student accommodation bed, that figure is just 8% in Sydney.

When comparing markets, one difference between the Australian and UK market is the propensity of domestic students to move away from
home for University education – and therefore demanding accommodation.
Historically, cultural drivers and specialisation of course offerings from UK universities has led to much higher rates of domestic students
leaving home and travelling to attend University studies, compared with Australia, thus the requirement for higher rates of supply. Albeit not
a diminutive number, 120,000 domestic students live away from home during term time, up 23,000 since 2012. As preferences and lifestyle
choices evolve this figure is likely to increase adding to the demand catchment for providers of student accommodation in Australia.

Student Accommodation Provision Rate                                                                                                  Domestic Student Mobility
80%                                                                                                                                   125,000                                                                                       17.0%
                                                                                                                          70%
70%

60%                                                                                                             57%                   100,000                                                                                       16.5%

                                                                                                       49%
50%

                                                                                     38%      39%                                      75,000                                                                                       16.0%
                                                                  36%      37%
40%

30%
                                                                                                                                       50,000                                                                                       15.5%
20%                                                      17%
                                      13%      14%
                   12%       12%
           9%
10%                                                                                                                                    25,000                                                                                       15.0%

 0%

                                                                                                                                             0                                                                                      14.5%
                                                                                                                                                    2012      2013      2014       2015     2016       2017       2018       2019

                                                                                                                                                           Intrastate          Interstate          % proportion of all domestic
                                      Existing Provision             Future Provision

Source: Savills, Department of Education, Skills and Employment, HESA                                                                Source: Savills, Department of Education, Skills and Employment
The chart above provides a summary of the existing supply of PBSA (navy bars) and the proposed development pipeline
(sky blue bars) against full-time student numbers, with student numbers remaining static, the cities are sorted by the total
provision of accommodation including pipeline

The following analysis provides a snapshot of the current population of full-time students in the greater statistical areas of Australia’s
main capital cities measured against the number of student accommodation beds.
The analysis focuses on the provision of student accommodation by both the universities and the commercial providers. Students who
are not living in professionally provided accommodation, are classified as either renting in the private sector, or living in family associated
accommodation.

                                                                                                      Key to table

                                                                                                                                                  Commercial
                                         Full Time Students
                                                                                                                                                  Accommodation

                                          University                                                                                               Students renting privately
                                          Accommodation                                                                                            or living at home

savills.com.au/studentaccommodation                                                                                             10
Australia Student Accommodation - December 2020
335,504 10,429 18,164 306,911
Melbourne
Full Time 3.10% 5.40% 91.50%
Students University Commercial Students renting
Accommodation Accommodation privately or living at home
250,314 9,488 11,069 229,757
Sydney
Full Time 3.80% 4.40% 91.80%
Students University Commercial Students renting
Accommodation Accommodation privately or living at home
155,448 3,701 12,679 139,068
Brisbane
Full Time 2.40% 8.20% 89.40%
Students University Commercial Students renting
Accommodation Accommodation privately or living at home
104,738 3,123 3,077 98,538
Perth
Full Time 3.00% 2.90% 94.10%
Students University Commercial Students renting
Accommodation Accommodation privately or living at home
79,104 2,344 5,416 71,344
Adelaide
Full Time 3.00% 6.80% 90.20%
Students University Commercial Students renting
Accommodation Accommodation privately or living at home
33,186 4,722 4,880 23,584
Canberra
Full Time 14.20% 14.70% 71.10%
Students University Commercial Students renting
Accommodation Accommodation privately or living at home
12,990 1,586 134 11,270
Hobart
Full Time 12.20% 1.00% 86.80%
Students University Commercial Students renting
Accommodation Accommodation privately or living at home
6,224 494 303 5,427
Darwin
Full Time 7.90% 4.90% 87.20%
Students University Commercial Students renting
Accommodation Accommodation privately or living at home
Source: Savills, Department of Education, Skills and Employment
11Australia Student Accommodation - December 2020
Top Ten Providers
The following table provides a summary of the existing student accommodation beds owned,
together with the development pipeline for the top private sector owners across Australia, as at
the start of Semester 2 2020.
The Top 10 Owners currently control a total of 39,139 beds across 83 properties at an average size of 472 beds. A further 39 properties
are planned by the Top 10 totalling a further 20,455 beds at an average size of 524 beds. Once the pipeline is complete the number
of beds owned by those currently in the Top 10 will be 59,594, illustrating an appetite to increase exposure to Australian student
accommodation.
Top 10 Owners of Student Accommodation by Existing and Development Pipeline
Properties in Beds in Total Properties Total Beds
Operational Operational Development Development (Operational and in (Operational and in
OWNED Properties Beds Pipeline Pipeline Development Pipeline) Development Pipeline)
Scape 24 12,675 18 9,475 42 22,150
AMP Capital 12 5,119 2 1,196 14 6,315
Iglu 9 3,814 7 2,288 16 6,102
Wee Hur 2 2,350 5 3,259 7 5,609
Cedar Pacific 4 2,311 4 2,893 8 5,204
CLV 9 4,719 0 0 9 4,719
HRL Morrison 7 2,694 0 0 7 2,694
Student One 3 2,396 0 0 3 2,396
DIF Capital Partners 10 1,808 1 421 11 2,229
GSA Group 3 1,253 2 923 5 2,176
Source: Savills
The table below shows the Top 10 Operators of student accommodation ranked by total beds under management (including existing
operational beds and development pipeline). The Top 10 Operators currently manage a combined 58,124 beds. Including properties to be
developed the Top 10 Operators will manage 84,247 beds across 244 properties.
Top 10 Operators of Student Accommodation by Existing and Development Pipeline
Properties in Beds in Total Properties Total Beds
Operational Operational Development Development (Operational and in (Operational and in
OPERATORS Properties Beds Pipeline Pipeline Development Pipeline) Development Pipeline)
UniLodge 65 21,231 20 11,698 85 32,929
Scape 24 12,675 18 9,475 42 22,150
CLV 12 9,242 0 0 12 9,242
Iglu 9 3,814 7 2288 16 6,102
SHA 53 2,750 16 1,152 69 3,902
HRL Morrison 7 2,694 0 0 7 2,694
The Student Housing Company 4 1,622 2 923 6 2,545
Student One 3 2,396 0 0 3 2,396
Journal Student Living 1 804 1 587 2 1,391
dwell 2 896 0 0 2 896
Source: Savills
Scape includes the Urbanest and Atira Brands
savills.com.au/studentaccommodation 12Australia Student Accommodation - December 2020
UniLodge Royal Melbourne,
Melbourne
13Australia Student Accommodation - December 2020
Investment
Investors’ focus on student accommodation has been
growing over the past decade. Strong underlying
fundamentals, stable income streams, and the desire
to diversify portfolios have significantly increased
investor appetite for these assets.
The operational residential sector’s fundamentals hold true in today’s
challenging macro environment. Students still require a place to live,
and demographic trends and affordability constraints will continue to
drive demand for rental accommodation. Total global investment into
student accommodation reached US$18bn in 2019, a new record.
Despite wider global uncertainty, a number of major deals have
completed – several at such a large scale that national records were
broken. There is no shortage of capital targeting operational student
accommodation assets. The challenge (and opportunity), in Australia
at least, is finding completed assets in which to invest.
Consolidation has been a key driver in the student accommodation sector
in Australia, which has registered record investment volumes for 2020,
forecast to total AUD$3.1bn, an increase of 115% on 2019 levels. Scape has
been the most active investor acquiring the Urbanest portfolio for a fee
reportedly over AUD$2.1bn in the biggest deal of the year.
Global Investment into Student Accommodation
$20
$18
$16
Investment (USD, billions)
$14
$12
$10
$8
$6
$4
$2
$0
2007 2008 2009 2010 2011 2012 2013 2014 2015 2016 2017 2018 2019 2020
(Q1-Q3)
US UK Western Europe (exl UK) Rest of World
Source: Savills, RCA
Australia Transaction Volumes
Year $ AUD Millions No. of Beds
2012 0 0
2013 $43 403
2014 $530 1,363
2015 $87 877
2016 $557 3,993
2017 $475 1,321
2018 $440 1,554
2019 $1,446 8,025
2020F $3,112 11,160
Source: Savills, RCA
savills.com.au/studentaccommodation 14Australia Student Accommodation - December 2020
dwell East End Adelaide, Adelaide
15Australia Student Accommodation - December 2020
Unilodge Southbank, Brisbane
savills.com.au/studentaccommodation 16Australia Student Accommodation - December 2020
Yield Trends
For student accommodation, yields have generally moved in recent years as
the operational residential asset class has matured.
In Australia student accommodation yields are now stabilising in most markets, following a significant
inward yield shift trend over the past five years and the increase in investment throughout 2019 and
2020.
Further yield compression in the coming year is likely to be more limited as the impact of COVID-19
subdues rental growth ability.
Australia Student Accommodation Yields vs Benchmark Investments
8.0% 3.0%
7.5%
2.5%
7.0%
6.5% 2.0%
6.0%
1.5%
5.5%
5.0% 1.0%
4.5%
0.5%
4.0%
3.5% 0.0%
2015 2016 2017 2018 2019 2020
10-Year Bond Rate (RHS) Australia CBD Office Australia Retail
Australia Industrial Austrlaia PBSA UK PBSA
US PBSA
Source: Savills, RCA, MSCI
Australian Student Accommodation Yields by City
Location / Grade Lower Range Upper Range
Sydney – Prime 5.00% 5.50%
Sydney – Secondary 6.00% 6.50%
Melbourne – Prime 5.00% 5.50%
Melbourne – Secondary 6.50% 7.50%
Brisbane – Prime 7.00% 7.25%
Brisbane – Secondary 7.50% 8.00%
Other Capital City CBDs – Prime 6.50% 7.50%
Other Capital City CBDs – Secondary 8.00% 8.50%
Source: Savills
17Australia Student Accommodation - December 2020 Outlook: The View From Within Luke Nolan | CEO and Founder | Student.com Scape Swanston, Melbourne As the Savills Report suggests January and February were record high months for our Australia and New Zealand business, so until the pandemic, Student.com were set to have one of our best years in operation. When the borders were closed in February to China, our student accommodation booking platform still saw a large number of students willing to book. China and all source corridors were still willing to lock in accommodation provided borders reopen and face-to-face classes resumed from Semester 2. It was not until around June that a significant drop in offshore demand materialised. Post the onset of the pandemic private studios have been the most sought-after room type in Australia. In contrast, before the pandemic, room type popularity was dependent on destination and price point. Since the pandemic hit regardless of price point or destination City studios or private room types have been the most highly sought product type. In a normal year 25% of domestic year 12 students would take a gap year. With travel off the cards for 2021, a larger domestic cohort is enrolling and booking student accommodation for 2021. Lower Australian Tertiary Admission Rank’s (ATAR) being accepted across various Universities will contribute to the growth in the domestic market. When Australia’s borders closed, and universities moved to online learning, political ties between China and the US were fragile. At this point accommodation agents pushed countries like the UK and the rest of Europe guaranteeing students would receive visas and face-to-face learning. Now with the second and third waves hitting the UK and the rest of Europe, parents and students feel mislead as these countries no longer feel safe or can offer the traditional University experience. Feedback from across the Student.com agent network is that as levels of new COVID cases reach record highs across the Northern Hemisphere, parents and students appreciate the safety instilled by the Australian Federal and State Governments, which has built enormous trust in their ability to aggressively suppress COVID and provide a safe living environment. This has placed Australia in an excellent position to increase market share of globally mobile students when borders reopen to international students and face-to-face classes return. Luke Nolan CEO and Founder Student.com savills.com.au/studentaccommodation 18
Australia Student Accommodation - December 2020

                      19
Savills Team
Please contact us for further information
Key Contacts
Conal Newland Paul Savitz Levina Lin Jarrad Clarke
National Director Director Valuer Valuer
Student Accommodation Student Accommodation Student Accommodation Student Accommodation
+61 (0) 2 8215 8863 +61 (0) 2 8215 6049 +61 (0) 2 8215 8964 +61 (0) 2 8213 4866
cnewland@savills.com.au psavitz@savills.com.au llin@savills.com.au jclarke@savills.com.au
Savills plc: Savills plc is a global real estate services provider listed on the London Stock Exchange. We have an international network of more than 600 offices and associates throughout the Americas, the UK,
continental Europe, Asia Pacific, Africa and the Middle East, offering a broad range of specialist advisory, management and transactional services to clients all over the world. This report is for general informative
purposes only. It may not be published, reproduced or quoted in part or in whole, nor may it be used as a basis for any contract, prospectus, agreement or other document without prior consent. While every effort has
been made to ensure its accuracy, Savills accepts no liability whatsoever for any direct or consequential loss arising from its use. The content is strictly copyright and reproduction of the whole or part of it in any form
is prohibited without written permission from Savills Research.You can also read