Identifying Brain Characteristics of Bright Students - Scientific ...
←
→
Page content transcription
If your browser does not render page correctly, please read the page content below
Journal of Intelligent Learning Systems and Applications, 2018, 10, 93-103
                                                                                                       http://www.scirp.org/journal/jilsa
                                                                                                                 ISSN Online: 2150-8410
                                                                                                                   ISSN Print: 2150-8402

Identifying Brain Characteristics of Bright
Students

Ramla Ghali1, Hamdi Ben Abdessalem2, Claude Frasson2, Roger Nkambou1

Department of Computer Science, Université du Québec à Montréal, Montréal, Canada
1

Department of Computer Science and Operations Research, Université de Montréal, Montréal, Canada
2

How to cite this paper: Ghali, R., Abdes-          Abstract
salem, H.B., Frasson, C. and Nkambou, R.
(2018) Identifying Brain Characteristics of        Gifted students have different ways of learning. They are characterized by a
Bright Students. Journal of Intelligent Learn-     fitful level of attention and intuitive reasoning. In order to distinguish gifted
ing Systems and Applications, 10, 93-103.
                                                   students from normal students, we conducted an experiment with 17 pupils,
https://doi.org/10.4236/jilsa.2018.103006
                                                   willing participants in this study. We collected different types of data (gender,
Received: June 8, 2018                             age, performance, initial average in math and EEG mental states) in a web
Accepted: August 5, 2018                           platform called NetMath intending for the learning of mathematics. We se-
Published: August 8, 2018
                                                   lected ten tasks divided into three difficulty levels (easy, medium and hard).
Copyright © 2018 by authors and                    Participants were invited to respond to top-level exercises on the four basic
Scientific Research Publishing Inc.                operations in decimals. Our first results confirmed that the student’s perfor-
This work is licensed under the Creative
                                                   mance has no relation with age. A younger 9-year-old student achieved a
Commons Attribution International
License (CC BY 4.0).                               higher score than the group with an average of 68.18%. This student can be
http://creativecommons.org/licenses/by/4.0/        considered as a gifted one. The gifted students can be also characterized by a
                 Open Access                       mean value of attention (around 60%). They also can be defined by slightly
                                                   weaker values of their mental states of attention and workload in comparison
                                                   with the weak pupils.

                                                   Keywords
                                                   NetMath Platform, Performance, Workload, Attention, Relaxation, Decimal
                                                   Numbers

                                                 1. Introduction
                                                 Nowadays, the performance of learners in primary schools differs from one in-
                                                 dividual to another. We find more students who perform below the average than
                                                 others whose performance exceeds the group average. The latter is often much
                                                 more advanced than other students and is bored in class because the presented
                                                 information is already obvious to them and too easy. We were talking about

DOI: 10.4236/jilsa.2018.103006         Aug. 8, 2018                   93         Journal of Intelligent Learning Systems and Applications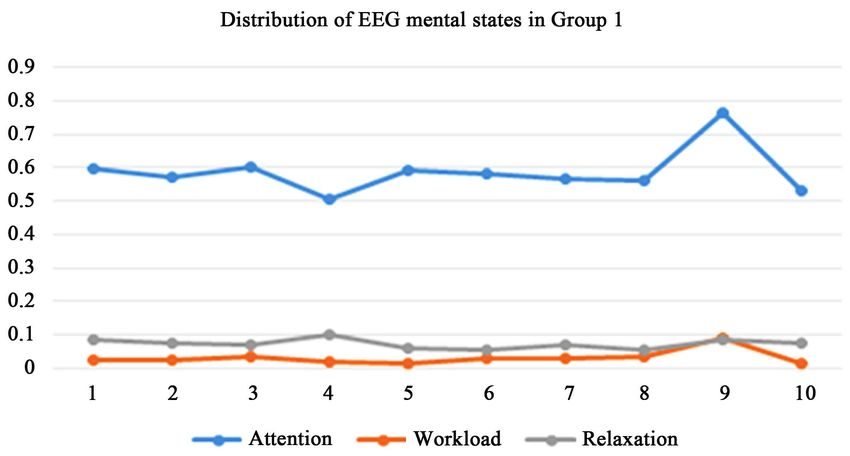
R. Ghali et al.

                                 gifted, talented or high creativity students. According to Zettel (1979), general
                                 intelligence usually manifests in intelligent quotient (IQ). Gifted students have
                                 an IQ of 130 or above. These students are “endowed by nature with high intel-
                                 lectual capacity and have a native capacity for high potential intellectual attain-
                                 ment and scholastic achievement [1]”. Usually, gifted students have a school
                                 achievement higher than their age. They have a different mode of operation.
                                 They rely on intuitive reasoning [2] and have a high speed of information
                                 transmission. Three main characteristics distinguish gifted students: critical, in-
                                 dependent of though and judgment and persistent [3] [4]. Gifted, creative, and
                                 talented students have special educational needs: they may learn in some ways
                                 which are different from other students; they are more curious; and they think
                                 more abstractly. At the same time, gifted students present the risk of developing
                                 difficulties of adaptation, a lack of school motivation, anxious-depressive symp-
                                 toms (such as frustration and boredom) and a lack of attention.
                                   In literature, several studies have been conducted to identify and detect gifted
                                 students. Most studies focus on the measurement of intelligence quotient (IQ)
                                 with psychometric tests such as the Wechsler Intelligence Scale for Children
                                 (WISC) [5], the Wechsler Abbreviated Scale of Intelligence (WASI) [6], and Ra-
                                 ven’s progressive matrices [7]. However, to our knowledge, very few studies have
                                 been interested in establishing personal and biometric characteristics of these
                                 individuals. In order to answer this point, we propose in this paper to develop
                                 measures allowing both to examine the performance of talented students and to
                                 study the evolution of their biometric measurements resulting from electroen-
                                 cephalogram signal (EEG). More specifically, we are interested in studying the
                                 variation of three mental states extracted from EEG (attention, cognitive load
                                 and relaxation). These measures would establish some characteristics of this
                                 population.
                                   The paper is organized as follows. In Section 2 we talk about related works in
                                 assessing and identifying gifted students. Section 3 describes our experimental
                                 environment designed to evaluate student’s performance in mathematics, called
                                 NetMath. In Section 4, we describe the experiment conducted in a primary
                                 school. Finally, Section 5 shows our obtained results in term of gifted students
                                 achievement and EEG mental states variation.

                                 2. Related Works
                                 2.1. Gifted Students: A Definition
                                 Historically, there are many definitions and conceptualizations of gifted and ta-
                                 lented students [8] [9] [10] [11]. Some authors allege that the high intellectual
                                 potential is innate (genetically present) and others that it represents the result of
                                 training or development of abilities or capacities of the child. Intellectual as-
                                 sessment or intelligence quotient remains an important indicator of giftedness.
                                 Two essential models are used to define giftedness [12], the one of Renzulli [10]
                                 and the other of Sternberg [11]. According to Renzulli [10], there are two sorts

DOI: 10.4236/jilsa.2018.103006                         94        Journal of Intelligent Learning Systems and Applications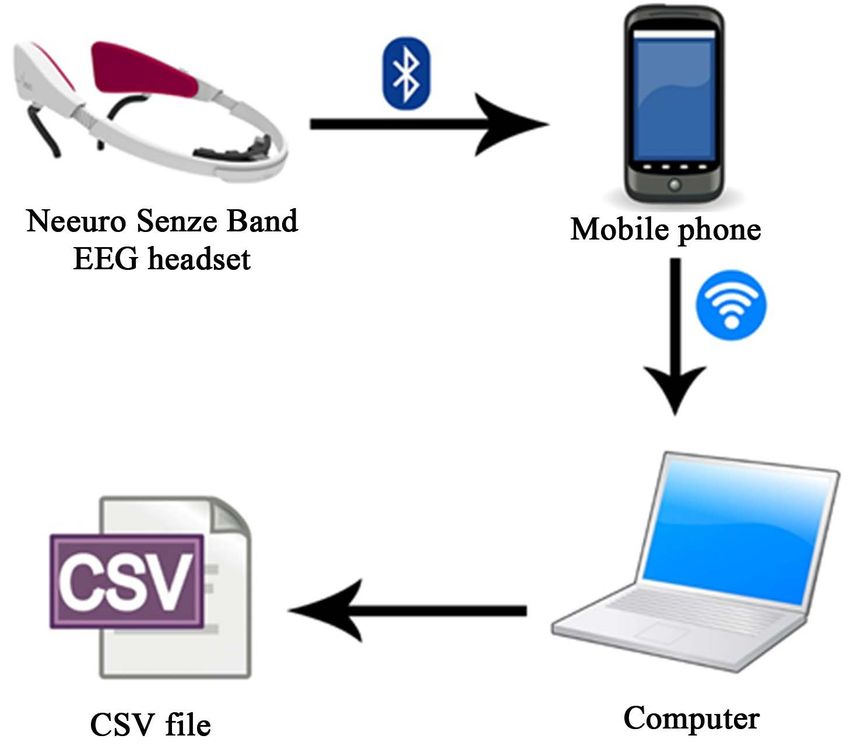
R. Ghali et al.

                                 of gifted students: the first type corresponds to those with high academic poten-
                                 tial. The second type corresponds to those with high creative potential. It pro-
                                 poses three components of skills to characterize the behavior of gifted children
                                 (intelligence, creativity and implication). These components interact. Sternberg
                                 [11] described a model of five criteria (excellence in one area relative to other
                                 people, scarcity of the level reached against peers, potential to produce some-
                                 thing, ability to demonstrate skills with a valid assessment, and relative value of
                                 the skill for society).

                                 2.2. IQ and Giftedness
                                 Although there is not a way to measure giftedness and intelligence, researchers
                                 agree that intellectual measurement or intelligence quotient measurement (IQ)
                                 can be considered as an intelligence measurement. IQ is a numerical value that
                                 reflects the overall intelligence of the person [13]. Currently, 2.28% of the popu-
                                 lation is gifted children [14]. These children have an IQ higher than 130 [15].
                                 However, an IQ between 90 and 110 is considered as a normal child and
                                 presents 50% of population. Gifted students have a high IQ, differently treat
                                 stimuli, feel different things and think in a different way. To measure the IQ,
                                 neuropsychologists use psychometric tests such as the Wechsler test [5] [6] and
                                 the progressive matrices of Raven [7]. There are many forms and versions of
                                 Wechsler test such as WISC (Wechsler Intelligence Scale for Children) and
                                 WASI (Wechsler Abbreviated Scale of Intelligence) the abbreviated version for
                                 this test. For example, WISC V is consisting of 15 subtests. It is indicated for
                                 children between 6 and 16 year olds. It measures five cognitive functions (verbal
                                 comprehension, fluid reasoning, visuospatial skills, working memory and
                                 transmission speed). The test period is about one hour. In order to reduce this
                                 time, an abbreviated version of this term is also proposed called the WASI. This
                                 test is used to estimate IQ scores rapidly and efficiently when administration of
                                 full battery is neither feasible nor necessary. It takes about 30 minutes and
                                 measures four subsets of cognitive functions (block design, vocabulary, matrix
                                 reasoning, and similarities). These two latter tests require the knowledge of a
                                 psychologist. However, for research purposes, Raven Progressive Matrix could
                                 be also used to assess IQ. An average of 20 minutes is required to administrate
                                 these tools where we complete multiple-choice matrices. Three main forms of
                                 these matrices: Raven Standard Progressive Matrices, Raven Colored Matrices
                                 and Advanced Progressive Matrices.

                                 2.3. Right Hemisphere, Mathematics and Giftedness
                                 Both hemispheres of the brain (right/left) and their successful interaction play a
                                 crucial role in the complex process of mathematics [16]. For example, left he-
                                 misphere (LH) damage may result in difficulties with reading or writing num-
                                 bers and the performance of basic arithmetic operations while damage to the
                                 right hemisphere (RH) disrupts spatial representation [17] [18]. Several psy-

DOI: 10.4236/jilsa.2018.103006                             95   Journal of Intelligent Learning Systems and Applications
R. Ghali et al.
chophysiological studies support an important relationship between the specia-
lized capacities of the right hemisphere and mathematical abilities. These studies
indicated an enhanced processing reliance on the RH for the gifted studies [19].
Lui and colleagues [20] studied the relationship between electroencephalogram
(EEG) band power, cognitive processing and intelligence in school-aged child-
ren. 47 individuals from an experimental class (24 gifted, 23 average) were se-
lected and the main neural mechanism pertaining to high intelligence was inves-
tigated. The EEG was recorded and the relationship between different percen-
tages of power bands (Delta, Theta, Alpha 1, Alpha 2, Beta 1 and Beta 2) and in-
telligence and cognitive ability were analyzed. The results suggest that Delta
power activity of brighter individuals was more intensive than the one of normal
individuals, and Alpha 2 and Beta 1 power activity of higher intelligence indi-
viduals were less than of normal individuals.
3. A Description of NetMath Platform
NetMath Platform1 is a web application to support learning mathematics for
primary and secondary students (from 3rd primary grade to 4th secondary
grade). It contains a set of tasks and exercises in different topics of Math such
probability, statistic, decimal numbers, fractions, etc. In our case, we focus on
evaluating the topic of decimal numbers for 4th and 5th grade primary students.
We are mainly interested in performing the four basic operations on decimal
numbers (addition, subtraction, multiplication and division).
In order to evaluate students’ performance and EEG traits in NetMath plat-
form, we choose a total of 10 tasks from NetMath platform designed to 6th grade
students. These tasks are divided into three levels of difficulty: easy, medium and
hard as described below.
3.1. Easy Tasks
In these tasks, the student is asked to do one or two operations on decimals
(adding or subtracting two numbers). An example of this task is presented in
Figure 1.
3.2. Medium Tasks
In these tasks, the operations are presented in problems that are more compli-
cated and where the student has to do more than one operation at same time.
Therefore, we think that he has to be more careful in order to succeed in these
tasks. Figure 2 shows an illustration of these tasks.
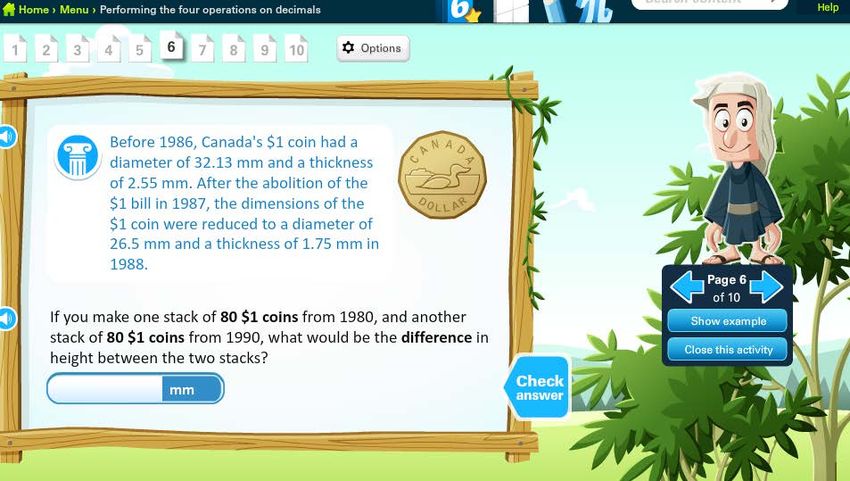
3.3. Hard Tasks
Two difficult problems are presented to the students. The problems required a
greater mental effort and the students have to think carefully in order to resolve
these problems. Figure 3 illustrates the problem of calculating the difference
1
https://www.netmath.ca/fr-qc/
DOI: 10.4236/jilsa.2018.103006 96 Journal of Intelligent Learning Systems and Applications
R. Ghali et al.

                                  Figure 1. An example of an easy task extracted from NetMath platform.

                                 Figure 2. A task of a medium difficulty.

                                 Figure 3. Example of a hard problem.

DOI: 10.4236/jilsa.2018.103006                   97         Journal of Intelligent Learning Systems and Applications
R. Ghali et al.

                                 of the one-dollar money dimensions. It requires two multiplications and one
                                 subtraction.

                                 4. Experiment
                                 In order to detect bright and gifted students, we conducted an experiment where
                                 we asked elementary school students (4th and 5th grades) to resolve the selected
                                 tasks from NetMath environment described above. The proposed tasks were de-
                                 signed for higher-level students (6th grade). A consent form preceded the expe-
                                 riment where we obtained the agreement of each parent to let his/her child to
                                 participate in our study. The experiment was held at École Samuel de Champlain
                                 (Brossard, Canada) after the classes. 17 students (10 F, 7 M) voluntarily partici-
                                 pated in this study with a compensation of 20$ each. Students are aged between
                                 9 and 11 year (M = 10.05; SD = 0.42). We invite two children at the same time to
                                 do the experiment as we have two laptops and two EEG headsets.
                                   We start the experiment by filling a short questionnaire about demographic
                                 data for each student (age, sex and math average obtained during the first step in
                                 school). Furthermore, we invite the student in login to the NetMath website and
                                 in completing the proposed tasks in ascending order (from easy to difficult).
                                 During the fulfilment of the tasks, we collect data from Neeuro Senzeband
                                 non-invasive EEG headset. This headset allows us to obtain EEG raw data from 4
                                 channels and three mental states measures (Attention, Workload and Relaxa-
                                 tion). This headset is heavy, easy to install and more suitable for use and expe-
                                 rimentation with children. It collects EEG data from four sensors (two right and
                                 two left frontal lobes). Neeuro provides only an SDK for mobile phones. In order
                                 to save the EEG data in the student’s computer, we started by creating a mobile
                                 application that is connected to the EEG headset through Bluetooth. This appli-
                                 cation collects in real time the EEG data, then, it sends them to the computer via
                                 Wi-Fi and the computer saves them to a CSV file. Figure 4 illustrates the EEG
                                 data acquisition process.

                                                Figure 4. EEG acquisition process.

DOI: 10.4236/jilsa.2018.103006                        98        Journal of Intelligent Learning Systems and Applications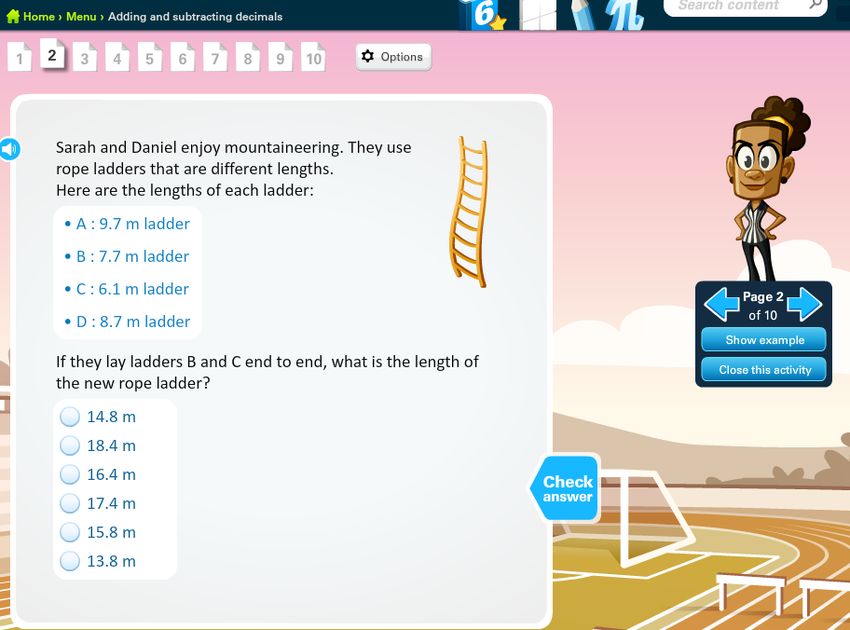
R. Ghali et al.

                                 5. Results
                                 In this part, we present the results obtained in NetMath platform for the 10 se-
                                 lected exercises. This part is divided in three subparts. The first part compares
                                 the performances obtained in these tasks and the initial averages in mathematics.
                                 This comparison lets us to obtain an indication of the strongest students
                                 (bright). The second part asks the question of the influence of age on perfor-
                                 mance. Finally, the third part studies the distribution of mental states according
                                 to the performance.

                                 5.1. Performance and Initial Average
                                 In order to detect the strongest students, we calculated for each student the ob-
                                 tained average (from 0% to 100%) in all the tasks extracted from NetMath plat-
                                 form. The average performance in this environment is 59.64%. However, the
                                 obtained group average in math in the first step class is 78% which is a little bit
                                 higher, due to the difficulty of the given tasks (tasks are designed for high level
                                 students). Thus, we can distinguish two groups: Group 1 with an average higher
                                 than the obtained group average in the first step or in NetMath platform and
                                 Group 2 with a lower average. Table 1 presents the distribution of students ac-
                                 cording to the math first step and to our experiment (NetMath platform). We
                                 show statistics according to the total student’s number, the mean, the standard
                                 deviation, the minimum and the maximum values.
                                    From Table 1, we can see clearly that the performance in our experiment is
                                 lower than the initial performance (first step score) for all students. This result is
                                 very expected as the proposed tasks aims to detect the strongest students. We
                                 can also observe that the highest obtained performance is 90.9% comparing to
                                 an initial first step score of 97%. However, there is no difference between the
                                 students’ distribution in the first step and the experiment (11 participants with a
                                 higher performance in the first step comparing to 10 participants with a higher
                                 performance in the NetMath platform). We also run an independent samples
                                 t-test to compare scores variation in both conditions (before and in the experi-
                                 ment). There was a significant difference in the scores (t(23) = 2.84; p = 0.004 <
                                 1%). This result supports the fact that there is a significant difference between
                                 the initial scores (obtained in the first step) and the experiment scores (obtained
                                 in NetMath platform). To confirm this result, we studied also the distribution of
                                 scores according the task difficulty. As we will describe further, our proposed
                                 tasks are divided to three levels of difficulty (easy, medium and hard). Figure 5

                                 Table 1. Distribution of student’s scores in the first step and in NetMath platform.

                                                               First Step                            NetMath
                                   Performance
                                                 N     Moy        SD        Min   Max   N    Moy       SD      Min      Max

                                     Group 1     11    88.63      6.19      81    97    10   76.71   11.34     68.18    90.9

                                     Group 2      6    68.66      8.01      57    73    7    35.25    20.41     10      57.14

                                      Total      17    81.72     11.57      57    97    17   59.64    25.9      10      90.9

DOI: 10.4236/jilsa.2018.103006                          99           Journal of Intelligent Learning Systems and Applications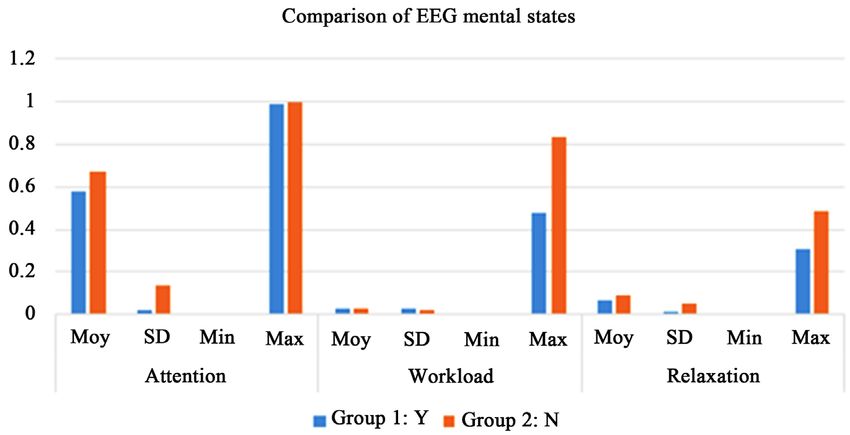
R. Ghali et al.

                                 Figure 5. Distribution of student’s scores according to the difficulty in our experiment.

                                 presents this distribution. We can deduce that almost all students succeeded in
                                 resolving easy tasks (53.75 out of 64: 83.89%), more than half students accom-
                                 plished medium tasks, and a very few number of students (only 2) success to
                                 solve hard tasks. So, we suspect that these students are very good at school.
                                 There is a large probability that they are gifted students. This finding will be
                                 studied and proved in our next work.

                                 5.2. Performance and Age
                                 In this part, we studied the influence of age on performance. We remember that
                                 our sample of students is composed of 3 ages (9, 10 and 11 years old). Table 2
                                 shows the distribution of student’s scores obtained in our experiment according
                                 to these three ranges of age.
                                   From Table 2, we can see clearly that the age has not an influence on scores.
                                 For instance, a 9 year old student succeeds to obtain a score of 68.18% which is
                                 higher than the average obtained in the experiment (59.64%) and higher than
                                 the average of 10 year old students (63.72%) and 11 year old (26.78%). Moreo-
                                 ver, two oldest students (11 year old) have poor performance comparing to all
                                 students. We can deduce therefore that the 9 year old student has a higher
                                 probability to be a gifted student.

                                 5.3. EEG Mental States Distribution and Performance
                                 This part discusses the variation of three mental states extracted from EEG sen-
                                 zeband according to student’s performance. As students could be classified into
                                 two group: Group 1 with the highest performance (>59.64%) and Group 2 with
                                 the lowest performance (
R. Ghali et al.
Figure 6. Variation of EEG mental states for bright students.
Figure 7. Variation of EEG mental states for weak students.
Table 2. Distribution of performance according to age.
Performance
Age
N Moy SD Min Max
9 1 68.18* 0 68.18 68.18
10 14 63.72* 25.2 10 90.9
11 2 26.78 2.52 25 28.57
* indicates that the average is higher than the student’s average in our experiment (59.64%).
Group 1 (bright students) have a stable attention value of 60% (see Figure 6)
and Group 2 have an instable value. It varies between 50% and 90%. So, we can
characterize bright students with an average value of attention and weak stu-
dents by fluctuated values of attention (very high or very low). To confirm this
finding, we dressed also a comparison curve which presents the variation of four
statistics (Moy, SD, Min and Max) extracted from these mental states for both
groups (see Figure 8).
DOI: 10.4236/jilsa.2018.103006 101 Journal of Intelligent Learning Systems and ApplicationsR. Ghali et al.
Figure 8. Variation of EEG mental states for bright and weak students.
Figure 8 confirms that Group 2 (weak students) have high values of attention
and relaxation comparing to Group 1 (bright students).
6. Conclusion and Future Works
In this paper, we described a study aiming to distinguish high ability math stu-
dents from average students. This study is based on the measure of the perfor-
mance, age, and EEG mental states of attention, workload and relaxation. Our
results show that bright and talented students succeed to answer top-level math
exercises with a performance of 90%. We can also characterize bright students
with an average value of attention (60%) and average students by fluctuated val-
ues of attention (very high or very low). Future work will focus on comparing
the results extracted from Raven Progressive Matrices and EEG raw data. We
will study tendencies in EEG variation for the right and left hemispheres and
power bands (Alpha, Beta, Theta and Delta).
Acknowledgements
This research was supported by the FRQNT (Fonds de Recherche du Québec en
Nature et Technologies) and Beam me up company. We thank also Mrs Chris-
tine Nadeau for welcoming us in her school (École Samuel de Champlain, Bros-
sard, Canada) and the professors of 4th and 5th grades.
Conflicts of Interest
The authors declare no conflicts of interest regarding the publication of this pa-
per.
References
[1] Zettel, J. (1997) State Provisions for Educating the Gifted and Talented. In: Passow,
A.H., Ed., The Gifted and The Talented: Their Education and Development, Uni-
versity of Chicago Press, Chicago, 63-74.
[2] Gigerenzer, G. (2007) Gut Feeling: The Intelligence of Unconsciousness. Penguin.
DOI: 10.4236/jilsa.2018.103006 102 Journal of Intelligent Learning Systems and ApplicationsR. Ghali et al.
[3] Torrance, E.P. (1965) Gifted Children in Classroom. MacMillan, New York,
[4] Feldhusen, J.F., Treffinger, D.J. and Elias, R.M. (1969) The Right Kind of Pro-
grammed Instructions for the Gifted and Talented. National Society for Pro-
grammed Instruction Journal, 8, 6-11.
[5] Wechsler, D. (1949) Wechsler Intelligence Scale for Children. Psychological Corpo-
ration, San Antonio, TX.
[6] Wechsler, D. (1999) Abbreviated Scale of Intelligence. The Psychological Corpora-
tion, San Antonio, TX.
[7] Raven, J.C. (1941) Standardization of Progressive Matrices, 1938. British Journal of
Medical Psychology, 19, 137-150.
https://doi.org/10.1111/j.2044-8341.1941.tb00316.x
[8] Marland, S.P. (1972) Education of the Gifted and Talented, Volume I—Report to
the Congress of the United States. Government Printing Office, Washington DC.
[9] Terman, L.M. (1925) Genetic Studies of Genius. Vol. 1. Mental and Physical Traits
of a Thousand Gifted Children. Stanford University Press, Stanford, CA.
[10] Renzulli, J.S. (1986) The Three-Ring Conception of Giftedness: A Developmental
Model for Creative Productivity. In: Sternberg, R.J. and Davidson, J.E., Eds., Con-
ceptions of Giftedness, Cambridge University Press, New York, 53-92.
[11] Sternberg, R.J. (2000) Handbook of Intelligence. Cambridge University Press, New
York. https://doi.org/10.1017/CBO9780511807947
[12] Sternberg, R.J., Jarvin, L. and Grigorenko, E.L. (2010) Explorations in Giftedness.
Cambridge University Press, New York.
https://doi.org/10.1017/CBO9780511778049
[13] Flanagan, D.P. and Alfonso, V.C. (2017) Essentials of WISC-V Assessment. John
Wiley & Sons, Hoboken.
[14] Vaivre-Douret, L. (2011) Developmental and Cognitive Characteristics of “High-Level
Potentialities” (Highly Gifted) Children. International Journal of Pediatrics, 2011,
Article ID: 420297. https://doi.org/10.1155/2011/420297
[15] Doucet, C. (2017) Douance. Dépister, comprendre et accompagner.
https://aqnp.ca/documentation/developpemental/douance/
[16] Dehaene, S., Dehaene-Lambertz, G. and Cohen, L. (1998) Abstract Representation
of Numbers in the Animal and Human Brain. Trends in Neuroscience, 21, 355-361.
https://doi.org/10.1016/S0166-2236(98)01263-6
[17] Benbow, C.P. (1988) Sex Differences in Mathematical Reasoning Ability in Intel-
lectually Talented Preadolescents. Brain and Behavioural Sciences, 11, 169-232.
https://doi.org/10.1017/S0140525X00049244
[18] Dehaene, S. (1997) The Number Sense. Oxford University Press, London.
[19] O’Boyle, M. (2005) Some Current Findings on Brain Characteristics of the Mathe-
matically Gifted Adolescent. International Education Journal, 6, 247-251.
[20] Lui, T., Shi, J., Zhao, D. and Yang, J. (2008) The Relationship between EEG Band
Power, Cognitive Processing and Intelligence in School Aged Children. Psychology
Science Quaterly, 50, 259-268.
DOI: 10.4236/jilsa.2018.103006 103 Journal of Intelligent Learning Systems and ApplicationsYou can also read


