COVID-19 countermeasures, sporting events, and the financial
←
→
Page content transcription
If your browser does not render page correctly, please read the page content below
The current issue and full text archive of this journal is available on Emerald Insight at:
                          https://www.emerald.com/insight/0307-4358.htm

    COVID-19 countermeasures,                                                                                                 Financial
                                                                                                                             impacts of
  sporting events, and the financial                                                                                         pandemics

        impacts to the North
          American leagues
                                      Justin Andrew Ehrlich                                                               Received 25 May 2020
                                                                                                                           Revised 11 June 2020
Department of Sports Management, Syracuse University, Syracuse, New York, USA                                             Accepted 18 June 2020
                                           Shankar Ghimire
            School of Accounting, Finance, Economics and Decision Sciences,
                   Western Illinois University, Macomb, Illinois, USA
                                          Maroula Khraiche
  Department of Economics and Finance, University of Texas Rio Grande Valley,
                         Edinburg, Texas, USA, and
                                         Mian Farrukh Raza
             Department of Economics, University of Wisconsin Whitewater,
                             Whitewater, Wisconsin, USA

Abstract
Purpose – The purpose of this paper is to analyze how the coronavirus disease 2019 (COVID-19)
countermeasures will affect the financing of the North American leagues. In particular, we focus on the missed
revenue from gate receipts for the Big Four leagues.
Design/methodology/approach – The authors forecast the 2020 revenue for each of the four major leagues
under two scenarios: (1) expected revenue under the normal conditions of fans in attendance and (2) expected
revenues in the absence of fans due to the countermeasures in place. Then, the authors calculate the loss in gate
receipts as a difference in the revenue under fans and no-fans scenarios.
Findings – Based on the current estimates, the combined financial loss of the clubs from NFL, MLB, NBA and
NHL is expected to be above 6.8bn dollars in gate receipts alone.
Practical implications – The findings are useful to the league management to prepare for the suboptimal
financial situation.
Originality/value – To the best of our knowledge, this is the first study that explores the effect of the COVID-19
pandemic across the major league sports leagues in North America.
Keywords Sports finance, North American league, League revenue, Financial impacts of pandemics, COVID-
19 and sports
Paper type Research paper

1. Introduction
During the past several months, the global pandemic of coronavirus disease 2019 (COVID-19)
has brought unprecedented countermeasures to every sector of the economy, including
individuals, groups, institutions and industries. The sports industry is no different. The week
of March 9, 2020 brought all sporting events to a halt. The National Basketball Association
(NBA) and National Hockey League (NHL) paused their seasons and Major League Baseball
(MLB) pushed back opening day. On March 12, the National Collegiate Athletic Association
(NCAA) canceled both men’s and women’s college basketball tournaments. The future of the
National Football League (NFL) is also uncertain. Right now, every single sports stadium in                                      Managerial Finance
North America is empty. This is affecting a multi-billion dollar sports industry to an                                  © Emerald Publishing Limited
                                                                                                                                           0307-4358
unprecedented level. The NFL, MLB, NBA and NHL make up the “Big Four” leagues in North                                  DOI 10.1108/MF-05-2020-0275
MF America in terms of their annual revenues. Although NBA and NHL have played certain
percentages of games for the season, MLB and NFL are yet to begin their season. Leagues
that will be unable to play most of their games will have an insurmountable impact.
While the current scenario affects the players and the fans more immediately, it may
leave a long-term financial impact to the clubs and the leagues. Estimates show that the
pandemic caused by COVID-19 has negatively affected the $160bn sports industry due to
missed games, broadcast revenue, gate revenues and salary obligations (Futterman et al.,
2020). The MLB can face major losses since it estimates that 40% of its revenues comes from
game time experience; therefore, negotiations are being conducted regarding salary cuts for
when the games are played without fans (Diamond, 2020). Other sports clubs are going to
experience similar financial adversity. While the bigger and more popular leagues may be
able to survive, the smaller and less popular sports and leagues are in serious financial
trouble. USA Rugby decided to file for Chapter 11 bankruptcy because its financial woes
have been exacerbated by the COVID-19 shutdown (ESPN, 2020). The cancellations of many
sports events due to the pandemic may cause financial strain for many more leagues
and clubs.
In this context, our objective in this paper is to analyze how the COVID-19
countermeasures will affect the financing of the North American leagues. In particular, we
focus on the missed revenue from gate receipts for the Big Four leagues. To do so, we forecast
the 2020 revenue for each of the four major leagues under two scenarios: (1) expected revenue
under the normal conditions of fans in attendance and (2) expected revenues in the absence of
fans due to the countermeasures in place. Then, we calculate the loss in gate receipts as a
difference in the revenue under fans and no-fans scenarios. To our knowledge, this is the first
study that explores the effect of the COVID-19 pandemic across the major sports leagues in
North America. This information is useful to the league management to prepare for the
suboptimal financial situation. In particular, the estimated financial effects based on
projected missed time and previous years’ revenues in this paper will help them formulate an
appropriate response that can alleviate the worst-case financial scenario as they accumulate
losses from lack of gate revenues, while still facing salary obligations and other expenses.
The remainder of the paper is organized as follows. Section 2 provides a review of the
literature pertaining to the effects of adverse shocks to the sports industry in the past. Section 3
presents a description of the data used in the analysis. Section 4 develops an estimation
technique and revenue forecasting. Section 5 presents the results. Section 6 discusses results of
the empirical test. Section 7 summarizes and concludes.
2. Literature review
In this section, we provide a description of past literature that analyzes the impact of external
shocks to the sporting industry. Although no shock in recent history parallels the current
suspension of all sporting events; a strategy implemented to halt the transmission of COVID-19,
we look at the literature of past lockdowns and strikes for clues about the size of revenue losses
incurred when games are canceled. Studies have found that interruptions such as strikes and
lockouts affect various aspects of sports including attendance, hotel occupancy rates, workers
productivity, salary, consumer demand and revenue (Iqbal, 2019; Bauman, 2018; Ge and Lopez,
2016; Birren, 2014; Baade et al., 2006; Lavoie and Rodriguez, 2005; Staudohar, 2013; Schmidt and
Berri, 2004).
One example of a long-term suspension of games is the NHL lockout of 1994. Owners of the
NHL wanted to implement a new collective agreement with a payroll tax that acted like a
salary cap. The players did not accept the payroll tax, which led to a lockout lasting for
103 days. The lockout ended on January 12, 1995 with owners winning minor concessions.
The NHL lost 442 games and billions of dollars in revenue (Miller and Schoepfer, 2017;Staudohar, 2006; Schmidt and Berri, 2004). A decade later, NHL owners announced a lockout Financial
for the 2004–2005 season on September 15, 2004. This lockout occurred due to another salary impacts of
cap dispute. The lockout remained for 310 days with the NHL missing 1,230 games. The
league lost around $2bn in revenue and $1bn in players’ salaries (Allen and Brehm, 2005;
pandemics
Staudohar, 2006; Treber et al., 2018). The NHL endured another lockout in 2012–2013. This
lockout occurred because the owner and players could not reach a consensus on how the
hockey-related revenue is distributed between them. With this lockout, 625 games were
canceled, and the league lost a billion dollars in revenue (Strang, 2013; Mirtle, 2010). After
both these recent lockouts, attendance was negatively affected, primarily for stronger
franchises (Horowitz, 2011).
Strikes in the MLB also occurred for similar reasons. In 1994, team owners wanted a new
collective bargaining agreement, introducing certain clauses including salary cap,
elimination of salary arbitration, etc. Players rejected the new proposal and went on strike
on August 12, 1994. This led to the cancelation of the remainder of the season, including the
1994 World Series. The strike continued for 232 days and canceled 948 games and $ 1bn in
revenue. For years after the strike, the MLB lost attendance for both weak and strong
franchises (Blair, 2019; Snyder, 2007; Agha, 2013; Winfree and Fort, 2008; Fuhr, 1999).
These types of negative financial shocks are not limited to baseball and hockey leagues.
The NBA also experienced lockouts such as the one beginning on July 1, 1998 because owners
and players could not reach a collective bargaining agreement. The lockout continued for
204 days, resulting in more than $1bn loss in revenue to the league and an estimated loss of
$500m in player salaries (Golianopoulos, 2019; Carpenter, 2013). In addition to that, the
average attendance, TV ratings and league popularity decreased following the end of strike
(Horowitz, 2011). The NFL has also experienced lockouts and strikes over the years, dating
back to 1968. The most recent lockout in the NFL began on March 12, 2011 and it primarily
occurred because of the dysfunctional relationship between the owners and the players. This
lockout continued for 136 days and avoided loss of 2011 games (Staudohar, 2012; Lewis and
Proffitt, 2013).
Besides league lockouts and strikes, past recessions have also affected the major leagues
financially. Parlow (2010) analyzes the effect of the Great Recession on the NBA. The NBA
expected to lose $400m in revenue in 2009–2010 season and many teams experienced
reduction in gate revenue, attendance and lost corporate support. While various sports
leagues have faced severe financial consequences in the past due to different shocks such as
strikes, lockouts and recessions, the financial effects of these shocks do not compare to the
current turmoil affecting each club and league in North America and across the globe.
Sports play an important role in the economy by creating employment and economic
activity, particularly in cities with multiple major teams, and therefore the pandemic’s effect
on the suspension of sporting events is important to estimate. The literature examining
professional sports’ impact on the economy is divided into ex ante and post ante. ex ante
economic analysis generally concludes that a new sports team or building a new stadium will
yield economic benefits to the city. These studies mostly are predictive in nature (Crompton,
1995; Rosentraub and Swindell, 1998). However, post ante analyses, using cross-sectional and
time series data collected from different areas, alongside cost benefit analysis in order to
examine the impact of sport events on economies, find mixed results (Rosentraub et al., 1994).
It is worth noting that the scale of the pandemic’s effect on all sports activities is unlike the
effect of a new stadium or a single sporting event, therefore, the financial and economic
consequences will be significant.
3. Data and methodology
To analyze the financial impact of the COVID-19 pandemic at the league level, we use the
financial data for the individual teams represented in the NBA, MLB, NHL and NFL obtainedMF from Forbes (2020). The dataset provides financial statistics such as the team value, debt,
revenue, operating income, player expenses, gate receipts, etc. To serve the purpose of this
paper, we use the information for two key variables: revenue and the gate receipts. This
dataset provides complete information for only the 2007–2018 periods. Therefore, we join this
data with another dataset from Statista (MLB Revenue by Team/Franchise, 2019, 2020; NBA
Teams Revenue Ranking, 2018/19, 2020; NFL Revenue by Team, 2019; NHL Teams Revenue,
2018/19, 2020), which provides revenue information for 2019. Below are summary statistics of
the data for the 2007–2019 seasons.
The data shows that the average revenue for the teams represented in the NFL, MLB, NBA
and NHL for the period 2007–2019 was about $317, $245, $167 and $122m, respectively. The
total revenue for the NFL is the largest, followed by MLB, NBA and NFL. These leagues are
the largest not only in North America but also across the globe in terms of the total revenue.
That is why their financial adversity is a major concern.
4. Estimation
The main objective of this paper is to estimate the expected revenue for each league – and
each team – under the COVID-19 circumstances. To estimate the revenue situation for the
individual leagues, our approach is to estimate the 2020 revenue based on the past revenue
data available up to 2019, as shown in Table 1. To do so, first we calculate the annual growth
rate of revenue for each team based on the past revenue data. We take the difference of the
natural log for each season’s revenue and the previous season’s revenue, which gives us the
growth rate of revenue.
Revenue Growthi;t ¼ lnðRevenuei;t Þ lnðRevenuei;t−1 Þ
where, i represents each team from NFL, MLB, NBA and NHL; and t 5 2007–2019. As such,
we get the growth rates of revenue for each team for the period 2008–2019. Using the growth
rates calculated above and the team revenues, we estimate the growth rate of revenue for each
year using the following linear regression.
Revenue Growthit ¼ αi þ α1 Revenueit−1 þ α2 Leaguei þ α3 Teamj þ α4 Seasont
þ α5 League*Seasonit þ α6 Team*Seasonjt þ εit
where, Revenue Growthit is the growth rate of revenue for team i, that belongs to league j, in
season t. This growth rate of revenue is modeled as a function of the team’s current and
previous season revenue. We also control for the league, team and season fixed effects as well
as the appropriate interaction terms that are likely to affect the growth rates of revenue.
This estimation gives us the predicted value of the growth rate for each team, which is
then used to estimate the expected revenue for the 2020 period as:
d i;2020 ¼ Revenei;2019 * 1 þ Revenue
Revenue dGrowthi;2019
League Mean Std. Min. Max.
MLB $244.51 $85.97 $124 $683
NBA $165.82 $68.41 $78 $472
Table 1. NFL $316.77 $103.32 $185 $950
Revenue for the 2007– NHL $122.22 $41.76 $61 $270
2019 period, by league Note(s): N 5 123 teams represented in the Big Four leagues. Revenue in 2020 US$ millionsThe revenue estimated in this way gives us the expected value of revenue for each team under Financial
the normal circumstances, i.e. without the COVID-19 implications. Each team’s total revenue impacts of
will be affected by factors such as missed time, broadcast revenues, gate revenues, etc. As
discussed earlier, we consider the gate receipts to be a major part of what the teams will lose in
pandemics
the new circumstances. To incorporate this, we calculate the average proportion of gate
receipts to the total revenue for the sample for the 2016–2018 season as follows [1].
P2018
Gate Receiptsit
Gate Receipts ProportionðGRPi Þ ¼ t¼2016 P2018
t¼2016 Revenueit
Then, we adjust the 2020 expected revenue by removing the average proportion of the gate
receipts. This gives us the expected revenue for each team in the absence of fans.
d i;2020
Expected Revenue Without Fansi;2020 ¼ ð1 GRPi ÞRevenue
The 2020 season has not yet started for either the MLB or the NFL. To calculate the 2020
season completed for both the NHL and NBA, we divide the games played by the number of
games in a season þ average playoff games per team. This meant each NBA team has 82
regular season games þ 160/30 playoff games. Each NHL team has 82 regular season
games þ 174/31 playoff games. However, playoff games are worth more in revenue to a team
than a regular season game. Gate receipts for postseason games are about 1.666 times that of
regular season games for the NBA (Helin, 2020). We could not locate the difference between
NHL post season gate receipts and regular season gate receipts, so we used the NBA
estimated ratio. Therefore, our predicted 2020 revenue, without fans, is based upon the
following equation:
d i;2020 *Season Completedi;2020
Expected Net Revenuei;2020 ¼ Revenue
þ Expected Revenue Without Fansi;2020
* 1 Season Completedi;2020
From here, we calculate the expected revenue loss for each team as:
d i;2020 Expected Net Revenuei;2020
Expected Revenue Lossi;2020 ¼ Revenue
5. Results
This section provides a summary of the results for the Big Four leagues estimated for the 2020
season. We focus on the two estimates: (1) expected revenue at the league level under the
normal circumstances (i.e. no COVID-19, with fans) and (2) expected revenue at the league level
under the COVID-19 circumstances (i.e. without the fans). We present these results in Table 2.
League revenue League revenue League League revenue Average
League with fans without fans revenue loss percent loss team loss
MLB $10,796.58 $7,578.54 $3,218.04 29.81% $107.27
NBA $9,525.17 $8,862.41 $662.77 6.96% $22.09
NFL $15,185.26 $12,720.68 $2,464.58 16.23% $77.02
NHL $5,284.47 $4,824.38 $460.09 8.71% $14.84
Average $10,197.87 $8,496.50 $1,701.37 15.43% $55.33 Table 2.
Total $40,791.48 $33,986.00 $6,805.48 $6,805.48 Predicted revenue loss
Note(s): N 5 123 teams. Revenue in 2020 US$ millions for the 2020 seasonMF
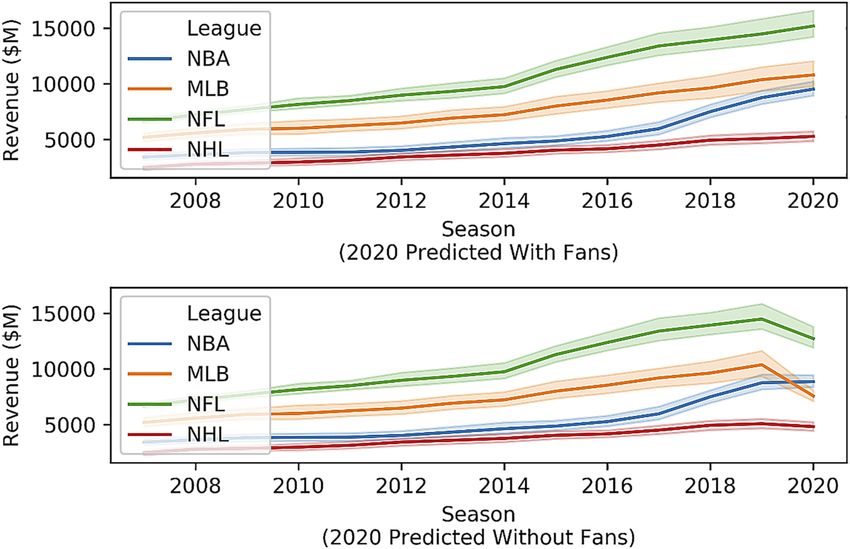
Figure 1.
Projected League
Revenue with and
without fans for the
2020 Season
The results show that the expected gate receipts without the COVID-19 pandemic would have
been above $40.79bn across the four leagues, but the new estimates without the fans is
going to be only about $33.98bn. That is a loss of $6.8bn across the four leagues: $3.22bn
for MLB, $0.66bn for NBA, $2.46bn for NFL and $0.46bn for NHL. In terms of percent
change, MLB is predicted to incur the most losses (29.81%), followed by NFL (16.23%),
NHL (8.71%) and NBA(6.96%). On average, each team in the MLB, NBA, NFL and NHL is
predicted to lose $107.27, $22.09, $77.02 and $14.84m, respectively. Figure 1 shows the
visualization of the predicted revenue for each league with fans (top panel) and without
fans (bottom panel).
6. Discussion
Based on the current estimates, the combined financial loss of the clubs from NFL, MLB, NBA
and NHL is expected to be above 6.8bn dollars in gate receipts alone. The weaker league
financing is going to disrupt the athletes, coaches and clubs. The near-future plans for the
leagues are not yet certain. No one knows how the whole season is going to be affected, but
these clubs and the leagues will suffer a financial fallout due to the changes brought on by the
COVID-19 pandemic. Although NBA and NHL have played certain numbers of games, MLB
and NFL are yet to begin their season. Those leagues that will be unable to play most of their
games or play with no fans, will experience major losses. In particular, the estimates show the
MLB to fare worse than the NFL because the MLB gate receipt revenue percentage is far
greater than the NFL. While our estimates include only gate receipts, the teams also need to
consider other sources of stadium revenue that is being lost, such as parking, food and drinks,
merchandise sales, etc. With the reduced revenue, the teams need to have a management plan
not only for the directly affected athletes, coaches and officials but also for stadium staff
members and vendors. This pandemic is going to cost much more than what we have
predicted here based on the gate receipts alone. The leagues should take immediate actions to
mitigate the worst-case financial scenario for the individual teams by making specific plans
regarding issues such as missed time, broadcast revenues, gate revenues and salary
obligations.It would be ideal to include all sources of revenue to forecast the 2020 losses. However, in Financial
the absence of complete data, we can include only the gate receipts to estimate the reduction in impacts of
revenue. While using total stadium revenue, which includes concessions, parking and
merchandise, leads to a better estimator of reduced revenue, the data for total stadium
pandemics
revenue is unavailable. However, unlike gate receipts, any loss of revenue from concessions
and merchandise can be mitigated by reducing inventory during the fan-less season. Another
source of financing for the leagues is the TV revenue, but it is hard to estimate the impact on
this source because many MLB owners have partial ownership in regional sports networks
(RSNs) and the owners can funnel dividends to the team without having to report it to the
league. However, it is likely that the TV viewership will increase as people will watch sports
during any imposed stay-at-home orders or because they are fearful of leaving home. So, we
do not anticipate a reduction in TV revenues. Even if there are no games, subscriber fees
make up around 90% of RSNs, which gets packaged with the rest of cable bundles.
7. Conclusions
As the World Health Organization declared the COVID-19 outbreak a pandemic in March of
2020, the NBA and the NHL suspended their seasons, the NCAA canceled its championships,
and many other leagues and sporting events, including all MLB play, are postponed for
months. The NFL plans are not yet certain. In that context, we estimate the potential revenue
fallout for the Big Four leagues in North America. One of the major sources of revenues that
the leagues will certainly lose as the virus continues to spread is the gate receipts. Therefore,
we estimate the industry level loss under such circumstances to be over 6.8bn dollars,
assuming that the leagues will not collect any gate receipts for the remainder of the season.
Future research should include all sources of revenue that can be lost due to restrictions set in
place to curb infections in order to estimate the exact amount of loss.
Note
1. We do so because we do not have the 2019 gate receipts information for each team. These data are
available only for the MLB. But, the average proportion for each team for the 2016–2018 period gives
us a pretty good picture of what would happen to their gate receipts in 2019.
References
Agha, N. (2013), “The economic impact of stadiums and teams: the case of minor league baseball”,
Journal of Sports Economics, Vol. 14 No. 3, pp. 227-252.
Allen, K. and Brehm, M. (2005), “Black ice: NHL season cancelled”, USA Today, available at: http://
www.usatoday.com/sports/hockey/nhl/2005-02-16-seasoncancelx.htm.
Baade, R., Baumann, R. and Matheson, V. (2006), “The economic consequences of professional sports
strikes and lockouts: revisited”, Working Paper No. 06-04, College of the Holy Cross.
Baumann, A. (2012), “Play ball: what can be done to prevent strikes and lockouts in professional
sports and keep the stadium lights on”, Journal of the National Association of Administrative
Law Judiciary, Vol. 32, p. 251.
Birren, G.F. (2014), “A brief history of sports labor stoppages: the issues, the labor stoppages and their
effectiveness (or lack thereof)”, DePaul Journal of Sports Law and Contemporary Problems,
Vol. 10, p. 1.
Blair, J. (2019), “How the MLBPA won the battle behind the 1994 players’ strike”, Sportsnet.ca,
available at: https://www.sportsnet.ca/baseball/mlb/brutal-lessons-94-loom-mlb-new-labour-
clouds-gather/.MF Carpenter, K. (2013), “NFL and NBA lockouts: a UK lawyer’s legal retrospective”, The Sports Lawyers
Journal, Vol. 20, p. 1.
Crompton, J.L. (1995), “Economic impact analysis of sports facilities and events: eleven sources of
misapplication”, Journal of Sport Management, Vol. 9 No. 1, pp. 14-35.
Diamond, J. (2020), “Why money, not safety, could derail baseball in 2020”, The Wall Street Journal,
available at: https://www.wsj.com/articles/why-money-not-safety-could-derail-baseball-in-2020-
11589298571?shareToken5stbe8c2fcb698f4fe48c238fdff7bba50a.
ESPN (2020), “USA Rugby to file for bankruptcy amid coronavirus shutdown”, available at: https://
www.espn.com/olympics/story/_/id/28973310/usa-rugby-file-bankruptcy-amid-coronavirus-
shutdown.
Forbes (2020), “Forbes NBA, MLB, NFL, and NHL team valuations”, available at: Forbes.com.
Fuhr, J.P. (1999), “Stee-rikefour! What’s wrong with the business of baseball?”, in Daniel, R. (Ed.),
Marburger Praeger Press, 1997, 218, Atlantic Economic Journal, Vol. 27, pp. 221-231.
Futterman, M., Draper, K., Belson, K. and Blinder, A (2020), “The financial blow of the coronavirus on
sports”, The New York Times, available at: https://www.nytimes.com/2020/03/14/sports/sports-
coronavirus-impact.html.
Ge, Q. and Lopez, M.J. (2016), “Lockouts and player productivity: evidence from the national hockey
league”, Journal of Sports Economics, Vol. 17 No. 5, pp. 427-452.
Golianopolous, T. (2019), “An unmitigated disaster: an oral history of lockout- Shortened NBA 1999
Season”, TheRinger.com, available at: https://www.theringer.com/nba/2019/2/19/18228706/
lockout-1999-season-san-antonio-spurs-new-york-knicks.
Helin, K. (2020), “If NBA season is cancelled how much ticket revenue is the NBA out? Roughly
$500 million”, March 14, available at: https://nba.nbcsports.com/2020/03/14/nba-season-is-
cancelled-nba-out-roughly-500-million/.
Horowitz, D. (2011), “The effect of strikes and lockouts on the strength of professional sports leagues”,
(Doctoral Dissertation), The Ohio State University.
Iqbal, M. (2019), “Labor lockouts in the NBA and their effects on large and small market team
attendance and revenue”.
Lavoie, M. and Rodriguez, G. (2005), “The economic impact of professional teams on monthly hotel
occupancy rates of Canadian cities: a Box-Jenkins approach”, Journal of Sports Economics,
Vol. 6 No. 3, pp. 314-324.
Lewis, J. and Proffitt, J.M. (2013), “Sports, labor and the media: an examination of media coverage of
the 2011 NFL lockout”, Labor Studies Journal, Vol. 38 No. 4, pp. 300-320.
Miller, J.J. and Schoepfer, K. (2017), Legal Aspects of Sports, Jones & Bartlett Learning, Burlington, MA.
Mirtle, J. (2010), “NHL attendance dips by 2.5 percent”, The Globe and Mail, 15 June, available at: www.
theglobeandmail.com/sports/hockey/globe-on-hockey/nhl-attendance-dips-by-25-per-cent/article
1605083/.
MLB Revenue by Team/Franchise 2019 (2020), “Statista”, available at: https://www.statista.com/
statistics/193645/revenue-of-major-league-baseball-teams-in-2010/.
NBA Teams Revenue Ranking 2018/19 (2020), “Statista”, available at: https://www.statista.com/
statistics/193704/revenue-of-national-basketball-association-teams-in-2010/.
NFL Revenue by Team (2019), “Statista”, available at: https://www.statista.com/statistics/193553/
revenue-of-national-football-league-teams-in-2010/.
NHL Teams Revenue 2018/19 (2020), “Statista”, available at: https://www.statista.com/statistics/
193736/revenue-of-national-hockey-league-teams-in-2010/.
Parlow, M.J. (2010), “The NBA and the great recession: implications for the upcoming collective
bargaining agreement renegotiation”, DePaul Journal of Sports and Contemporary Problems,
Vol. 6 No. 2, pp. 10-29.Rosentraub, M. and Swindell, D. (1998), “Who benefits from the presence of professional sports teams? Financial
the implications for public funding of stadiums and arenas”, Public Administration Review,
Vol. 58 No. 1, pp. 11-20. impacts of
Rosentraub, M.S., Swindell, D., Przybylski, M. and Mullins, D.R. (1994), “Sport and downtown
pandemics
development strategy if you build it, will jobs come?”, Journal of Urban Affairs, Vol. 16 No. 3,
pp. 221-239.
Schmidt, M.B. and Berri, D.J. (2004), “The impact of labor strikes on consumer demand: an application
to professional sports”, The American Economic Review, Vol. 94 No. 1, pp. 344-357.
Snyder, B. (2007), A Well-Paid Slave: Curt Flood’s Fight for Free Agency in Professional Sports,
Penguin, New York, NY.
Staudohar, P.D. (2006), “So you want to be a sports agent”, Labor Law Journal, Vol. 57 No. 4, p. 246.
Staudohar, P.D. (2012), “I and labor mobility”, The Oxford Handbook of Sports Economics, The
Economics of Sports, Vol. 11, p. 97.
Staudohar, P.D. (2013), “The hockey lockout of 2012-2013”, Monthly Labor Review, Vol. 136, p. 1.
Strang, K. (2013), “NHL, union have tentative agreement”, ESPN. com, available at: https://www.espn.
com/nhl/story/_/id/8817955/nhl-nhlpa-reach-tentative-agreement.
Treber, J., Mulcahy, L. and Sharma, M.B. (2018), “Empty seats or empty threats? Examining the
effects of the 1994-1995 and 2004-2005 lockouts on attendance and revenue in the national
hockey league”, Journal of Sports Economics, Vol. 19 No. 5, pp. 677-695.
Winfree, J.A. and Fort, R. (2008), “Fan substitution and the 2004-05 NHL lockout”, Journal of Sports
Economics, Vol. 9 No. 4, pp. 425-434.
Further reading
Berri, D.J., Schmidt, M.B. and Brook, S.L. (2004), “Stars at the gate: the impact of star power on NBA
gate revenues”, Journal of Sports Economics, Vol. 5 No. 1, pp. 33-50.
Rosentraub, M.S. (2009), Major League Winners: Using Sports and Cultural Centers as Tools for
Economic Development, CRC Press, Boca Raton, FL.
Corresponding author
Shankar Ghimire can be contacted at: sp-ghimire@wiu.edu
For instructions on how to order reprints of this article, please visit our website:
www.emeraldgrouppublishing.com/licensing/reprints.htm
Or contact us for further details: permissions@emeraldinsight.comYou can also read