Investor Presentation - Half year to 30 June 2018 - September 2018 www.regionalreit.com - Regional ...
←
→
Page content transcription
If your browser does not render page correctly, please read the page content below
Investor Presentation – Half year to 30 June 2018
    September 2018

  High dividend distribution UK REIT, offering exposure to the regional commercial property market with active management by an experienced
                                                                 Asset Manager

www.regionalreit.com
Introduction

                                         Stephen Inglis
                                      Chief Executive Officer

                                  London and Scottish Investments, Asset

  • Introduction                       Manager to Regional REIT

  • Financials and Portfolio           Derek McDonald
                                         Managing Director

  • Market Overview and Outlook   London and Scottish Investments, Asset
                                       Manager to Regional REIT

                                        Simon Marriott
                                        Investment Director
                                  London and Scottish Investments, Asset
                                       Manager to Regional REIT

                                                                           2
Highlights – Financial

     •   EPRA NAV – diluted £426.5m(+8%), asset management initiatives delivering, revaluation increases of £27.9m and disposal gains of £7.2m

     •   EPRA NAV – diluted 113.6pps (+7.7pps)

     •   LTV 41.2% (reduced by 380bps),          proactive and disciplined approach to capital management

     •   Total Accounting Return since IPO 32%, annualised 11%,               in line with target to deliver 10%+

     •   Dividend declared for H1 2018 3.70pps (H1 2017: 3.60pps) (+3%), dividend continues to grow
          o    Board committed to a FY 2018 dividend of 8.05pps

          Post 30 June 2018

         £50m Retail Eligible Bond admitted 6 August to trading on London Stock Exchange

                                                                    Tay House, Glasgow

                                                                                                                                                 3
Highlights – Property

   •      Sold 20 properties for £60.4m* (after costs) at a weighted average net initial yield of c.4.9%   Arena Point, Leeds

   •      Bought 7 properties for £40.1m (before costs) with a weighted average net yield of c.8.4%

   •      Property portfolio £758.7m increase of £21.4m from 31 Dec 17

   •      Occupancy by value increased to 85.5% from 85.0% as at 31 Dec 17

   •      Capital rate per sq. ft.                Office: £129.86 per sq. ft.
                                                  Industrial: £42.75 per sq. ft.

   •      Scotland exposure reduced to 21.9% from 22.4% as at 31 Dec 17

         Post 30 June 2018

         Sale - Arena Point, Leeds £12.2m development site (30 June 18 valuation £3.9m)
         Sale - Wardpark, Cumbernauld £26.4m multi-let industrial (+21.1% over 31 Dec 17 valuation,
         +7.6% over 30 June 18 valuation)
         Sale – Turnford Place, Cheshunt , £17.25m office (+20.6% over 31 Dec 17 valuation, +6.2% over
         30 June 18 valuation)
         Acquisition £31.4m office regional portfolio, reflecting a net initial yield of 8.7%
         Sales reduce Scotland exposure further to c.18% of portfolio

*Figure includes 4 part property sales
                                                                                                                                4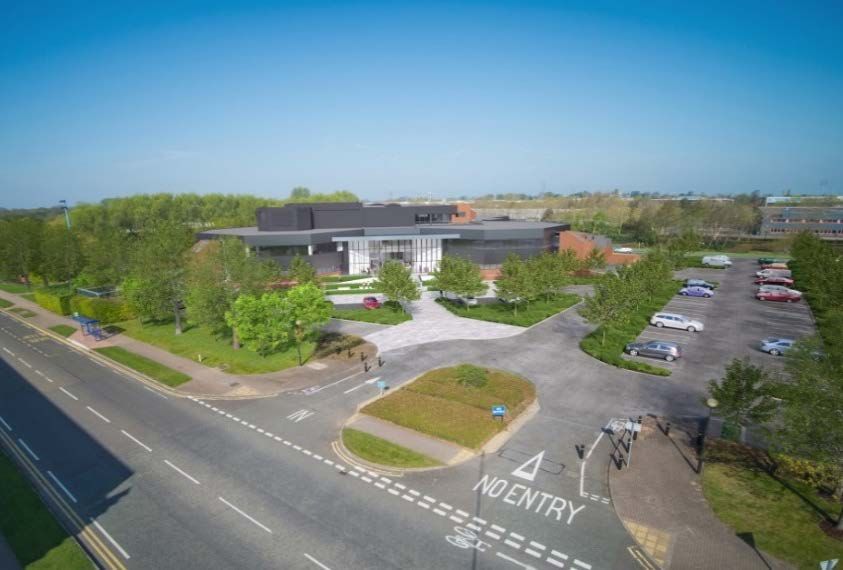
Financials and Portfolio

                           5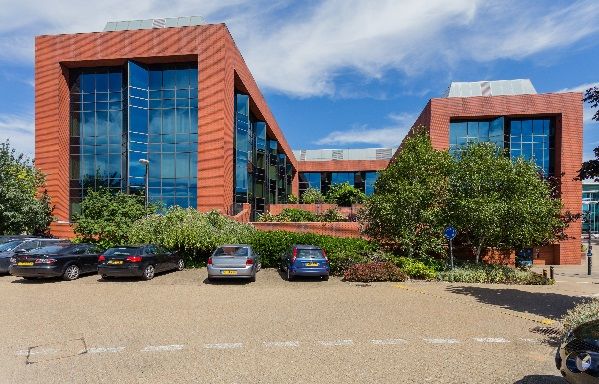
Delivering on our Strategy
                                                                                                                 Dec 2017       June 2018   Change*
                    Portfolio change -                                           Investment Property             £737.3m        £758.7m     +£21.4m
               targeted and opportunistic
                                                                                 Acquisitions before costs       £228.1m        £40.1m      +£188.0m
            acquisitions; disposals when asset
            management initiatives achieved                                      Acquisition Net Initial Yield   7.9%           8.4%        +50bps

                                                                                 Disposals net                   £16.9m         £60.4m      +£43.5m

                                                                                 Disposal Net Initial Yield      6.3%           4.9%        (140 bps)
                    Portfolio exposure -
               continued reduced exposure to
                                                                                 Office and Industrial           90.6%          91.3%       +70bps
                     Scotland by value
                                                                                 Scotland**                      22.4%          21.9%       (50bps)

                                                                                 Weighted Average Cost of        3.8%           3.8%          0bps
                        Debt -                                                   Debt
          proactive and disciplined approach                                     Weighted Average Duration       6.0yr          5.4yr       (0.6yrs)

                                                                                 Total Accounting Return         19.9%          32.0%       +1210bps
                                                                                 since IPO***
                         Return -
              continued strong returns with a                                    Total Annual Accounting         8.8%           11.0%       +220bps
                                                                                 Return
                progressive dividend policy
                                                                                 Dividends declared              3.6pps         3.7pps      +0.1pps
                                                                                 (2017: 7.85pps)                 (30 June 17)

*Rounded to whole numbers
** Exposure to Scotland continues to be reduced with a long-term target of 15%
***IPO 6 November 2015 - NAV plus dividend                                                                                                              6
Diversified office-led portfolio focussed on the UK regions
   Property - £758.7m gross investment properties
               Gross property assets by value (%)*                                WAULT to first break (years) & Voids (%)                                             Valuation yields (%)*
  100%                                                                                                                                         10%
                                                                              4                                                        86%
                                                                                                                                                                9.2%                9.2%              9.0%
    90%                                                                                  3.5                3.5            3.5                 9%
                                                                              4                                                        86%
    80%                              23.3%              21.0%
                                                                                                                          85.5%                8%
                  26.0%
    70%                                                                       3                                                        85%
                                                                                                                                               7%        6.7%              6.5%
                                                                                                            85.0%                                                                              6.4%
    60%                                                                       3                                                        85%     6%
    50%
                                                                              2                                                        84%     5%
    40%
                                                                                                                                               4%
                                     67.3%              70.3%                 2                                                        84%
    30%           62.8%
                                                                                                                                               3%
                                                                              1         83.3%                                          83%
    20%
                                                                                                                                               2%
    10%                                                                       1                                                        83%
                                                                                                                                               1%
     0%
                                                                              0                                                        82%     0%
                30-Jun-17         31-Dec-17           30-Jun-18
                                                                                      30-Jun-17         31-Dec-17      30-Jun-18                         30-Jun-17             31-Dec-17       30-Jun-18

                            Office     Industrial                                     Years to first break (lhs)    Occupancy by value (rhs)                     Net Initial       Reversionary
           •       7.4% - Retail                                                  •    5.3 years WAULT to lease expiry                               •     Equivalent: 8.3%
                 (30 Jun’17, 9.7%; 31 Dec’17, 8.1%)                                   (30 Jun’17, 5.3; 31 Dec’17, 5.4)                                    (30 Jun’17, 8.3%; 31 Dec’17, 8.3%)
           •       1.3% - Other
                 (30 Jun’17, 1.5%; 31 Dec’17, 1.3%)
           •       Contracted rent roll – c. £61.3m
                  (30 Jun’17, £54.6m; 31 Dec’17, £61.9m)

*Figures based on Cushman & Wakefield and JLL valuations as at 30 June 2018
                                                                                                                                                                                                             7
£758.7m Property Portfolio as at 30 June 2018
                                                                  SECTOR SPLIT (% by value)
                IPO – November 2015                                           31 December 2017                                         30 June 2018
                                     5.0%                                                       1.3%                              7.4%                1.3%
        11.3%                                                          8.1%

                           £386.1m                                                   £737.7m                                                £758.7m
                                                              23.3%                                                   21.0%
   25.3%

                                                    58.4%                                                  67.3%                                                 70.3%

             Office     Industrial      Retail    Other                Office      Industrial   Retail   Other                Office     Industrial   Retail     Other

                                                                REGIONAL SPLIT (% by value)
                           3.9%                                                     3.6%                                                   2.8%
            8.2%                                                                                                              8.4%
                                                                       7.8%                                27.0%                                                         28.7%
                                                    12.7%
      9.5%                                                     11.2%                                                    11.1%

                            £386.1m                                                   £737.7m                                                 £758.7m
   13.3%                                                       13.0%                                                  11.6%

                                                    35.4%                                                22.4%                                                      21.9%
                                                                         15.2%                                                15.5%
              17.0%
                                                                                                                         South East         Scotland           Midlands
              South East       Scotland          Midlands             South East         Scotland        Midlands        North East         North West         South West
              North East       North West        South West           North East         North West      South West
                                                                                                                         Wales
                                                                      Wales
              Wales

Charts may not sum due to rounding
                                                                                                                                                                                 8
Highly Diversified Actively Managed Portfolio
     Tenant Profile                                                                                                                            Wholesale and retail trade
                                                                   TENANTS BY SIC CODES, as a % of gross rent
     • Large mix of tenants across a variety of                                                                                                Professional, scientific and
       sectors offers income diversification                                        12.4%
                                                                                   (14.2%)                         12.7%
                                                                                                                                               technical activities
       and security of lease renewals.                                                                            (13.8%)                      Manufacturing
                                                                         2.9%
     • No tenant represents more than 2.7% of                           (2.9%)                                                                 Information and
                                                                                                                                               communication
       the Group’s contracted rent roll as at 30                 3.5%                                                            9.8%
                                                                                                                                (10.6%)
                                                                (3.5%)                                                                         Administrative and support
       June 2018                                                                                                                               service activities
                                                                3.9%
                                                               (3.5%)                                                                          Public Sector
     • Top 15 tenants represent only 23.9% of                                                 Contracted
       the Group’s contracted rent roll.                        4.5%
                                                                                             rental income                                     Financial and insurance
                                                                                                                                               activities (Other)
                                                               (4.6%)                            £61.3m
                                                                                                                                               Banking

                                                                 6.3%                                                                 9.3%     Construction
    IPO- November 2015                          30 June 2018    (4.4%)                                                               (9.2%)

                                                                                                                                               Transportation and storage
                                                                                                                             9.1%
             517 Tenants                        950 Tenants                8.4%                                             (8.0%)
                                                                          (7.6%)                                                               Education

                                                                                         8.5%                 8.7%
               713 Units                        1,294 Units                             (8.9%)               (8.7%)                            Electricity, gas, steam and
                                                                                                                                               air conditioning supply
                                                                                                                                               Other

                                                                                                                                          Charts may not sum due to rounding

Data in brackets relates to 31 Dec 17 figures
                                                                                                                                                                         9
Stable Rental Income

                                                                        Half year ending 30 June 2017       Half year ending 30 June 2018                  Change*

   Rental income                                                                    £23.0m                              £30.6m                              +£7.6m
   EPRA cost ratio                                                                   37.7%                               41.8%                             +410bps
   Adj. EPRA costs ratio (excl. Performance Fee)                                     33.7%                               28.1%                             (560bps)
   Operating profit before gains/losses on property assets/other                    £14.3m                              £17.6m                              +£3.3m
   investments
   EPS (fully diluted)                                                              5.6pps                              12.0pps                             +6.4pps
   EPRA EPS (fully diluted)                                                         2.9pps                              2.6pps                             (0.3pps)

   EPRA EPS (excl. Performance Fee)                                                 3.2pps                              3.8pps                              +0.6pps
   Dividend declared for the period                                                 3.6pps                              3.7pps                              +0.1pps

          •     Rental income stable for the six months to 30 Jun 2018. Rent roll at the 30 Jun 2018 on full occupation £73.4m pa. (30 Jun 2017: £65.1m pa; 31 Dec 2017:
                £73.8). Second half 2018 rental income is likely to be impacted by property sales and the timing of capital deployment.

          •     EPRA cost ratio 30 Jun 2018 impacted predominately by the property disposals and gain on revaluations in the period, resulting in an increased performance
                fee. Excl. performance fee operating efficiencies are being achieved.

          •     Profit before tax 30 Jun 2018 £45.3m (30 Jun 2017: £16.2m; 31 Dec 2017: £28.7m) including gain on the disposal of investment properties £7.3m (30 June
                2017: negligible; 31 Dec 2017: £ 1.2m); and change in fair value of investment properties £27.9m (30 Jun 2017: £7.5m; 31 Dec 2017: £5.9m).

          •     EPS (fully diluted) – 30 Jun 2018 12.0pps paying a H1 2018 dividend 3.70pps up 2.8% on the six months to 30 Jun 2017 3.60pps.

*Rounded to whole numbers
                                                                                                                                                                             10
Stable Income Profile - Lease Expiries as at 30 June 2018
A large number of tenants offers income diversification, combined with intensive asset management, and security of lease renewals
Lease Expiry Income Profile
• Number of units: 1,294 10.3%
13.5%
• Number of tenants: 950
0-1 years
• Contracted rent roll: £61.3m
15.5% 1-3 years
• WAULT of 5.3 years
3-5 years
• WAULT to first break of 3.5 years 5-10 years
• 72% renewal rates, 74% continuity of income 10+ years
36.3%
24.4%
Lease Expiry Income Profile to First Break
12.0
CONTRACTED RENTAL INCOME
10.0 11.0 11.1
9.8
8.0
(£M)
6.0 6.8 6.9
4.0
2.0 3.3 3.3 3.6
1.6 1.7 0.4
0.0
2018 2019 2020 2021 2022 2023 2024 2025 2026 2027 2028+
11Financial Position Remains Strong, Flexible and Defensive
As at 31 December 2017 As at 30 June 2018 Change**
Investment Property Asset Value £737.3m £758.7m +£21.4m
NAV (fully diluted) 105.1pps 112.9pps +7.8pps
EPRA NAV (fully diluted) 105.9pps 113.6pps +7.7pps
Bank borrowings (incl. zero dividend preference shares)* £376.5m £391.9m +£15.4m
Weighted average cost of debt (inc. hedging) 3.8% 3.8% 0bps
Net Loan-to-value 45.0% 41.2% (380bps)
Occupancy by value 85.0% 85.5% +50bps
Occupancy by value like-for-like 86.1% 84.8% (130bps)
Contracted rent roll like-for-like £58.8m £57.7m £1.1m
• Gross investment property value includes +4.5% like-for-like valuation improvement, adjusting for capital expenditure, acquisitions of £40.1m (before costs)
and disposals of £60.4m net.
• EPRA NAV-diluted increase of 7% from 31 Dec 2017 to 113.6pps. Predominately from change in the fair value of investment properties £27.9m and gains on
the disposal of investment properties £7.2m
• Borrowings increased by net £15.4m with the acquisition on 2 May 2018 of a £35.2m regional portfolio.
• Net LTV decreased as a result of realised gains on the disposal of investment properties coupled with the portfolio revaluation.
• Occupancy remains stable. Granular asset management initiatives continued to be executed across the portfolio
• Total accounting returns to shareholders since IPO of 32.0%. Annualised total accounting rate of return 11.0%, in line with our 10% target
*Before unamortised loan arrangement fees
**Rounded to whole numbers 12Investment Property Activity
Investment Properties Bridge 30 June 2018
770
27.9 758.7
750
737.3
7.2
730
4.4
£ millions
42.1
710
690
(60.4)
670
Valuations Disposals (Net of costs) Acquisitions (Incl. costs) CAPEX Gain/(loss) on the Valuation uplift Valuations
31 Dec 17 disposal of properties 30 Jun 18
Chart may not sum due to roundings
13Delivering Returns to Shareholders
• EPRA : £426.5 (113.6pps fully diluted)
• (31 Dec’17: £395.7m, 105.9pps fully diluted)
EPRA Net Asset Value - diluted Bridge 30 June 2018
125.0
• IFRS: £423.9m (112.9pps fully diluted)
(31 Dec’17: £392.9m, 105.1pps fully diluted)
1.9
8.6
120.0
(1.2) (2.0)
115.0
Pence per share
(4.3) 113.6
7.2
(1.1)
(1.4)
110.0
Change in fair value of investment properties
105.9
105.0
100.0
31 Dec 2017 - Net Rental Income Admin Expenses Valuation(Incl. Net Net Capital Gain on the Disposal Net Finance Expense Dividends Performance Fee and 30 Jun 2018
Adjusted (excl. Perf. Fee) Capital Expenditure) Expenditure of Investment Impairment of
Properties Goodwill
Chart may not sum due to roundings
14Debt - LTV Management
800 48%
758.7
47.3% 737.3
640.4
46%
600
45.0%
44%
£Millions
400
42%
41.2%
335.0 376.5 391.9
200
40%
32.2 44.6 79.5
0 38%
Jun-17 Dec-17 Jun-18
Cash Borrowings Investment Properties Net LTV (rhs)
Chart may not sum due to roundings
15Debt - Profile and LTVs as at 30 June 2018
Borrowing strategy remains prudent and defensive with long maturity
Lender Original Outstanding Maturity Gross Loan to Annual Interest Rate Amortisation Swaps\Caps: Rates
Facility Debt* Date Value** Notional Amounts
£'000 £'000
ICG Longbow Ltd £65,000 £65,000 Aug-19 41.0% 5.00% Fixed None n/a
Royal Bank of Scotland £34,295 £34,295 Dec-20 46.7% 2.00% over 3mth £ LIBOR Mandatory Prepayment 8,688 1.34%
8,688 1.34%
Mandatory Prepayment plus qtly
HSBC £20,797 £20,797 Dec-21 51.1% 2.15% over 3mth £ LIBOR -
instalments of £100,000
Santander UK £68,269 £68,269 Nov-22 41.7% 2.15% over 3mth £ LIBOR Mandatory Prepayment 35,350 1.605%
35,350 1.605%
Scottish Widows Ltd. & Aviva Investors Real Estate
£165,000 £165,000 Dec-27 46.0% 3.28% Fixed Mandatory Prepayment n/a
Finance
£353,361 £353,361
Zero Dividend Preference Shares £39,879 £38,524 Jan-19 NA 6.50% Fixed None n/a
£393,240 £391,885
*£50m Retail Eligible Bond 4.5% 2024 was admitted to trading on the London Stock Exchange on the 6 August 2018.
* Before unamortised debt issue costs
** Based on Cushman and Wakefield and Jones and Lang LaSalle property valuations
16Asset Management Highlights
Disposals
Bluebell Portfolio (Phase 1)
o Portfolio comprised of 15 industrial property assets, 54 units, and 42 tenants amounting to 610,620 sq ft.
o The sale price represents an uplift of 24.1% against the December 2017 valuation.
o Three properties still to complete: Grecian Crescent, Bolton, Thames Trading Estate, Manchester, and Imperial Business Park, Gravesend.
Disposals post H1
Bluebell Portfolio (Phase 2)
o Three properties still to complete: Grecian Crescent, Bolton, Thames Trading Estate, Manchester, Imperial Business Park, Gravesend, accounting for c. £5.0m of original sale price.
o Additional disposal of industrial estate in Walsall now included in portfolio. This is due to complete in H2 2018 at a sale price of c. £7.6m, bringing total sale price of portfolio to £46.7m.
Podium Site at Arena Point, Leeds
o Following the acquisition, London and Scottish Investments recognised the potential for the repositioning of part of this asset for alternative use and agreed to a joint venture with Unite Students.
o Having successfully worked with Unite to obtain planning consent for a large-scale student housing development, Regional REIT has achieved a final sale price of £12.2m for the site – an increase
from the £10.5m announced in November 2017. Sale completed in August 2018.
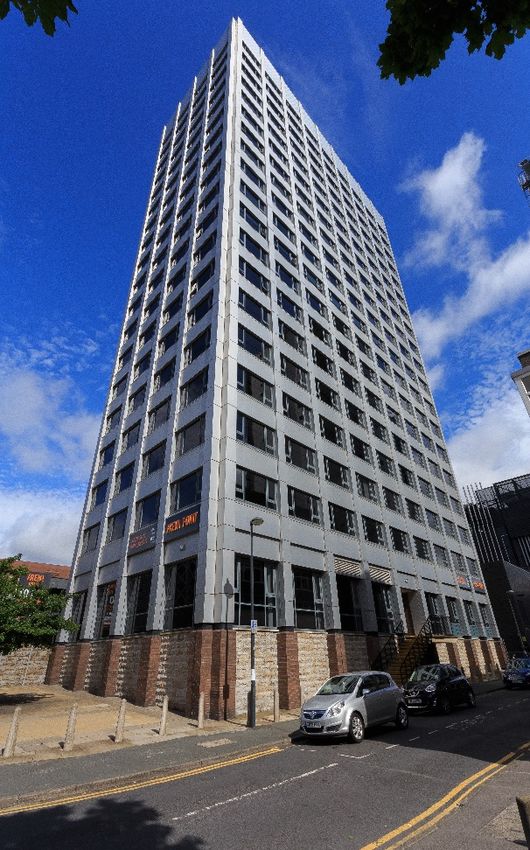
o Regional REIT retains the 19 storey Arena Point office building currently valued at £8.6m (June 18).
The Point, Glasgow
o Following completion of business plan, the Group sold the property into strong investment market at premium to December 2017 valuation of 5.6%, reflecting a net initial yield of 6.6%.
Wardpark, Cumbernauld
o The sale price of £26.4m was 21.1% above the December 2017 year end valuation.
Turnford Place, Cheshunt
o The sale price of £17.25m was 20.6% above the December 2017 year end valuation.
17Asset Management Highlights (continued)
Acquisitions
Purchase of six regional assets from Kildare Partners for £35.2 million in an off-market transaction
• Portfolio consists of five regional offices and one office/distribution property located in Telford,
Rotherham, Macclesfield, Dundee, Chelmsford and Bedford.
• The assets total circa 320,000 sq. ft. let to 12 tenants.
• Since acquisition:
o Regear of lease at Clearblue Innovation Centre, Bedford - SPD Development Company Limited
extended current lease to 2030, with break option in 2025. Headline rent of £825,000pa indicates an
uplift of 15.8%.
o International House, Telford - Lease to Simmonds Transport Ltd regeared from July 2018 for a
further 15 years
o The Courtyard, Macclesfield – Income from Elior UK Services Ltd now secured until 2024 at the
earliest following the removal of break option in 2019.
o Wren House, Chelmsford - NHS Property Services Ltd did not exercise break in September 2018. No
further opportunity to break – lease expiry in 2023. This is in line with our business plan.
Acquisitions Post H1
Purchase of eight regional assets for a consideration of £31.4m
• The portfolio consists of eight offices located in Hull, High Wycombe, Stockton-on-Tees, Ipswich,
Clevedon, Wakefield, Deeside and Lincoln.
• The assets total c. 275,000 sq. ft., let to 24 tenants.
• The assets are expected to provide a net income of approximately £2.81 million per annum, which equates
to a net initial yield of 8.66%.
18Market Overview and Outlook
19Opportunity for Regional Offices
Rolling 12 month rental value growth rates
Outperformance of regional offices 12%
10%
• Research from CBRE indicates that regional offices have 8%
outperformed in comparison to central London offices, 6%
4% 1.48%
delivering superior returns of 11.7% in the 12 months to
2%
June 2018 in comparison to Central London office returns 0%
of 6.5% -2% 0.05%
-4%
• This trend that has been witnessed over the past two years -6%
Mar-13
Mar-14
Mar-15
Mar-16
Mar-17
Mar-18
Jun-13
Jun-14
Jun-15
Jun-16
Jun-17
Jun-18
Sep-13
Dec-13
Sep-14
Dec-14
Sep-15
Dec-15
Sep-16
Dec-16
Sep-17
Dec-17
• Rental value growth for rest of UK office markets in the 12
months to June 2018 was 1.5%, considerably higher than Source: CBRE, Peel Hunt (June 2018)
the 0.05% rental growth for central London offices. Central London Offices Rest of UK Offices
• Savills research indicates that supply of vacant office space
Central London & regional office returns 12 months to June 18)
decreased each year for the last ten consecutive years, with 25% 23.3%
12.9 million sq. ft. remaining – 33% lower than 2009 level of 21.6%
19.1 million sq. ft. 20% 18.4%
16.9%
• Of the 7.4 million sq. ft. of office space under construction,
15% 12.6%
approximately 55% is already pre-let. 11.1% 11.7%
10%
6.5%
4.4%
5%
1.4%
0%
Jun-14 Jun-15 Jun-16 Jun-17 Jun-18
Source: CBRE, Peel Hunt (June 2018)
Central London Offices Rest of UK Offices
20Opportunity for Regional Industrial
UK industrial & logistics take-up (million sq. ft.)
Growing demand and limited supply for multi-sized, 18.0
16.7
15.7
multi-let industrial sites 16.0
14.0
• Cushman and Wakefield estimate that take-up in
million sq. ft.
12.0
H1 2018 totalled 16.7 million sq. ft., 6.3% higher
10.0
than the same period in 2017.
8.0
• The Investment Property Forum UK Consensus
6.0
Forecast, May 2018, anticipates rental growth of
3.6% in 2018. 4.0
2.0
• In comparison, the IPF UK Consensus Forecast
H1 2017 H1 2018
predicts that the all property average annual rental Q1 2017 Q2 2017
Source: Cushman & Wakefield (Q2 2018)
value growth expected for 2018 is 1.0%.
• In terms of development, although supply remains
constrained, some regions have experienced an Rental value growth (%) Capital value growth(%) Total return (%)
increase in speculative development, with this
figure expected to reach 8.7 million sq. ft., 6% 2018 2019 2020 2018/22 2018 2019 2020 2018/22 2018 2019 2020 2018/22
lower than the record levels in 2016. (Cushman &
Wakefield) Industrial
3.6 2.4 2.0 2.4 5.4 1.0 -0.1 1.3 10.2 5.8 4.8 6.3
All Property
1.0 0.6 1.0 1.2 0.4 -1.4 -0.7 -0.1 5.2 3.4 4.2 4.8
Source: IPF UK Consensus Forecast (May 2018)
21Outlook
• Investment demand for regional assets continues to be strong, with regional offices
outperforming Central London on both capital and income metric (Source: CBRE)
Regional commercial
• Regional economic and business fundamentals remain positive – continued limited supply of
property – remains an office and industrial properties due to re-purposing, increased commercial demand and little
attractive opportunity new development
• Our core markets continue to experience beneficial supply-demand dynamics
• Proven, experienced and professional local asset management team, with a strong reputation in
Regional REIT the sector, underpinning business growth
income security and • Continue to focus on occupancy and improvement from modest rents and capital values
capital gains underpin • Continued opportunistic strategy of disposals and acquisitions when individual asset
performance strength management initiatives have been delivered and pricing achieved at a substantial premium to
valuations
22Appendix
• Financial and Debt Review
• Property Portfolio
• Overview of Regional REIT and External Management
23Financial and Debt Review
24Financial - Statement of Comprehensive Income
Half year-end June 2017 Half year-end June 2018 Change*
(£’000) (£’000)
Rental Income 22,964 30,626 7,662
Non-recoverable property costs (3,480) (3,716) (236)
Net rental income 19,484 26,910 7,426
Administrative & other expenses (5,166) (9,288) (4,122)
Operating profit (loss) before gains/losses on property assets/other investments 14,318 17,622 3,304
Gains on the disposal of investment properties (41) 7,226 7,267
Change in fair value of investment properties 7,504 27,936 20,432
Operating profit/(loss) 21,781 52,784 31,003
Net finance income/expense, impairment of goodwill and net movement in fair value of (5,597) (7,517) (1,920)
derivative financial instruments
Profit/(loss) before tax 16,184 45,267 29,083
Income tax expense (11) (355) (344)
Profit/(loss) after tax for the period (attributable to equity shareholders) 16,173 44,912 28,739
Earnings/(losses) per share - basic 5.6p 12.0p 6.4p
Earnings/(losses) per share - diluted 5.6p 12.0p 6.4p
EPRA earnings/(losses) per share - basic 2.9p 2.6p (0.3p)
EPRA earnings/(losses) per share - diluted 2.9p 2.6p (0.3p)
*Rounded to whole numbers
25Financial - Statement of Financial Position
Year-end 2017 Half year-end Year-end 2017 Half year-end
Change* Change*
(£’000) June 2018 (£’000) (£’000) June 2018 (£’000)
Assets Non-current Assets Liabilities Current liabilities
Investment properties 737,330 758,653 21,323 Bank and loan borrowings – current** (400) (400) -
Goodwill 1,672 1,393 (279)
Other current liabilities(Incl. ZDPs) (42,244) (88,670) (46,426)
Other non-current assets 1,926 1,493 -
Non-current liabilities
Current assets Bank and loan borrowings - non
current (333,981) (348,265) (14,284)
Other current assets 21,947 20,567 (1,813)
Cash and cash equivalents 44,640 79,520 34,880 Zero dividend preference shares (37,239) - 37,239
Other (752) (434) 318
Total assets 807,515 861,626 54,111
Total liabilities (414,616) (437,769) (23,153)
Net assets 392,899 423,857 30,958
Share capital 370,318 370,316 (2)
Retained earnings/accumulated
(losses) 22,581 53,541 30,960
Total equity 392,899 423,857 30,958
Net assets per share - basic 105.4p 113.7p 8.30
Net assets per share - diluted 105.1p 112.9p 7.80
EPRA net assets per share - basic 106.1p 114.4p 8.30
EPRA net assets per share - diluted 105.9p 113.6p 7.70
*Rounded to whole numbers
** HSBC Bank Facility Quarterly £100k repayment term
26Property Portfolio
27High Yielding & Highly Diversified Actively Managed Portfolio
Portfolio details at 30 June 2018
Occupancy Occupancy WAULT to
Valuation % by Sq. ft. Gross rental Average rent ERV Capital Net Initial Equivalent Reversionary
Sector Properties (by value) (by area) first break
(£m) valuation (mil) income (£m) £psf (£m) rate £psf Yield (%) Yield (%) Yield (%)
(%) (%) (yrs)
Office 97 533.4 70.3% 4.11 84.4% 83.2% 3.0 43.2 12.65 53.0 129.86 6.4% 8.4% 9.2%
Industrial 25 159.1 21.0% 3.72 87.6% 87.9% 4.7 12.3 3.75 14.1 42.75 6.3% 7.9% 8.4%
Retail 27 56.3 7.4% 0.55 89.4% 86.9% 4.3 5.1 10.53 5.5 101.65 7.5% 8.3% 8.8%
Other 2 9.9 1.3% 0.12 94.9% 59.1% 8.8 0.7 9.85 0.8 80.28 6.7% 7.6% 7.3%
Total 151 758.7 100.0% 8.51 85.5% 85.1% 3.5 61.3 8.46 73.4 89.20 6.4% 8.3% 9.0%
Occupancy Occupancy WAULT to
Valuation % by Sq. ft. Gross rental Average rent ERV Capital Net Initial Equivalent Reversionary
Region Properties (by value) (by area) first break
(£m) valuation (mil) income (£m) £psf (£m) rate £psf Yield (%) Yield (%) Yield (%)
(%) (%) (yrs)
Scotland 42 166.0 21.9% 2.59 83.5% 81.4% 3.5 15.1 7.14 18.3 64.06 7.3% 9.2% 10.3%
South East 30 217.9 28.7% 1.51 94.4% 94.0% 2.7 17.5 12.30 19.0 143.90 6.7% 7.3% 7.9%
North East 19 88.2 11.6% 1.24 85.9% 89.2% 3.0 7.2 6.49 8.8 71.35 6.7% 8.9% 9.5%
Midlands 30 117.4 15.5% 1.38 86.5% 88.1% 3.6 9.6 7.88 10.4 85.09 6.8% 8.4% 8.6%
North West 17 84.5 11.1% 1.12 79.3% 79.3% 5.5 6.2 7.02 8.7 75.54 5.4% 8.8% 9.3%
South West 11 63.8 8.4% 0.42 68.9% 74.1% 3.2 4.1 13.30 6.4 151.87 3.6% 8.2% 9.3%
Wales 2 20.9 2.8% 0.25 88.6% 78.7% 7.0 1.6 8.33 1.8 85.20 6.9% 7.3% 7.6%
Total 151 758.7 100.0% 8.51 85.5% 85.1% 3.5 61.3 8.46 73.4 89.20 6.4% 8.3% 9.0%
Net yields are based on gross rental income after voids and irrecoverable costs and based on standard purchasers costs of approximately 6.8%. Note: Reversionary yield excludes expired leases. Tables may not sum due to
rounding
28Top 15 Investments (market value) as at 30 June 2018
Annualised WAULT to
Market % of Lettable area Let by area Let by rental
Property Sector Anchor tenants gross rent first break
value (£m) portfolio (Sq. Ft) (%) value (%)
(£m) (years)
Tay House, Glasgow Office Barclays Bank Plc, University of Glasgow 32.8 4.3% 156,933 87.7% 87.5% 2.5 3.0
Juniper Park, Basildon Industrial A Share & Sons Ltd, Schenker Ltd, Vanguard 27.4 3.6% 277,228 98.4% 97.0% 2.0 1.6
Logistics Services Ltd
Genesis Business Park, Woking Office Wick Hill Ltd, Alpha Fry Ltd, McCarthy & 24.9 3.3% 98,359 100.0% 100.0% 1.9 3.2
Stone Retirement Lifestyles Ltd
Buildings 2 & 3 HBOS Campus, Aylesbury Office Scottish Widows Ltd, Agria Pet Insurance Ltd, 24.4 3.2% 140,676 92.5% 92.8% 2.2 4.5
The Equitable Life Assurance Society
Wardpark Industrial Estate, Cumbernauld Industrial Thomson Pettie Ltd, Cummins Ltd, Balfour 22.2 2.9% 686,940 87.2% 86.2% 2.2 2.2
Beatty WorkSmart Ltd
Hampshire Corporate Park, Eastleigh Office Aviva Health UK Ltd, The Royal Bank of 19.1 2.5% 85,422 99.2% 99.5% 1.4 2.2
Scotland Plc, Utilita Energy Ltd, Daisy
Wholesale Ltd
One and Two Newstead Court, Annesley Office E.ON UK Plc 16.4 2.2% 146,262 100.0% 100.0% 1.4 2.1
Turnford Place, Cheshunt Office Countryside Properties (UK) Ltd, Pulse 16.3 2.1% 59,176 99.5% 100.0% 1.1 2.9
Healthcare Ltd, Poupart Ltd
800 Aztec West, Bristol Office - 16.2 2.1% 71,651 0.0% 0.0% 0.0 -
Road 4 Winsford Industrial Estate, Industrial Jiffy Packaging Ltd 15.6 2.1% 246,209 100.0% 100.0% 0.9 16.3
Winsford
Columbus House, Coventry, Coventry Office TUI Northern Europe Ltd 14.5 1.9% 53,253 100.0% 100.0% 1.4 5.5
The Point, Glasgow, Glasgow Industrial SeeWoo Foods (Glasgow) Ltd, University of 14.1 1.9% 169,190 94.1% 100.0% 1.0 5.6
Glasgow, Screwfix Direct Ltd, Euro Car Parts
Ltd
Ashby Park, Ashby De La Zouch Office Ceva Logistics Ltd, Hill Rom UK Ltd, Alstom 13.6 1.8% 91,752 100.0% 100.0% 1.1 2.3
Power Ltd
Portland Street, Manchester Office New College Manchester Ltd, Darwin Loan 13.0 1.7% 54,959 100.0% 96.9% 0.8 2.9
Solutions Ltd, Mott MacDonald Ltd
Arena Point, Leeds Office The Foundation for Credit Counselling, 12.5 1.6% 82,498 90.1% 87.4% 0.8 2.4
Interserve Working Futures Ltd, Urquhart-
Dykes & Lord LLP, JD Wetherspoon Plc
Total 282.8 37.3% 2,420,508 91.2% 89.6% 20.7 3.7
Table may not sum due to rounding. Rows in grey refer to buildings and part buildings that were sold post 30 June 2018.
29Top 15 Tenants (share of rental income) as at 30 June 2018
Tenant Property Sector WAULT to first Lettable area % of Gross rental
break (years) (Sq Ft) income
3.4 2.7%
Barclays Bank Plc Tay House, Glasgow Financial and insurance activities 78,044
Electricity, gas, steam and air conditioning 2.1 2.4%
E.ON UK Plc One & Two Newstead Court, Annesley supply 146,262
5.5 2.3%
TUI Northern Europe Ltd Columbus House, Coventry Professional, scientific and technical activities 53,253
3.4 2.2%
Scottish Widows Limited Buildings 3 HBOS Campus, Aylesbury Financial and insurance activities 79,291
The Scottish Ministers Templeton On The Green, Glasgow Public sector 2.9 111,076 2.2%
Calton House, Edinburgh
Quadrant House, Dundee
The Courtyard, Falkirk
The Royal Bank of Scotland Plc Hampshire Corporate Park, Eastleigh Financial and insurance activities 3.2 88,394 1.9%
Cyan Building, Rotherham
16.3 1.5%
Jiffy Packaging Ltd Road 4 Winsford Industrial Estate, Winsford Manufacturing 246,209
0.9 1.2%
Fluor Limited Brennan House, Farnborough Construction 29,707
2.3 1.2%
SPD Development Co Ltd Clearblue Innovation Centre, Bedford Professional, scientific and technical activities 58,167
3.5 1.1%
The Secretary of State for Transport St Brendans Court, Bristol Public sector 55,586
Festival Court, Glasgow
5.9 1.1%
A Share & Sons Ltd 1-4 Llansamlet Retail Park, Swansea Wholesale and retail trade 75,791
Juniper Park, Basildon
0.0 1.1%
Lloyds Bank Plc Victory House, Chatham Financial and insurance activities 48,372
0.5 1.1%
Aviva Health UK Ltd Hampshire Corporate Park, Eastleigh Financial and insurance activities 42,612
Sec of State for Communities & Local Govt Bennett House, Hanley Public sector 0.1 52,155 1.0%
Oakland House, Manchester
2.5 50,549 1.0%
Entserv UK Limited Birchwood Park, Warrington Information and communication
Total 3.7 1,215,468 23.9%
Table may not sum due to rounding
30Disposals
31Disposal of Bluebell Portfolio
Sale of 15 Industrial Portfolio for £39.1m
Overview
• Portfolio comprised of 15 industrial property assets, 54 units, and 42
tenants amounting to 610,620 sq ft.
• The sale price represents an uplift of 24.1% against the December
2017 valuation.
Asset Management Initiatives:
• 218-222 Newhall Road, Sheffield - purchased as a multi-let with voids
and short term tenancies and subsequently re-geared on a single long
lease to the main occupier.
• Eurotherm Unit, Faraday Close, Worthing – completed rent review in
February 2017 with an agreed uplift from £292,288pa to £345,000pa.
• Grecian Crescent, Bolton – purchased with Wolesely as tenant for the
rump end of a lease knowing they would vacate and then refurbished
and re-let.
Phase I
• Disposal of 12 properties completed in phase I accounting for £34.1m
of original sale price.
Phase II
• Three properties still to complete: Grecian Crescent, Bolton, Thames Sale price Valuation Dec 17 Floor area
Trading Estate, Manchester, Imperial Business Park, Gravesend,
accounting for c. £5.0m of original sale price. £39.1m £31.2m 610,620 sq. ft
• Additional disposal of industrial estate in Walsall now included in
portfolio. This is due to complete in H2 2018 at a sale price of c.
£7.6m, bringing total sale price of portfolio to £46.7m. Sale price uplift against Dec 17 valuation Net Initial Yield
24.1% 6.9%
32Sale of Podium Site at Arena Point, Leeds
Completion of Podium sale to Unite
Investment Overview
• Acquired in March 2016 as part of the “Wing” portfolio.
• Phased refurbishment of vacant office floors being advanced. 50%
of refurbished space already let.
Sale of Podium
• Following the acquisition, London and Scottish Investments, the
Asset Manager to Regional REIT, recognised the potential for the
repositioning of part of this asset for alternative use and agreed to a
joint venture with Unite Students.
• Having successfully worked with Unite to obtain planning consent
for a large-scale student housing development, Regional REIT has
achieved a final sale price of £12.2m for the site – an increase from
the £10.5m announced in November 2017. Sale completed in
August 2018.
• Regional REIT retains the 19 storey Arena Point office building
currently valued at £8.6m (June 2018).
Sale Price Valuation Dec 17 Floor area
£12.2m £3.9m 14,458 sq. ft
Sale price uplift against Dec 17 valuation ERV (Jun 18)
227.6% £0.16m
33The Point, Glasgow
Sale price 5.6% above December 2017 valuation
Investment Overview
• Multi let trade counter investment located to north of Glasgow
City Centre extending to 158,546 sq. ft. comprises of 11 individual
units let on 10 separate leases
• Tenants include SeeWoo Foods (Glasgow) Ltd, University of
Glasgow, Screwfix Direct Ltd, Euro Car Parts Ltd
Investment Strategy
• Surrendered lease of poorly performing Unit 4 (10,000 sq. ft.), split
unit and re-let to trade counter users at improved rental tone
• Unit split and re-let to Travis Perkins and Toolstation at improved
rental tone of £7 per sq. ft.
• Lease of Unit 8 to Glasgow University re-geared for 10 years from
January 2018 expiry at £7 per sq. ft.
• Rent review of Unit 5 settled at £8 per sq. ft. from January 2018
Disposal
• The Group sold the property into strong investment market at
premium to December 2017 valuation of 5.6%
• Reflecting a net initial yield of 6.6% Sale Price Occupancy (by value) ERV (Jun 18)
£14.1m 100.0% £1.1m
Sale price uplift against Dec 17 valuation Net Initial Yield
5.6% 6.6%
34Other Key Disposals
Regional REIT remains active and opportunistic – disposing of assets on Disposals in H1 2018
completion of their business plan or when it has made strategic sense to do so
(net of costs) amount
Disposals in H1 2018 to
• It has been a busy period in terms of disposals, the Group has sold a number of
assets with at premium to valuation. achieved a 15.2% £60.4m
uplift on December
• Sales in the first half on 2018 achieved a 15.2% premium to December 2017
2017 valuations
valuation
Net Initial Yield
• Key disposals shown in table below: 4.9%
Property Sector Sale Price Dec 17 Valuation Jun 17 Valuation Uplift on Dec 17 Uplift on Jun 17
CGU House, Leeds Office 9,580,000 9,350,000 8,300,000 2.5% 15.4%
Lonsdale House, Birmingham Office 2,850,000 2,850,000 1,750,000 0.0% 62.9%
Cortonwood Business Park, Rotherham Industrial 2,750,000 2,200,000 2,200,000 25.0% 25.0%
St Georges House Office 2,300,000 2,300,000 1,900,000 0.0% 21.1%
Units 3 & 4 Donegal House Office 2,100,000 1,500,000 1,500,000 40.0% 40.0%
Unit 6 Centrepoint, Manchester Industrial 1,980,000 1,980,000 1,750,000 0.0% 13.1%
Gartsherrie Industrial Estate, Coatbridge Industrial 1,525,000 1,525,000 1,300,000 0.0% 17.3%
Total 23,085,000 21,705,000 18,700,000 6.4% 23.4%
35Acquisitions
36Acquisition of £35.2 million regional portfolio
This acquisition highlights our disciplined approach to capital
management, with disposal proceeds being promptly
redeployed ensuring minimal cash drag.
Overview
• Purchase of six regional assets from Kildare Partners for £35.2
million in an off-market transaction.
• Portfolio consists of five regional offices and one
office/distribution property located in Telford, Rotherham,
Macclesfield, Dundee, Chelmsford and Bedford.
• The assets total circa 320,000 sq. ft. let to 12 tenants.
Since acquisition:
• Regear of lease at Clearblue Innovation Centre, Bedford - SPD
Development Company Limited extended current lease to
2030, with break option in 2025. Headline rent of £825,000pa
indicates an uplift of 15.8%.
• International House, Telford - Lease to Simmonds Transport
Ltd regeared from July 2018 for a further 15 years
• The Courtyard, Macclesfield – Income from Elior UK Services
Purchase Price Net Initial Yield Estimated Rental Value
Ltd now secured until 2024 at the earliest following the removal £35.2m 8.4% £3.2m
of break option in 2019.
• Wren House, Chelmsford - NHS Property Services Ltd did not
exercise break in September 2018. No further opportunity to Anchor Tenants
break – lease expiry in 2023. This is in line with our business June 2018 Valuation NHS Property Services Ltd, Swiss Precision
plan.
£36.6m Diagnostics, Capgemini, Elior UK Services Ltd., The
Royal Bank of Scotland Plc, The Scottish Ministers
37Portfolio Updates
38Rainbow Portfolio
800 Aztec West, Bristol
• Major £6.9m “back to shell” refurbishment completed in August 2018 into
active Bristol market with limited city centre supply.
• Lease completed with Edvance SAS for the entire first floor (31,549 sq. ft.) for
£21.50psf (£678k pa)
Buildings 2 HBOS Campus, Aylesbury
• Concurrent re-letting of first and second floors to Equitable Life completed
November 2016 for 10-years subject to tenant break options at £426,360 pa
following expiry of the Lloyds Banking Group lease
• Coffee shop installed to reception to meet requirements of Equitable Life.
• First floor (13,832 sq. ft.) let to Agria Pet Insurance February 18 on 10 year
lease at headline rental of £235,000 pa
• Fourth Floor - 5,721 sq. ft. was let to Identify Group Ltd for 10 years with
option to break in 2023. The annual rent is c. £98,000.
• The remainder of the fourth floor (3,347 sq. ft.) is now let to Prospitalia Htrak
Limited on a 10-year lease at £60,000, subject to a break option at the fifth
anniversary.
Juniper Park, Basildon
• Regear of lease to Johnson Controls Building Efficiency UK Limited until 2023
at an increased headline rent of £60,610pa, an uplift of 3.8%. Acquisition Price Valuation June 18 Floor area
£80.0m £90.8m 886,971 sq. ft
Llandough Trading Estate, Cardff
• Sold as part of Bluebell portfolio for £9.1m, indicating a 57.7% premium to
December 2017 valuation.
Like-for-Like valuation uplift on Dec 17 Headline rent (pa)
Pitreavie Business Park, Dunfermline
• Sold as part of Bluebell portfolio for £2.7m, indicating a 18.9% premium to 12.2% £5.8m
December 2017 valuation.
39Wing Portfolio
Northern Cross, Basingstoke
• Occupancy (by value) now 88.5% following letting of Suite B1 to BNP Paribas from July 2016 to
2029 with tenant break option in 2024. Lease to tie-in with the tenant’s other leases in the building
at a rent of £7,150 pa.
• Necessary fabric repair works completed and being recovered via service charge.
• WC refurbishment scheme to be advanced – to be funded by service charge and main tenant,
BNP, contributing £60k capital in addition to their s/c contribution.
Tokenspire Business Park, Beverley
• Occupancy (by value) now 95.2% following a number of lettings since acquisition.
• Letting success continued in H1 2018, including:
o 2,177 sq. ft let to Crossfit Barbaric Ltd at a headline rent of £7,500pa.
o 1,905 let to Oracle Taps Ltd at a headline rent of £5,000pa.
o Major tenants, Sargent Electrical and QDOS Entertainment continue to commit and invest
in site.
Arena Point, Leeds
• Phased refurbishment of vacant office floors being advanced. 50% of refurbished space let to
Interserve.
• High level illuminated signage installed marking building on cityscape.
• In H1 2018, 1,342 sq. ft was let to Kier Construction Ltd at a headline rent of £20,130pa.
• Sale of podium site Unite for £12.2m completed in August 2018.
Oakland House, Manchester Acquisition Price Valuation June 18 Floor area
• Since acquisition front of house works have been undertaken to improve presentation to include
installation of coffee facility/improvements to washroom facilities/relining all external road
£37.5m £40.6m 681,845 sq. ft
areas/creation of external garden/picnic area/progression of high-level external illuminated
signage.
• Terms agreed for letting of half third floor with tenant having option over balance of space. Like-for-Like valuation uplift on Dec 17 Headline rent (pa)
• Business lounge/co-working area to be formed on ground floor west wing to include shower
facilities. 1.7% £3.6m
40Capital Expenditure
41800 Aztec West, Bristol
Before After
• Acquired March 2016
• A 71,651 sq. ft. three storey office located in the Aztec West
Business Park near the M4 / M5 interchange in Bristol.
• The building was previously occupied by EE whose lease expired
December 2016.
• Recently undertaken a major “back to shell” refurbishment of the
whole building completed in August 2018 into active Bristol
market with limited city centre supply.
• Costs for the project are as follows:
• Construction cost: £6.45m excl VAT.
• Professional fee’s: £435k excl VAT.
• Total: £6.9m excl VAT.
• Dilapidation settlement of £2.53m
• Lease agreed with Edvance SAS for the entire first floor (31,549 sq.
ft.) for £21.50psf (£678k pa) Acquisition Price Valuation Jun 18 ERV (Jun 18)
• Positive occupier lines of enquiry being advanced for the
£6.0m £16.2m £1.6m
remaining space
Valuation uplift from Dec 17 Total Capital Expenditure
55.2% £6.9m
42800 Aztec West, Bristol
• The design and refurbishment has made a variety of significant
improvements to the building including:
• Increased the EPC rating (originally ‘E 120 points’ to B 36).
• Increased lettable space (converted oversized old plantrooms on
all three floors into 3,337 sq. ft. of additional office space).
• New energy efficient services and better working environment
designed on occupancy level of 1 person per 8m².
• Increased WC provision to comply with current standards
(original building was under provided for toilets, urinals and wash
hand basins).
• Flexible office arrangement for multi letting (separate metered
electrical supply to each pod etc).
• Installed new shower block, car charging points and bicycle
storage to encourage green travel.
• Brought the building and its services up to current standards and
in full compliance with current Building Regulations (fire,
accessibility etc).
43Buildings 2 & 3, HBOS Campus, Aylesbury
Before After
• The ownership comprises two imposing HQ style
office buildings situated on extensive self-contained
campus style grounds.
• The site is located adjacent to Aylesbury mainline
railway station with regular services to London
Marleybone.
• Building 2 is a 66,833 sq ft five storey steel frame
building. Known locally as the ‘Blue Leanie’ the
building is a unique design with the full height external
glazed curtain walling ‘leaning’ at various opposing
angles on each façade. The property was purpose built
for Equitable Life in 1988.
• Building 3 is a large floor plate purpose built office
property extending to 80,103 sq ft. The building is
formed in a courtyard style and is of steel frame
construction with part glazed and part brick facades.
• At acquisition, both buildings were let in their entirety
to The Lloyds Banking Group (LBG) with the leases
held by Scottish Widows Limited. Building 3 was
wholly occupied by LBG with Building 2 part vacant
and part occupied over two floors by LBG.
Acquisition Price Valuation Jun 18 ERV (Jun 18)
£21.1m £24.4m £2.2m
Valuation uplift from Dec 17 Capital Expenditure
4.8% £3.4m (gross)
44Buildings 2 & 3, HBOS Campus, Aylesbury
• Prior to acquisition LBG had served Notice to Quit on Building 2 as at the break option
in their favour in November 2016. Our original strategy was to retain ELAS across the
two floors they occupied and subsequently undertake a large scale refurbishment of the
building to address the long term lack of investment in the property by LBG during their
tenure and also to create an attractive product for the commercial letting market.
• We subsequently re-geared the ELAS sub-tenancies and agreed two new 10 year leases
over floors 2 and 3 at a combined rent of £426,360 per annum equivalent to £15.00 per
sq ft. The lease of the second floor has a break option as at the third and fifth anniversaries
to suit the expected gradual reduction of the ELAS operation.
• Refurbishment of Building 2 completed March 2018 and covered full refurbishment of
all of the office floors along with the upgrading entrance, reception, common landing and
stair core and lift and redecoration of framing to external curtain walling system.
• Office returned to full open plan layout with new ceilings and LED lighting.
• Dilapidations claim served against LBG - we expect to negotiate a minimum settlement
of £1.1 million against the cost of the refurbishment works. The sellers had agreed a
figure closer to 50% of this with LBG.
• Refurbished space on first and fourth floors now successfully let at headline rents ranging
from £16.20 - £17.00 – only ground floor remains available with good levels of interest.
• The LBG lease of Building 3 expires in November 2021.
45Buildings 2 & 3, HBOS Campus, Aylesbury
462800 The Crescent, Birmingham Business Park
Before After
• Acquired as part of Empire Portfolio in
August 2014.
• 28,896 sq ft HQ building over two floors
with 140 car spaces located on premier
business park in proximity to Birmingham
Airport.
• Let to Severn Trent Water on lease
expiring March 2016.
• The building has been substantially
refurbished including a remodelled
reception, lift lobby and core at ground
floor level, new WC cores on both the
ground and first floor and new entrance
with Grade A spec – LED lighting VRF
heating/cooling.
• Dilapidations agreed at £950k.
• Building positively launched to market
March 18. Acquisition Price Valuation Jun 18 ERV (Jun 18)
• Strong interest in all accommodation. £3.2m £5.8m £0.6m
Valuation uplift from Dec 17 Capital Expenditure
22.6% £2.4m (gross)
47Disclaimer
This document (“Document”) (references to which shall be deemed to include any information which has been made or may be supplied orally in connection with this Document or in connection with
any further enquiries) has been prepared by and is the sole responsibility of Toscafund Asset Management LLP (“Toscafund”, in its capacity as Investment Manager of Regional REIT Limited (“Regional
REIT” or the “Company”)) in relation to the Company and its subsidiary undertakings (“the Group”). Certain identified content is, however, externally sourced and other information is provided by the
Company’s Asset Manager, London & Scottish Investments Limited.
This Document is published solely for information purposes. This Document does not constitute or form part of, and should not be construed as, an offer to sell or the solicitation or invitation of any offer
to subscribe for, buy or otherwise acquire any securities or financial instruments of any member of the Group or to exercise any investment decision in relation thereto.
The information and opinions contained in this presentation are provided as at the date of this presentation solely for your information and background, may be different from opinions expressed
elsewhere and are subject to completion, revision and amendment without notice. None of Toscafund or its members, the Company, the directors of the Company or any other person shall have any
liability whatsoever (in negligence or otherwise) for any loss however arising from any use of this Document, its contents or otherwise arising in connection with this Document.
The information contained in this Document has not been independently verified by Toscafund or any other person. No representation, warranty or undertaking, either express or implied, is made by
Toscafund, the Company, any other member of the Group and any of their respective advisers, representatives, affiliates, offices, partners, employees or agents as to, and no reliance should be placed on the
fairness, accuracy, completeness, reasonableness or reliability of the information or the opinions contained herein. Toscafund, the Company, any other member of the Group and any of their respective
advisers, representatives, affiliates, offices, partners, employees and agents expressly disclaim any and all liability which may be based on this Document and any errors or inaccuracies therein or omissions
therefrom.
This Document includes forward-looking statements that reflect Toscafund’s views with respect to future events and financial and operational performance. All statements other than statements of historic
facts included in this Document, including, without limitation, those regarding the Group’s results of operations, financial position, business strategy, plans and objectives of the Group for future operations
and the net asset value of the Group are forward-looking statements. Such forward-looking statements involve known and unknown risks, uncertainties and other important factors beyond the control of
the Group that could cause the actual results, performance or achievements of Regional REIT to be materially different from future results, performance or achievements expressed or implied by such
forward-looking statements. They speak only as at the date of this Document and actual results, performance or achievements may differ materially from those expressed or implied from the forward
looking statements. Toscafund and Regional REIT do not undertake to review, confirm or release publicly or otherwise to investors or any other person any update to forward-looking statements to reflect
any changes in the Group’s expectations with regard thereto, or any changes in events, conditions or circumstances on which any such statement is based.
This Document, and any matter or dispute (whether contractual or non-contractual) arising out of it, shall be governed or construed in accordance with English law and the English courts shall have
exclusive jurisdiction in relation to any such matter or dispute.
By continuing to use this Document, you are agreeing to the terms and conditions set forth above.
Copies of the 2017 Annual Report & Accounts of Regional are available from the registered office of Regional REIT and on the Group’s website at www.regionalreit.com.
48You can also read