Investor presentation - Results for the year ending 31st December 2019 - YEW Grove REIT
←
→
Page content transcription
If your browser does not render page correctly, please read the page content below
Investor presentation
Results for the year ending 31st December 2019
Disclaimer & Important Notice

This presentation (hereinafter "this document") has been prepared by Yew Grove REIT plc (the "Company“ or “Group”) for information purposes only.
This document has been prepared in good faith but the information contained in it has not been independently verified and does not purport to be comprehensive. This
document is neither a prospectus nor an offer nor an invitation to apply for securities.

Nothing contained in this document shall form the basis of any contract or commitment whatsoever. No representation or warranty, express or implied, is given by or on
behalf of the Company, its group companies, or any of their respective shareholders, directors, officers, employees, advisers, agents or any other persons as to the accuracy,
completeness, fairness or sufficiency of the information, projections, forecasts or opinions contained in this document. In particular, the market data in this document has
been sourced from third parties. Save in the case of fraud, no liability is accepted for any errors, omissions or inaccuracies in any of the information or opinions in this
document and neither the Company and its group companies nor any of their respective employees, officers, directors, advisers, representatives, agents or affiliates, shall
have any liability whatsoever (in negligence or otherwise, whether direct or indirect, in contract, tort or otherwise) for any loss howsoever arising from any use of this
document or its contents or otherwise arising in connection with this document. Certain information contained in this document has been obtained from published and non-
published sources prepared by other parties, which in certain cases have not been updated to the date hereof. While such information is believed to be reliable for the
purpose used in this document, the Company does not assume any responsibility for the accuracy or completeness of such information and which has not been independently
verified by the Company. Except where otherwise indicated herein, the information provided in this document is based on matters as they exist as of the date of preparation
and not as of any future date, and will not be updated or otherwise revised to reflect information that subsequently becomes available, or circumstances existing or changes
occurring after the date hereof.

Forward-looking statements

This document contains forward-looking statements, which are subject to risks and uncertainties because they relate to expectations, beliefs, projections, future plans and
strategies, anticipated events or trends, and similar expressions concerning matters that are not historical facts. Such forward-looking statements involve known and unknown
risks, uncertainties and other factors, which may cause the actual results, performance or achievements of the Group or the industry in which it operates, to be materially
different from any future results, performance or achievements expressed or implied by such forward-looking statements. The forward-looking statements speak only as at
the date of this document. The Group will not undertake any obligation to release publicly any revision or updates to these forward-looking statements to reflect future
events, circumstances, unanticipated events, new information or otherwise except as required by law or by any appropriate regulatory authority.

THIS DOCUMENT DOES NOT CONSTITUTE OR FORM PART OF ANY OFFER FOR SALE OR SUBSCRIPTION OR SOLICITATION OF ANY OFFER TO PURCHASE OR SUBSCRIBE FOR
ANY SECURITIES NOR SHALL IT OR ANY PART OF IT FORM THE BASIS OF OR BE RELIED ON IN CONNECTION WITH ANY CONTRACT OR COMMITMENT TO PURCHASE OR
SUBSCRIBE FOR ANY SECURITIES

                                                                                                                                                                          2
Agenda

Introduction                         4

Financial Highlights                 9

Portfolio & Asset Management         17

Summary & Outlook                    26

            Jonathan Laredo               Charles Peach            Michael Gibbons
            Chief ExecutiveOfficer        Chief FinancialOfficer   Chief InvestmentOfficer

                                                                                       3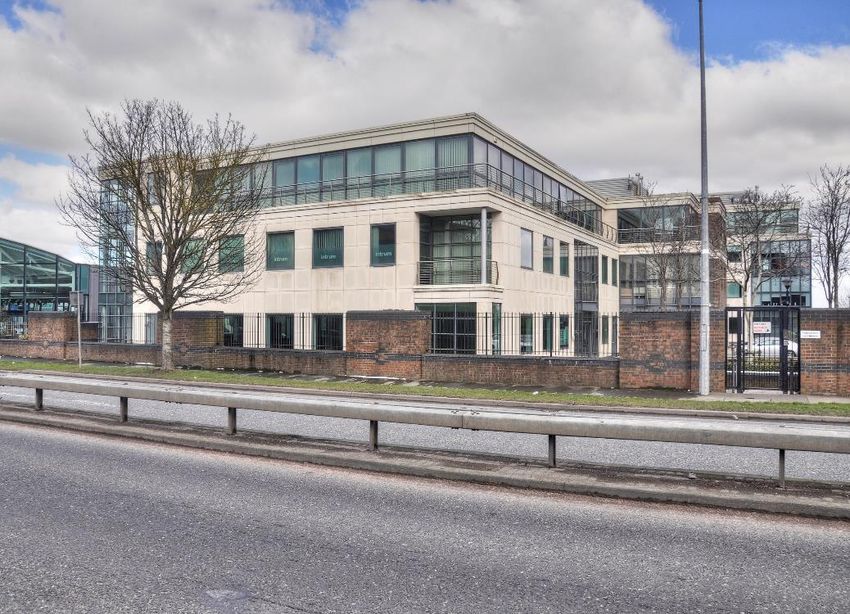
SECTION 1

Introduction

               4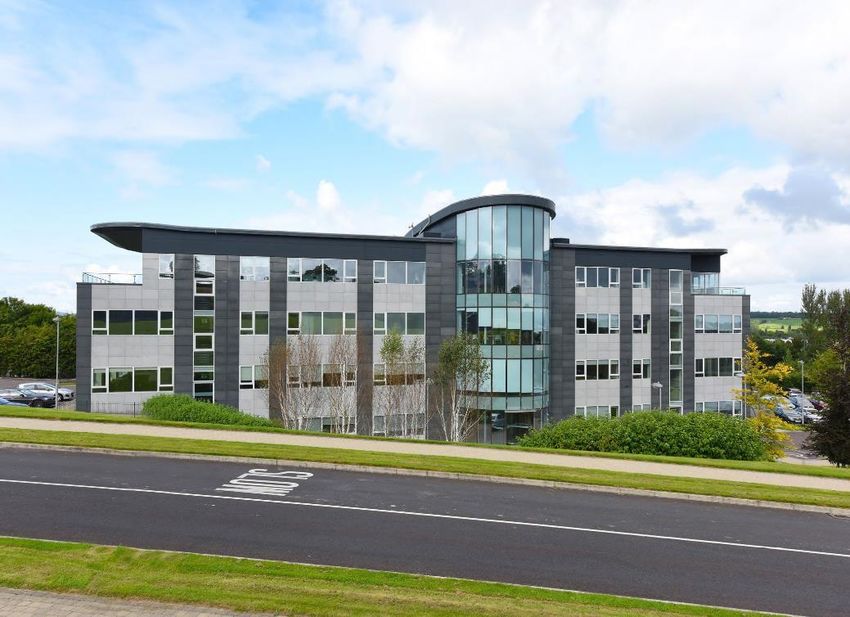
2019 highlights
A year of growth

✓     Value of investment properties increased 49% to €115.8m (€141.2m including Millennium Park which completed post year end)

✓     NAV per share of 98.5c (after 4.2c acquisition and share issuance costs)

✓     Current rent roll of €8.9m, with an ERV of €10.1m (€10.6m and €12.7m respectively including Millennium Park)

✓     Total dividend for FY19 of 6.75c per share, even with 48% increase in share count diluting H2 dividends

✓     100m share issuance programme established, 36.6m shares placed to fund acquisitions

✓     New equity raised was committed within 2 weeks

✓     Entering 2020 with acquisition pipeline of over €120m

                                                                                                                                  5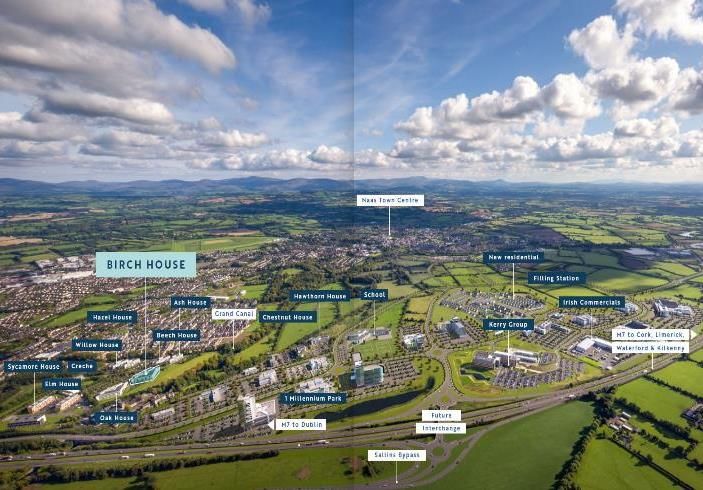
Yew Grove
Only REIT specialising in commercial property outside of Dublin CBD

 Supportive market backdrop                                                              Investment Strategy
 ✓ Ireland was the fastest growing economy in Europe in 2019 1                           ✓ Good quality income from a portfolio of Irish commercial real estate in
                                                                                           select locations outside Dublin’s CBD
 ✓ Approx. 50% of recent FDI job creation has been outside Dublin2 – Project
   Ireland 2040 supports targeted regional growth                                        ✓ Focus on office and industrial assets
 ✓ Dublin CBD rents have exceeded pre crisis highs, elsewhere rents                               ✓ High quality tenant list: Irish government entities, state bodies,
   are mostly still below the level required to trigger construction                                large enterprises, IDA Ireland supported and other FDI
   and are rising, driven by a supply demand mismatch                                               companies
 ✓ Opportunities to acquire assets at levels significantly below                                           ✓ Active asset management to drive value
   replacement cost                                                                                        ✓ Internally managed REIT with shareholder alignment:
                                                                                                             4% of equity held by management

  Active growth plan                                                                                   Attractive opportunity & pipeline
                                                                                                       ✓ Ex-CBD market is very significant, c. €13bn
 ✓ Raised €111.5m in equity and €49.1m3 in debt since
   June 2018 IPO                                                                              ✓ Competition for assets is growing but the market is still
                                                                                                institutionally under invested and available yields are still
 ✓ Ongoing 100m share issuance programme from July
                                                                                                attractive
   2019 of which c. 63m still to be issued.
                                                                                              ✓ Market recovery and end of CGT exemption means that many
 ✓ Attractive pipeline of available assets to continue to scale
                                                                                                owners want to redeploy capital into their businesses by selling
   the business
                                                                                                properties
                                                                                              ✓ Yew Grove has a high profile with property owners and agents
                                                                                                for transacting efficiently

 1 – Source: Goodbody
 2 – IDA data, 2013 to 2018. Approx 58% of FDI job creation in 2018 was outside Dublin
                                                                                                                                                                     6
 3 – Increase in debt facility announced on 3 March 2020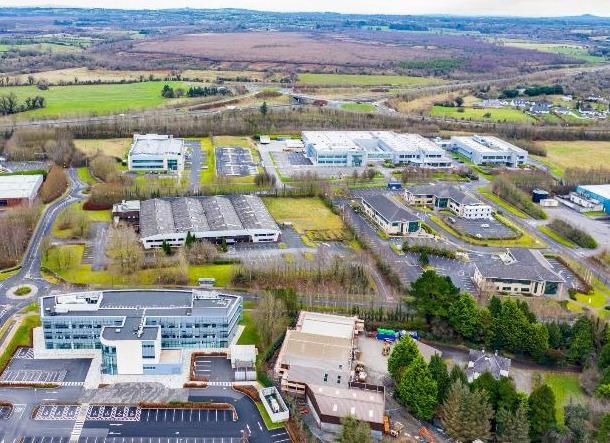
Strong fundamental backdrop
The opportunity for Yew Grove remains significant
 Strong FDI inflows continue…                                                                                   …with an equal share between Dublin and ex-Dublin1

                                                                                          10,125
                                                              9,455
   New IDA job announcements

                               8,690                                                                 8,994
                                                                                 8,436

                                                                                                                    Location of inflows
                                                    6,718              6,759
                                         5,901                                                                                              Ex-Dublin
                                                                                                                                               49%

                                                                                                                                                                                      Dublin
                                                                                                                                                                                       51%

                               2012          2013    2014     2015     2016       2017     2018          2019

Non CBD rents are still significantly below replacement cost                                                    and vacancy and take up rates reflect a healthy market

                                                                                                                ▪                         Vacancy rates across the country are at multi-year lows, with
                                       €45                                                                                                larger floor plate, Grade A (and equivalent) with higher take
+50%
                                                                                             €33                                          up/lower vacancy
                                                                               +8%
                                                                 €25
                                                    +25%
                                                                                                                ▪                         In the principal IDA parks there is virtually no vacancy
                                       €30                                                   €30
                                                                 €20
                                                                                                                ▪                         Across the regional cities, the major shift is from
                                Dublin Core+                   Regional                  Regional city
                                                                                                                                          secondary buildings into larger Grade A space, with an
                                                                                                                                          increase in specific take up
                                               Current €psf               €psf required to
                                                                          trigger construction

  Source: IDA, Goodbody
                                                                                                                                                                                                      7
  1. Average split of job announcement between Dublin and ex-Dublin since 2012
Significant opportunity outside Dublin CBD
Income investors underinvested relative to the opportunity
Investors in Irish market under allocated outside CBD                                                                      Partly because provincial lot sizes are smaller

                                          30
      % Allocation in average portfolio

                                                                                                                                  Office - Dublin 2                                                €45.2m
                                          25
                                          20                                                                                Office - Central Dublin                                            €43.1m
                                          15
                                                                                                                            Office - Dublin 1 3 & 7                                       €38.3m
                                          10
                                          5                                                                                       Office - Dublin 4                     €24.2m

                                          0
                                                                                                                                Office - Provincial            €15.1m

                                                                                                                            Office - Rest of Dublin       €10.0m
                                               Total Provincial      Office - Outside Dublin CBD    Industrial - Dublin

Target market is vast and under serviced                                                                                   Keeping yields high relative to Dublin CBD

                                                       13.8                               13.7
                                                                                                                                    Office - Provincial                                             6.6%

                                                                                                        Irish industrial
                                                                                            5.2                                 Office - Rest of Dublin                                     6.0%
                                                                                                            market
   Value €bn

                                                                                                                                      Office - Dublin 4                            5.3%

                                                                                                        Non-Dublin CBD
                                                                                            8.5                                Office - Dublin 1 3 & 7                           5.1%
                                                                                                         office market

                                                                                                                               Office - Central Dublin                    4.5%
                                                 Dublin CBD office                    Yew Grovetarget
                                                      market                              market
                                                                                                                                      Office - Dublin 2                  4.4%

Source: Goodbody, MSCI, Cushman & Wakefield                                                                                                                                                           8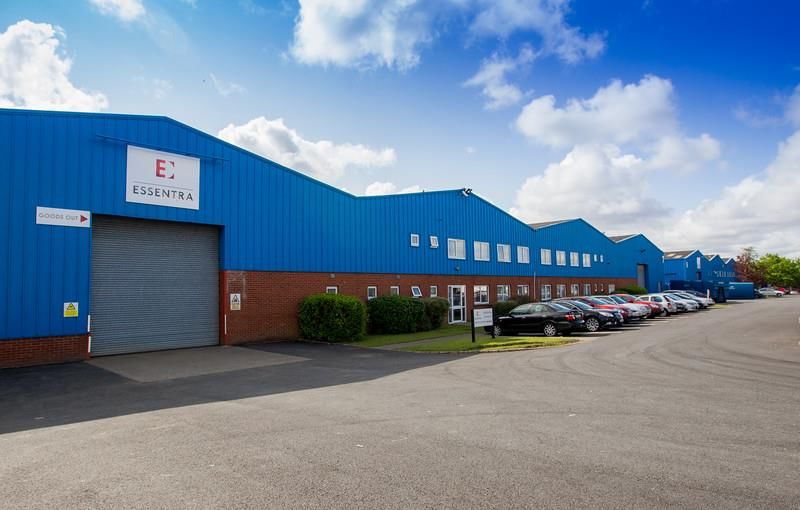
SECTION 2

Financial Highlights
Portfolio and income growth in 2019
Increasing portfolio operational leverage driving earnings growth
                                                                        Property value €m
▪   Property portfolio grew by €38 million (+49%) over the year                                                      €115.8
    from €77.9 million to €115.8 million                                                              €90.5
                                                                                 €77.9

▪   The Millennium Park acquisition increases this to €141.1 million
    (+22%)
                                                                              End Dec 2018        End June 2019   End Dec 2019

                                                                        Annualised rent roll €m
▪   Contracted rental roll grew by €2.6 million (+42%) over the year,                                                 €8.9
    from €6.3 million to €8.9 million                                                                 €7.5
                                                                                  €6.3

▪   The Millennium park acquisition brings this to €10.6 million
    (+19%)
                                                                              End Dec 2018        End June 2019   End Dec 2019

                                                                        Administrative costs €m
▪   Administrative costs excluding financing were similar to 2018 in             €1.8                 €1.8
    H1, falling to 67% of that amount in H2
                                                                                                                      €1.2

▪   The Millennium Park acquisition is expected to increase costs by
    substantially less than the 19% increase in rent roll
                                                                             End Dec 2018     End June 2019       End Dec 2019

                                                                                                                                 10
NAV per share movements
EPRA EPS distributed, valuation growth supporting NAV
Equity issue and Acquisition costs
reduced NAV by 4.19c
▪ Due to share issuance costs of 1.27c and property purchase costs of 2.92c, NAV per share ended the year 1.77c lower
▪ Like-for-like portfolio value increased by 2.9c, driven by active asset management across the portfolio
11Earnings
Increased revenue and improved operating leverage increased earnings
▪ The 2019 EPS of 6.23c follows 2018 EPS of 4.1c (unweighted 3.1c)*
▪ The Company’s annualised rental income increased by 42% from 2018 and a lease surrender was negotiated increasing revenue, while costs
remained under tight control
▪ Finance costs remained light, as the Company’s revolving debt facility was partially undrawn during the period. The LTV was 18% end Dec 2019
* 2018 reported EPS of 4.1c is calculated on the weighted average amount of shares in issuance, in the period from April 201 8 to June 2018(IPO) there were no paid up shares in issue. The figure of 3.11c used is calculated on
the shares in issue from IPO to Dec 2018 (operational period). 12Dividends
Distribution of 98% of EPRA EPS
3.23
1.86
Cents per share
1.37 1.38 1.47
0.96 1.1 1.04
2018 Q1 2019 Q2 2019 Q3 2019 Q4 2019 Undiluted Q4 div
▪ The Company paid a dividend for 2018 and the first 3 quarters of 2019 in the year, followed by a dividend of 1.04c for Q4 2019 in February 2020.
This equates to 98% of EPRA EPS
▪ Dividends paid for 2019 were 6.75c per share, including a special dividend of 1.86c related to a lease surrender. The Q4 dividend was diluted by
the issuance of an additional 31% of shares in December 2019. Without the dilution of the late Q4 share issuance, the 2019 dividend would
have been 7.08c
* 2018 reported EPS of 4.1c is calculated on the weighted average amount of shares in issuance, in the period from April 2018 to June 2018(IPO) there were no paid up shares in issue. The figure of
3.11c used is calculated on the shares in issue from IPO to Dec 2018 (operational period).
13Summary balance sheet
Equity and debt capital deployment
Balance sheet (€’m) At 31 Dec 2018 At 31 Dec 20191 Change
Investment properties 77.92 115.79 49%
Cash and cash equivalents 4.82 14.57 202%
Debt 5.84 20.40 249%
Other Asset/(Liabilities) (1.77) (0.04) 3%
Total equity 75.13 109.92 46%
IFRS NAVPS (cents) 100.18 98.52 (1.7)%
EPRA NAVPS (cents) 100.18 98.52 (1.7)%
Capital split as at 31 December 2019 Capital raised in 2019 Capital deployed in 2019
Total Debt Debt Equity Capital raised in 2019 35.8
€20.4 €9.1m
Debt capital raised in 2019 9.1
Total Equity Equity Capital deployed in property
€109.9m €35.8m 39.3
purchases in 2019
1Please note that the 31 Dec 19 figures are unaudited and may change as part of the audit process
14Summary income statement
Greater revenues have increased net income and dividends paid
Income statement (€’m) IPO to 31 Dec 2018 12 months to 31 Dec Change
(6.5 months) 20191
Revenues include €2m of lease surrender
Total Revenue payments from the Cork Airport property.
Excluding lease surrender payments, the
Rental Income 2.76 7.95 +188%
Company’s revenue was an increase of
Lease surrender income 0.00 2.00 188% on 2018, or +52% annualised
Property Expenses (0.20) (0.53) +165%
Net Rental Income 2.56 9.42 +267%
Over the period the Group paid costs of
Gains on investment properties 1.61 (0.65) €2.8m purchasing properties
Total income 4.17 8.77 +110%
Administration expenses excluding variable
Administration and AIFM 1.81 2.41 +33% remuneration:
o 2019 €2.41m for 12 months; and
Variable remuneration 0.00 0.63
o 2018 €1.8m for 6.5 months
Goodwill (0.06) 0.00
Finance costs 0.02 0.67 +3200%
Of the €5.8m of net rental income (having
Total Expenditure 1.83 3.71 +103%
excluded lease surrender dilapidations and
valuation adjustments) for the period, 98%
Profit for the period 2.33 5.06 +117% has been distributed via ordinary and
special dividends
Total comprehensive income 2.73 5.06 +60%
101% EPRA EPS dividend cover. EPS is
Basic EPS (cents) 4.08 6.23 +53%
calculated on WA shares over the year,
EPRA EPS 1.26 7.03 +458% dividends were paid on the shares
outstanding on specific dates
Dividends declared for period 0.96 6.75 +603%
1Please note that the 31 Dec 19 figures are unaudited and may change as part of the audit process
15Reversionary potential in portfolio
Under-rental provides future revenue opportunities
ERV progression
€13.0m
▪ The portfolio is reversionary and rent levels are still rising in €12.5m
areas where the buildings are situated €12.0m
+21.3%
€11.5m +15.1%
▪ At today’s ERV the portfolio rent roll should increase by 6.4%
(EUR 674k) over the next four years. If rents continue to rise €11.0m
this number should also increase. €10.5m
€10.0m
▪ The portfolio has vacancy in its Cork Airport, Mallow and
€9.5m
Millennium properties. As that vacancy is let the rent roll
should rise by c.15.1% (€ 1.59 m) €9.0m
€8.5m
▪ The company is in discussion with a number of prospective
€8.0m
tenants to fill the vacant space
€7.5m
€7.0m
Mar 2020 Rent roll with ERV reversion
Jun 2019 Rent roll with ERV reversion June
Mar 2020 Current rent roll
Jun 2019 Current rent roll
16SECTION 3
Portfolio &
Asset Management
17Overview of current portfolio
Portfolio value
€141.1m Letterkenny2 (1) Dublin
Lettable Space
847,256 sq ft
Number of
buildings
Airways
27 7+8
Athlone (5)
Vacancy rate Dublin (15)
Ashtown
10.5% B,C
Value of investment Tullamore (1) Gateway
Centrepoint
properties in Dublin 1,3
€78.5m Portlaoise (1)
Government and Holly Avenue
Listowel (1)
FDI tenants Naas
Waterford (1)
92.5%
Cork (2)
Acquisitions in
20191
(12 buildings)
€66.7m
1 – Including Millennium
2 - Letterkenny is treated as one business park but comprises 3 buildings 18
Figures as at 01/03/2020High quality diversified portfolio
Overview of current portfolio Key tenant overview
▪ Number of tenants: 42 % of annual
Company Sector Nationality
rent roll
▪ WAULT lease end: 7.50 years
▪ WAULT break: 4.15 years 13.6% Life Sciences USA
▪ Rent roll of €10.59 m
Ireland
13.0% Energy
▪ 51% of rent roll is the Dublin catchment area (Government)
▪ 49% of rent roll in the regions 9.6% Life Sciences USA
▪ Yield to company: 7.5%
▪ Reversionary yield: 9.1% 8.9% Life Sciences USA
Tenant profile1 Ireland
7.8% Government
(Government)
SME
4.7%
Government 5.5% Consumer USA
27.0%
Financial
3.6% USA
Services
FDI / Large 3.1% Technology Germany
enterprise
68.3%
3.0% Packaging UK
1. As a percentage of Revenue as at 01/03/2020
Source: Goodbody, MSCI, Cushman & Wakefield
19Our approach to portfolio & asset management
1 Yew Grove buys well …
2 … then actively asset manages and improves our properties
3 … always attracted to improving and expanding locations
4 … always engaging with our client/tenants to assist their growth
5 … while managing our pipeline to deploy new capital consistently and rapidly
20Yew Grove consistently buys well
Units 7 & 8 Airways Industrial Park, Dublin Airport
▪ Large industrial
▪ Well located close to Dublin airport
▪ Fully let to Essentra Packaging Ireland Ltd
▪ Current annualised total return in excess of 30%
▪ Under rented with large reversionary potential
▪ Step up rents improved rental levels by 6.6%
▪ Rent Reviews in 2020/21 expected uplift of 90%
Acquisition Gross Yield: Size:
Price: €3.8m 7.9%* 87,963 sq ft
Tenant:
Value: y/e Occupancy:
Essentra
€5.21m 100%
Packaging
* Rent at acquisition, divided by acquisition price at IPO
21Driving value through active asset management
Ashtown Gate
▪ Two offices in a 4-block estate, located in Dublin 15 close to M50
▪ Bought in August 2016 with immediate asset management plan
▪ Vacancy (for 15 years) was filled by the OPW
▪ Carpark spaces re-let to tenants at higher rents
▪ Rent review achieved better than ERV
▪ The passing rent has increased from €715k to €778k
▪ Annualized return to Yew Grove exceeds 18% p.a
Acquisition
Gross Yield: Size:
Price:
8.1%* 33,149 sq. ft
€8.8m
Tenants:
Value: y/e Occupancy:
Multi
€10.1m 100%
tenanted
* Rent at acquisition, divided by acquisition price at IPO
22Yew Grove’s portfolio includes properties in improving areas
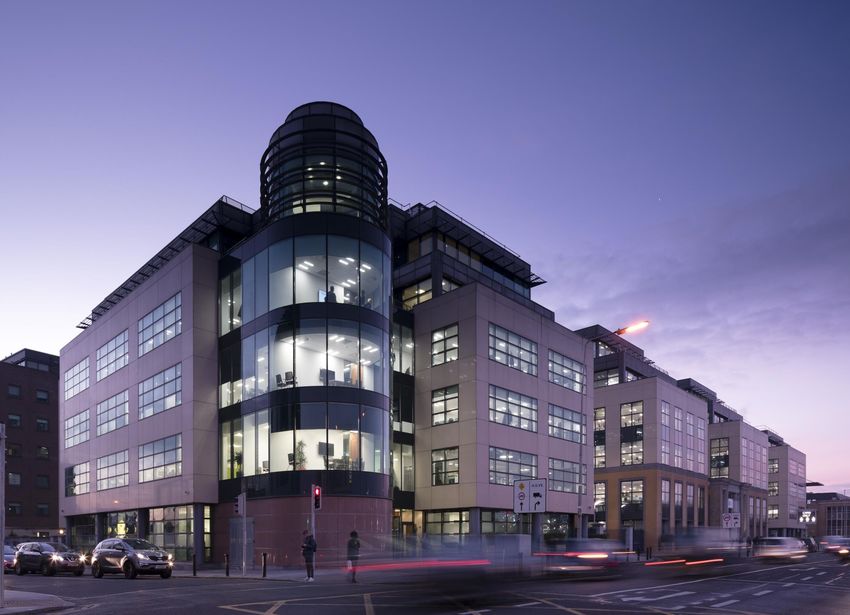
Gateway Buildings
▪ Gateway One and Three office buildings bought post IPO
▪ The market considered the location suburban and preferred East Point
Business Park
H
▪ Yew Grove saw a significant opportunity considering transport links,
E G F
distance from North (Silicon) Docks, and planned developments of
both apartments and offices C
Key:
A - Gateway Buildings
▪ Post acquisition the owners of the distressed Beckett building B - Port Tunnel
completed a refurbishment, which was then let to Facebook and D A
C - Beckett Building - Facebook
D - Eastpoint
subsequently sold at a 4.6% yield E - North Dock develop.
F - IFSC
B G - Conference Centre
H - Google
▪ Asset management to date
o 2018 Rent review at €27.50 psf Acquisition
Gross Yield: Size:
Price:
o 2019 letting of vacant floor at €32.50 psf 7.1%* 94,709 sq. ft
€29m
o 2019 car park reorg added 27 spaces
o 2019 car rents increased to €1,250 pcs Tenants:
Value: y/e Occupancy:
ESB &
o 2020 - Potential re-gear and fundamental revaluation €33.5m 100%
Others
* Rent at acquisition, divided by acquisition price
23Yew Grove is committed to tenants that are expanding their operations
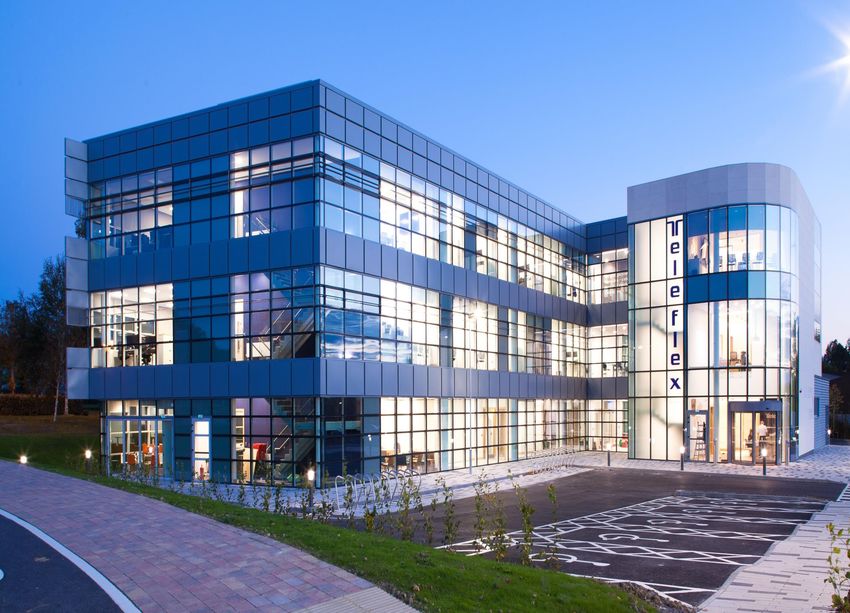
IDA Business & Technology Park, Athlone
▪ Maintaining close contact with senior management to identify new
opportunities
G
▪ Many FDI tenants are expanding their operations and require an
engaged, well capitalized landlord. B D E F
C
▪ Constructed a new car park in 2019
▪ Engaged with tenants for two current medium-term projects Key:
• A - Teleflex
A • B - PPD
▪ Aiding a tenant to accommodate a significant expansion in 2020: • C - KCI Carpark
• D - KCI Building 1
• E - KCI Building 2
o Temporary office and canteen solution; • F - Signature
• G - M6 Motorway interchange
o 30,000 sq. ft new office extension; and
o New 175 space carpark
▪
Acquisition
Aiding another tenant in 2020 to create a new campus involving: Gross Yield: Size:
Price:
o expansion into an underutilized adjacent building; 8.4%* 206,514 sq ft
o building a new warehouse and re-site the original car park;
€29m
o constructing a new car park; and
o improvements to the power and water
Tenants:
Value: y/e Occupancy:
Teleflex,
€29.5m 100%
KCI, PPD
* Rent at acquisition, divided by: acquisition price (for buildings A, B, E & F) and acquisition price at
IPO (for building D and car park C)
24Yew Grove manages its pipeline to effectively deploy capital
Millennium Park
▪ The Park has been tracked by Yew Grove since IPO
▪ The completion of the M7 motorway and the new Millennium Park
interchange made the investment case compelling
▪ Discussed the purchase with the vendor during our Q3 equity
roadshow
▪ Agreed an exclusive, off-market transaction, because of our proven
ability to execute quickly
▪ Exchanged 2 weeks after the equity drawdown
▪ Completed 6 weeks later having identified potential tenants for the
vacant property (Birch House)
▪ Reversionary potential in excess of 9% Acquisition
Gross Yield: Size:
Price:
6.3% 140,000 sq ft
€25.3m
Tenants:
Occupancy: Value: y/e
Multi-
c. 70% €25.3m
tenanted
* Rent at acquisition, divided by acquisition price
25SECTION 4
Summary & Outlook
Classified as ConfidentialSummary & Outlook
▪ In 2019 the Company showed its ability to deploy new equity and debt capital quickly and efficiently and increased the portfolio value by 48%
▪ All new equity was deployed or committed within 2 weeks of the capital being raised
▪ Despite this growth, administrative costs for 2019 ran at a similar rate to the annualised costs for 2018
▪ As the Company grows, the increased scale should result in operational efficiency, with revenue rising faster than costs, improving ratios and
shareholder returns
▪ Moreover, the Company’s portfolio is reversionary, and that reversion is improving and will improve earnings per share and distributable income.
▪ As the Company’s profile has improved, our pipeline has increased - principally ‘off-market’. The current pipeline is over €120 million excluding
transactions already in train. This reinforces our analysis of the market opportunity and underpins our stated aim to grow to at least a €300-500
million market capitalisation during 2021.
▪ In July 2019 shareholders approved a 100 million share issuance programme, of which 36.6 million shares have been issued. Approval for the
remainder expires in July 2020
27About Yew Grove
Proven management team supported by vastly experienced non-executive directors and advisers
• Over 30 years’ experience in investment markets, including running the • Previously Senior Vice President of IDA Ireland
European and Asian structured finance business at JP Morgan acting as Global Head of two key operating
• Previous owner and director of the Pepper Group, an Australian divisions
based mortgage lender and servicer which built the largest third- • Member of the Institute of Directors of Ireland
party servicing business in Ireland • Qualified Barrister at Law from University
• Co-Founder of the Yew Tree Fund, the Company’s seed Portfolio College Dublin & Kings Inns
Jonathan Laredo • Sits on the Company’s Investment Committee Barry O’Dowd
Chief Executive Officer Non-executive Chairman
• Over 25 years’ experience in investment markets, structuring • Former Finance Director of Irish Continental
and raising capital for companies and funds Company plc (“ICG”) for 27 years
• Previously a member of the Financial Analytics and Structured • Prior to joining ICG, he worked in a number of
Transactions Group at Bear Stearns, before developing and financial roles at CRH plc. Mr O’Dea is
running managed vehicle issuance and risk management currently an independent trustee of the RTE
programmes at Nomura Garry O’Dea Superannuation Scheme
• Co-Founder of the Yew Tree Fund Independent Non-executive • Qualified Chartered Accountant
Charles Peach
• Sits on the Company’s Investment Committee Director, Senior • Chairs the Audit Committee
Chief Financial Officer
Independent Director
• Over 31 years’ experience in investment markets spanning high • Previously a Senior Fund Manager at Zurich
yield, distressed debt and real estate businesses Life Assurance Ireland plc where she had
• He started his career in corporate finance at Bankers Trust, responsibility for equity and regional asset
followed by Sumitomo Finance, Commerzbank, BNP Paribas, allocation
Aladdin Capital Management LLP • Currently NED of Hostelworld Group plc
• Co-Founder of the Yew Tree Fund • Qualified Chartered Accountant
Eimear Moloney • Chairs the Remuneration Committee
Michael Gibbons
Independent Non-
Chief Investment Officer
executive Director
• Prior Chairman and Chief Executive of Hardwicke
• Significant Board and property experience as Chairman of Great
Property Group for 18 years currently Partner in
Portland Estates, Deputy Chairman of the supervisory board of
Beresford Real Estate
Alstria Office REIT-AG, Senior Advisor to TPG Real Estate LLC and
• A 30-year veteran of the Irish real estate
previously served as NED at Standard Life Aberdeen, and a Senior
industry, prior to which he was at Deloitte
Independent Director at St Modwen Properties, ISG and Hansteen
• Fellow of the Chartered Accountants Ireland
Holdings
• Member of the Society of Chartered Surveyors
Richard Mully • 12 years’ banking experience in property at County Bank and Brian Owens Ireland and the Royal Institution of Chartered
Adviser to Bankers Trust Independent Non- Surveyors
management team • 13 years as a principal real estate investor with Soros Real Estate executive Director • Chairs the Valuation Committee
28Geographic overview of existing assets
Reversionary Gross WAULT to WAULT to
Current Rent Gross Yield at Fair Portfolio
Building Type Location Value (€'000) Rent Roll Reversionary lease break lease end
(€'000) Value vacancy
(€'000) Yield (years) (years)
1 One Gateway Office Dublin 19,000 1,306 6.9% 1,491 7.8% 1.8 4.1 0%
2 Letterkenny Office North West 15,755 1,437 9.1% 1,458 9.3% 8.1 8.1 0%
3 Three Gateway Office Dublin 14,460 913 6.3% 1,188 8.2% 1.8 1.8 0%
4 Teleflex Office Midlands 11,610 948 8.2% 851 7.3% 8.6 11.6 0%
5 Unit 2600, Cork Airport Office Cork 6,200 0 0.0% 633 10.2% 0.0 0.0 100%
6 IDA Athlone Block B Industrial Midlands 6,175 530 8.6% 530 8.6% 3.0 13.0 0%
7 Ashtown Gate Block C Office Dublin 5,140 391 7.6% 401 7.8% 4.0 5.8 0%
8 IDA Athlone Unit B2 Industrial Midlands 5,050 483 9.6% 483 9.6% 3.5 14.5 0%
9 Ashtown Gate Block B Office Dublin 4,915 405 8.2% 380 7.7% 2.9 9.2 0%
10 IDA Waterford Block A Office South East 4,100 353 8.6% 424 10.3% 4.0 14.9 0%
11 IDA Athlone Block A Industrial Midlands 3,500 250 7.1% 312 8.9% 1.0 10.9 0%
12 IDA Athlone Block C Industrial Midlands 3,150 280 8.9% 253 8.0% 4.6 9.6 0%
13 Blackwater House Office Cork 2,750 233 8.5% 313 11.4% 1.3 4.4 30%
14 Airways Unit 8 Industrial Dublin 2,740 160 5.8% 280 10.2% 5.9 10.9 0%
15 Airways Unit 7 Industrial Dublin 2,470 160 6.5% 248 10.0% 5.3 10.3 0%
16 Bridge Centre Retail Midlands 1,840 229 12.5% 181 9.8% 1.2 1.8 14%
17 Holly Avenue Industrial Dublin 1,835 170 9.3% 187 10.2% 0.9 7.9 0%
18 Unit L2 Toughers Industrial Dublin Catchment 1,815 170 9.4% 201 11.1% 3.0 3.0 0%
19 Old Mill Lane Mixed Use South West 1,500 302 20.1% 176 11.7% 6.7 8.6 0%
20 Canal House Mixed Use Midlands 930 107 11.5% 53 5.7% 6.8 6.8 0%
21
Centre Point Industrial Dublin 855 110 12.9% 51 6.0% 6.5 6.5 0%
22
Ash Hse, Millennium Park Office Dublin Catchment 3,340 326 9.7% 364 10.9% 1.3 6.3 0%
23
Beech Hse, Millennium Park Office Dublin Catchment 2,285 222 9.7% 243 10.6% 2.9 7.0 0%
24
Birch Hse, Millennium Park Office Dublin Catchment 6,325 0 0.0% 746 11.8% 0.0 0.0 100%
25
Chestnut Hse, Millennium Park Office Dublin Catchment 6,460 508 7.9% 645 10.0% 2.5 3.7 2%
26
Hazel Hse, Millennium Park Office Dublin Catchment 3,530 341 9.7% 365 10.3% 3.6 5.2 0%
27
Willow Hse, Millennium Park Office Dublin Catchment 3,360 259 7.7% 350 10.4% 4.3 5.2 0%
Total 141,090 10,592 7.5% 12,804 9.1% 4.1 7.5 11.9%
29You can also read