Making Life More Beautiful Worldwide. - INVESTOR PRESENTATION Q2FY21 - AGL Tiles

Page created by Adrian Johnston
 
CONTINUE READING
Making Life More Beautiful Worldwide. - INVESTOR PRESENTATION Q2FY21 - AGL Tiles
Making Life More
Beautiful Worldwide..

Asian Granito India Ltd.
 INVESTOR PRESENTATION
 Q2FY21
Making Life More Beautiful Worldwide. - INVESTOR PRESENTATION Q2FY21 - AGL Tiles
TABLE OF CONTENTS
  o RESULTS SUMMARY Q2FY2021 & 6MFY2021……………………………………………. 03
  o OVERVIEW – TILES, QUARTZ SLABS AND BATHWARE………………….……………. 10
  o AGL PLANT LOCATIONS…………………………………………………………………………….. 13
  o WORLD CERAMIC MARKET AND LEADERS………………………………………………… 15
  o AGL PRODUCT PORTFOLIO …………………….………………………………………………… 16
  o AGL MANUFACTURING CAPABILITIES ….………………………………………………….. 17
  o AGL TODAY……………………………………………………………………………………………….. 18
  o ENHANCING STAKEHOLDERS VALUE – SWASTIK………………………………………… 19
  o AGL YEARLY CONSOLIDATED FINANCIALS…………………………………………………. 20
  o AGL GROWTH DRIVERS & STRATEGIES……………………………………………………… 22
  o CLIENTS……………………………………………………………………………………………………. 24
  o AWARDS & RECOGNITIONS………………………………………………………………………. 27
  o AGL – CORPORATE STRUCTURE AND SHAREHOLDING………………………………. 28
  o AGL MILESTONES……………………………………………………………………………………… 29

Investor Presentation                                              Previous   2   Next
Making Life More Beautiful Worldwide. - INVESTOR PRESENTATION Q2FY21 - AGL Tiles
Q2 & 6M-FY2021 PERFORMANCE HIGHLIGHTS

  1) With the easing of restrictions during the last few months, your company witnessed gradual demand pick up from rural and Tier 2,3 cities. As a result, the
     company has witnessed sharp increase in volume growth. The overall volume growth for the quarter stood at 7% Y-o-Y

  2) EBITDA margins for the quarter have increased by 367 bps as compared to Q2FY20. EBITDA Margins growth was driven by several cost cutting measures,
     lower power and fuel cost, lower overhead expenses, a favorable demand-supply in the domestic market and continued focus on exports

  3) The demand from exports continues to be the front runner for your company. Export contributed 16% of total revenues. AGL Export House a 15,000 Sq. Ft.
     hub recently launched at Morbi shall cater to the demand from the overseas markets

  4) Our average manufacturing capacity utilizations for the quarter stood at 86%

  5) The company was able to strengthen its balance sheet during the quarter and have reduced its working capital cycle to 77 days owing to reduction in
     inventory levels

  Outlook:
  The company’s products are doing well in both domestic and international markets, backed by the high utilization levels and an increasing demand. From this
  viewpoint, things look optimistic and it seems the target for this year will be achieved. The anti-China sentiments growing in the market are advantageous for
  your Company. As a result, we have capitalized on the demand from export markets and increased our market share. For providing better and faster service to
  the overseas market, AGL has launched an Export House which has all our product offerings. Our attitude for the coming quarters continues to be aggressive
  with a focus on providing more value-adding products. We will continue to march towards new geographies to gain foothold and improve our brand presence.

Investor Presentation                                                                                                                                  Previous   3   Next
Making Life More Beautiful Worldwide. - INVESTOR PRESENTATION Q2FY21 - AGL Tiles
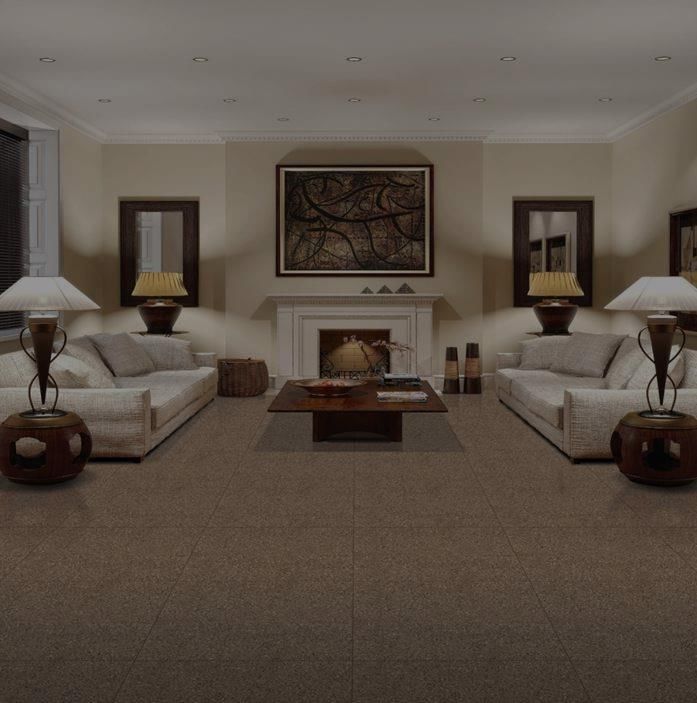
AGL - CONSOLIDATED RESULTS SUMMARY Q2-FY2021

                          Revenues (Rs. in Crores)                        EBITDA (Rs. in Crores)                                  PAT (Rs. in Crores)

                                                                                             41.8                                                       19.8
      360
                        356.9
      355

      350

                                              344.3                   30.3
      345
                                                                                                                       12.6
      340

      335

      330

      325

      320

      315

      310

                    Q2FY20                    Q2FY21                 Q2FY20                 Q2FY21
                                                                                                                      Q2FY20                          Q2FY21

   Segmental Revenues (Rs. in Crores)

                                            Tiles      Composite Marble       Quartz Slab            Power Grace   Bathware Division                     Others

              Q2-FY2020                    247.4             29.8                69.1                    3.2                  -                              7.4

              Q2-FY2021                    284.5             21.0                21.8*                   4.3              6.2                                6.5

            % Growth Y-o-Y                  15.0            -29.5                -68.5                  34.4             100.0                             -12.2
                                                                                                                                            *Excluding revenues from Camrolla Quartz

Investor Presentation                                                                                                                                            Previous    4     Next
Making Life More Beautiful Worldwide. - INVESTOR PRESENTATION Q2FY21 - AGL Tiles
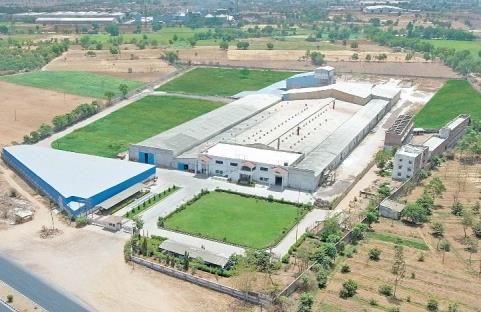
AGL – CONSOLIDATED RESULTS SUMMARY 6M-FY2021

                         Revenues (Rs. in Crores)                       EBITDA (Rs. in Crores)                                         PAT (Rs. in Crores)
     850 .0

                                                                    65.4
     800 .0

     750 .0

                        668.9
     700 .0

     650 .0
                                                                                                                   25. 0
                                                                                                                                23.8
     600 .0

     550 .0

                                             473.7                                           45.8                  20. 0

     500 .0

     450 .0

     400 .0

     350 .0
                                                                                                                   15. 0

                                                                                                                                                               12.3
     300 .0

                                                                                                                   10. 0

     250 .0

     200 .0

                                                                                                                    5.0
     150 .0

     100 .0

      50. 0

                                                                                                                    0.0

       0.0

                    6MFY20                  6MFY21                 6MFY20                   6MFY21                            6MFY20                        6MFY21

  Segmental Revenues (Rs. in Crores)

                                         Tiles       Composite Marble        Quartz Slab             Power Grace           Bathware Division                   Others

               6M-FY2020                 468.3             51.5                  131.0                   5.9                       -                              12.2

               6M-FY2021                 396.8             26.6                  27.8*                   5.8                      8.2                              8.4

              % Growth Y-o-Y             -15.3            -48.3                  -78.8                  -1.7                     100.0                           -31.1

                                                                                                                                                   *Excluding revenues from Camrolla Quartz

Investor Presentation                                                                                                                                                   Previous    5     Next
Making Life More Beautiful Worldwide. - INVESTOR PRESENTATION Q2FY21 - AGL Tiles
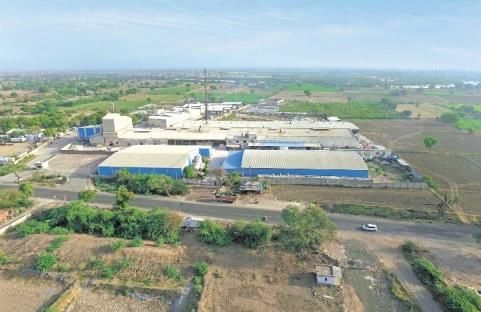
AGL - PROFIT & LOSS FOR Q2 & 6M – FY2021
                                AGL Consolidated                      AGL Standalone                                         AGL Consolidated                     AGL Standalone
        Particulars               Rs. In Crores                        Rs. In Crores                 Particulars               Rs. In Crores                       Rs. In Crores
                        Q2–FY2020 Q2–FY2021      Y-o-Y %     Q2–FY2020 Q2–FY2021     Y-o-Y %                         6M–FY2020 6M–FY2021      Y-o-Y %    6M–FY2020 6M–FY2021     Y-o-Y %

 Total Sales                356.9       344.3         -3.5       289.2      277.7         -4.0   Total Sales             668.9       473.7       -29.2       541.2       389.4           -28.0
 Raw Material                                                                                    Raw Material
                            215.5       217.5         0.9        197.6      190.7         -3.5                           401.7       309.0       -23.1       369.1       276.0           -25.2
 Consumed                                                                                        Consumed
 Employee benefits                                                                               Employee benefits
                              29.2       25.6       -12.0         21.9        18.9      -13.6                              55.9       42.1       -24.6        41.6        31.8           -23.6
 Exps.                                                                                           Exps.
 Power & Fuel                36.2        31.1        -14.0        19.5       16.4       -15.7    Power & Fuel             70.0        37.3       -46.8        39.5       19.6            -50.4
 Other Expenses              46.9        28.7        -38.7        35.3       20.3       -42.5    Other Expenses           77.9        40.2       -48.4        57.9       29.1            -49.7
 EBITDA                      30.3        41.8         38.0        15.1       31.3       107.3    EBITDA                   65.4        45.8       -30.0        33.4       33.0             -1.2
 EBITDA Margin               8.5%       12.1%            -        5.2%      11.3%           -    EBITDA Margin            9.7%        9.7%           -        6.2%       8.5%                -
 Depreciation                  7.5         7.3        -3.1          4.3        4.5        5.1    Depreciation             15.2        14.8        -2.5          8.5        9.4            10.6
 EBIT                        22.8        34.5         51.3        10.8       26.8       148.1    EBIT                     50.2        31.0       -38.2        24.8       23.6             -4.8
 EBIT Margin                 6.4%       10.0%            -        3.7%       9.7%           -    EBIT Margin              7.5%        6.5%           -        4.6%       6.1%                -
 Other Income                  1.1         0.4       -62.7          0.2        0.0      -85.5    Other Income               1.9         0.6      -66.2          0.3        0.1           -60.2
 Finance Cost                  8.7         8.4      -2.8%           3.9        3.6       -6.6    Finance Cost             17.3        16.7        -3.7          7.8        7.6            -2.1
 PBT                         14.1        26.1         84.9          6.9      23.2       234.3    PBT                      32.8        14.3       -56.6        17.0       16.0             -6.0
 PBT Margin                  3.9%        7.6%            -        2.4%       8.4%           -    PBT Margin               4.9%        3.0%           -        3.1%       4.1%                -
 Tax Expenses                  0.2         5.7           -         -1.6        5.0     -415.4    Tax Expenses               6.7         2.7      -60.2          2.2        3.1            45.5
 Net Profit                  13.9        20.4         46.1          8.5      18.2       114.1    Net Profit               26.1        11.6       -55.6        14.9       12.9            -13.4
 Net Profit Margin           3.9%        5.9%            -        2.9%       6.6%           -    Net Profit Margin        3.9%        2.4%           -        2.7%       3.3%                -
 Minority Interest             1.9         0.3           -            -          -          -    Minority Interest          3.7        -0.7          -            -          -               -
 Associate / JV                0.7        -0.2           -            -          -          -    Associate / JV             1.6         0.1          -            -          -               -
 OCI                          -0.1        -0.1           -         -0.1        0.0          -    OCI                       -0.2        -0.1          -         -0.2       -0.1               -
 Total                                                                                           Total
 Comprehensive               12.6        19.8        57.2          8.4        18.1      115.5    Comprehensive             23.8       12.3       -48.3        14.7        12.8           -12.9
 Income                                                                                          Income

Investor Presentation                                                                                                                                                     Previous   6   Next
Making Life More Beautiful Worldwide. - INVESTOR PRESENTATION Q2FY21 - AGL Tiles
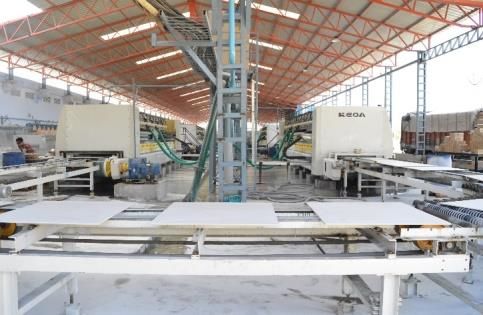
AGL – CONSOLIDATED PERFORMANCE

                         Q2-FY2020 vs Q2-FY2021 VALUE (Rs. In Crores)                                                         120
                                                                                                                                        Q2-FY2020 vs Q2-FY2021 BY GEOGRAPHY In (%)
                                         7.4
          400 .0

                                                                                                   12.7
                                                                3.2
                                                                                                                              100

          350 .0

                                        69.1                                      21.8                            4.3
          300 .0

                                                                                                                                                    30                    31
          250 .0
                                                               29.8                                               21.0         80

                                                                                                                                                    11                     10
                                                                                                   163.9
                                                                                                                               60

                                       125.1
          200 .0

          150 .0

                                                                                                                               40                   30                     28
          100 .0

                                        58.0                                                       57.8
                                                                                                                                                                           31
                                                                                                                               20

            50. 0

                                        64.3                                                       62.8                                             29
             0.0                                                                                                                0

                                   Q2-FY2020                                                  Q2-FY2021                                      Q2-FY2020                  Q2-FY2021
     AGL            Associate      Trading         Composite Marble                #Quartz Slabs     Power Grace    Others*                 North        South   East       West

                                                                                                                               120

                          6M-FY2020 vs 6M-FY2021 VALUE (Rs. In Crores)                                                                  6M-FY2020 vs 6M-FY2021 BY GEOGRAPHY In (%)
         800 .0

                                       12.2
                                                                                                                               100

         700 .0

                       5.9                                                                                                      80
                                                                                                                                                    31                     27
         600 .0

                                      131.0                                                        16.6                                                                    11
         500 .0

                                                            51.5                     5.8                                        60
                                                                                                                                                    11
                                                                                                                  27.8
                                                                                                                                                                           32
         400 .0

                                      229.4                                        26.6                                         40
                                                                                                                                                    30
                                                                                                   226.6
         300 .0

                                      111.4
         200 .0

                                                                                                   80.9
                                                                                                                                20

         100 .0
                                                                                                                                                    29                     31
           0.0
                                      127.5                                                        89.4                             0

                                  6M-FY2020                                                   6M-FY2021                                      6M-FY2020                  6M-FY2021
       AGL          Associate       Trading        Composite Marble                #Quartz Slabs    Power Grace    Others*                  North        South   East       West
 *Includes Sanitaryware         # Excluding revenues from Camrolla Quartz in Q2 & 6MFY21
Investor Presentation                                                                                                                                                                Previous   7   Next
Making Life More Beautiful Worldwide. - INVESTOR PRESENTATION Q2FY21 - AGL Tiles
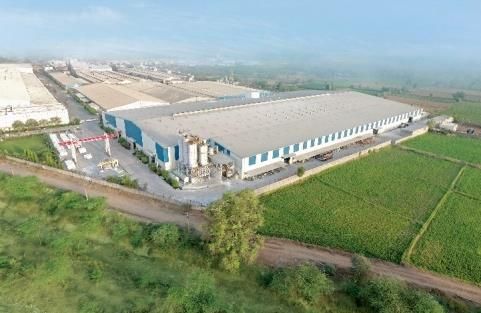
AGL - CONSOLIDATED SEGMENTAL REVENUES & BREAKUP OF TILES (In %)

                      Q2-FY2020 vs Q2-FY2021 SEGMENTAL REVENUES                                                            6M-FY2020 vs 6M-FY2021 SEGMENTAL REVENUES
                                                                                                                  120
           120

                                                                                                                                                                                          4
           100

                        2                                    1                4                          1
                                                                                                                  100

                                                                                                                                 1                      2                                               1
                                          19                                                 6                                             19                             6                                    6
            80
                                                                                                        6          80

                                                             8                                                                                          8
            60                                                                                                     60

            40

                                                                                             83                    40

                                                                                                                                                                                          83
                                          70                                                                                               70
            20                                                                                                     20

             0                                                                                                      0

                                 Q2-FY2020                                           Q2-FY2021                                         6M-FY2020                                  6M-FY2021
                  Tiles        Composite Marble                  #Quartz Slabs     Power Grace         Others            Tiles       Composite Marble         #Quartz Slabs     Power Grace         Others

           120
                 Q2-FY2020 vs Q2-FY2021 REVENUE BREAK UP OF TILES                                                 120

                                                                                                                        6M-FY2020 vs 6M-FY2021 REVENUE BREAK UP OF TILES
                                                                                                                  100

                                                                                                                                           18                                             20
           100

                                          19                                                 21                    80

            80

                                          13                                                                                               15                                             14
                                                                                             14                    60

            60

                                          32                                                 34                                            32                                             35
                                                                                                                   40

            40

                                          36                                                                                               35
                                                                                                                   20

                                                                                             31                                                                                           31
            20

             0                                                                                                      0

                                    Q2-FY2020                                         Q2-FY2021                                        6M-FY2020                                   6M-FY2021
                 Ceramic        Glazed Vitrified Tiles            Polished Vitrified Tiles       Double Charged         Ceramic      Glazed Vitrified Tiles    Polished Vitrified Tiles       Double Charged
# Excluding revenues from Camrolla Quartz in Q2 and 6MFY21
Investor Presentation                                                                                                                                                                               Previous   8   Next
Making Life More Beautiful Worldwide. - INVESTOR PRESENTATION Q2FY21 - AGL Tiles
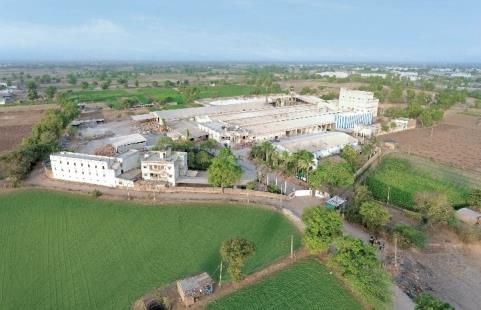
AGL - CONSOLIDATED EXPORTS AS PERCENTAGE OF SALES

                                                                                  Rs. In Crores   EXPORTS AS PERCENTAGE OF SALES
                               Exports     Total Sales      % of Sales
                                                                                                   o   Exports as a percentage of Sales has been consistently improving over the last 3 years
                   19.6%                                                                               in Tiles and Quartz Slabs.

                                             13.8%                                                 o   For the year FY-2020, AGL consolidated achieved Exports growth of 20 percent of the
                                                                         17.6%                         Total Sales (Rs. 240 Crores, which included Camrola turnover of Rs. 70 Crores) as
                 1,224.5                                                                               compared to 13 percent growth achieved in the year FY-2019 (Rs. 155 Crores).

                                             668.9                       473.7                     o   USA has imposed anti-dumping and countervailing duties upto 350 percent on Tiles
                                                                                                       and upto 700 percent on Quartz Slabs on imports from China. This step will boost
                    240.0                     92.0                        83.2                         AGL Exports to USA tremendously.
                   FY2020                  6M FY2020                  6M FY2021

                                                                                  Rs. In Crores
                                  Export     Sales       % of Sales                               EXPORTS AS PERCENTAGE OF SALES
                   14.5%                                                 15.6%                     o    COVID-19 severely impacted the movement of goods and services across the World
                                                                                                       from the first week of March 2020.

                                                                                                   o   Exports as the Total percentage of Sales were at 15.6 percent
                    356.9                                                344.3                         (Q2-FY-2021) as compared to 14.5 percent during Q2-FY-2020. Exports as the Total
                                             23.8%                                                     percentage of Sales were higher at 23.8 percent for (Q1-FY-2021).

                                             129.4
                        51.4                  30.8                        52.3
                Q2 - FY2020                Q1 - FY2021                Q2 - FY2021

Investor Presentation                                                                                                                                                          Previous   9   Next
Making Life More Beautiful Worldwide. - INVESTOR PRESENTATION Q2FY21 - AGL Tiles
AGL – INDUSTRY DYNAMICS - INDIA
                                                                                                                             (Rs. In Crores)
                                     Tiles Market                                        Quartz Slabs Market
                                      Rs. 35,000                                              Rs. 1,000

                        Organised                     Unorganised            Organised                         Unorganised
                        Rs. 15,000                     Rs. 20,000             Rs. 800                            Rs. 200

        Listed Majors         Unlisted                                  Listed Majors          Unlisted           Baba Quartz & Morbi
                                                    Morbi & Others
          Rs. 10,000          Rs. 5,000                                     Rs. 500            Rs. 300                 & Others

   Company                                   Company                 Company                              Company
   Kajaria Ceramics                          RAK Ceramic             Pokarna                              Classic Marble
   Prism Johnson                             Simpolo Ceramics        Asian Granito                        Antique Quartz
   Somany Ceramics                           Qutone Ceramic          Others                               Others
   Asian Granito                             Varmora Tiles
   Cera Sanitaryware                         Sunhearrt Ceramik
   Orient Bell                               & Others
   Nitco

Investor Presentation                                                                                                        Previous   10   Next
MARKET SHARE OF AGL AND OTHERS IN TILES & QUARTZ SLABS BUSINESS

                   Tiles Market Share Percentage          Tiles Organised Market Share Percentage          Tiles Listed Majors Market Share Percentage
                                    `
                                                                                                         Nitco                                Orient Bell
                                                                                                          6%                                      6%
                                                                                                                      AGL         Kajaria
                        Organised                                   Unlisted                                          12%          28%
                          43%                                        33%         Listed
                                                                                                                    Somany
                               Unorganised                                       Majors
                                                                                                                      17%      Prism
                                  57%                                             67%                                     Cera 18%
                                                                                                                          12%

           Quartz Slabs Market`Share Percentage         Quartz Slabs Organised Market Share Percentage   Quartz Slabs Listed Majors Market Share Percentage

                                          Unorganised                                                    Others
                                             20%                                                          1%
                                                                    Unlisted                                            AGL
                                                                                  Listed                                36%
                                                                     37%                                                          Pokarna
                                                                                  Majors
                          Organised                                                63%                                              63%
                            80%

Investor Presentation                                                                                                                          Previous   11   Next
AGL - BATHWARE INDUSTRY DYNAMICS - INDIA (SANITARYWARE & C.P. FITTINGS)

                                                                                           (Rs. In Crores)
  AGL Focus                                      Rs. 5,000 + Rs. 9,000 Industry                                     Bathware Market Share Percentage
  1.      Price Points                           (Sanitaryware + C.P. Fittings)
  2.      One stop solution                                                                                                                        Unorganised
  3.      Mass Retail Volumes                                                                                Organised                                46%
  4.      Govt. & Inst. Contracts                                                                              54%
                                            Organised                        Unorganised
                                            Rs. 7,500                         Rs. 6,500

                                                                                                                 Bathware Organised Market Share Percentage

                            Listed Majors        Unlisted                           North & Morbi
                                                                                                                                                            Listed
                              Rs. 2,500          Rs. 5,000                             Cluster
                                                                                                                                                            Majors
                                                                                                             Unlisted                                        33%
                                                                                                              67%

                        Company                                 Company
                                                                Jaguar
                        HSIL                                    Kohler
                        Cera Sanitaryware                       American Standard                            Bathware Listed Majors Market Share Percentage
                        Kajaria Ceramics                        Jacuzzi                                                                           Somany
                                                                                                               Kajaria
                        Somany Ceramics                         Colston                                                                             7%
                                                                                                                 7%
                                                                Rocca
                                                                TOTO
                                                                Durovit
                                                                Eros                                         Cera
                                                                                                                                                                HSIL
                                                                RAK                                          37%
                                                                                                                                                                49%

Investor Presentation                                                                                                                                Previous    12    Next
AGL INDIA – GUJARAT OFFICE & PLANT LOCATIONS
                                                                                                          Himmatnagar Plant – 1 (Wall)       Himmatnagar Plant – 2 (Vitirified)                 Himmatnagar Plant – 3
                           Ahmedabad Head Office

                                  Mehsana              Idar

                                                      Himmatnagar
                             Head Office                                                                     Himmatnagar Plant - 4                    Morbi Plant - 1                              Morbi Plant - 2

                        Morbi                Dholka

                                                                                                                Dholka Plant - 1                    Mehsana Plant - 1                               Idar Plant - 1

     Morbi                                            Dholka
     Number of Plants – 2                             Number of Plants – 1
     Gas Price – Rs. 33/SCM                           Gas Price-Rs. 12/SCM
     Consumption - 10.4 Million SCM/P.A.              Consumption - 3.16 Million SCM/P.A

                                                  Mehsana
      Himmatnagar                                 Number of Plants – 1                     Idar
      Number of Plants – 4                        APM-Rs. 10/SCM                           Number of Plants – 1
      Gas Price - Rs. 32/SCM                      Consumption - 16.29 Million SCM/P.A      Gas Price-Rs. 32/SCM
      Consumption – 10.70 Million SCM/P.A         Tender Price- Rs. 21/SCM                 Consumption - 2.61 Million SCM/P.A

                    200 Km                                        50 Km                                    75 Km                            45 Km                                                 36 Km
  Head Office                        Morbi       Head Office                     Mehsana   Head Office                        Himmatnagar                       Idar              Head Office                           Dholka

Investor Presentation                                                                                                                                                                                        Previous   13   Next
GLOBAL PRESENCE - EXPORTS

                                  GLOBAL FOOTPRINTS ACROSS ~   100 COUNTRIES

Investor Presentation                                                          Previous   14   Next
WORLD CERAMIC MARKET

               Top 10 Manufacturing Countries (~Million Sq. Mtrs.)                    Top 10 Importing Countries (~Million Sq. Mtrs.)
                        Iran (383
                                      Turkey (335                                                Thailand (57
                        MSM), 4%                       Egypt (300              Israel (61
                                       MSM), 3%                                                   MSM), 6%
                                                       MSM), 3%                MSM), 6%                                         USA (209
      Indonesia                                                                                                                MSM), 20%
     (383 MSM),                                                             South Korea
         4%                                                                (77 MSM), 8%

  Italy (416
  MSM), 4%
                                                                           Indonesia (77                                              Iraq (124
                                                                             MSM), 8%                                                MSM), 12%
   Spain (530                                               China (5,683
   MSM), 5%                                                 MSM) , 54%
                                                                           Philippines (91
                                                                             MSM), 9%                                              Saudi Arabia
       Vietnam                                                                                                                     (113 MSM),
     (602 MSM),                                                                                                                       11%
          6%                                                                        Germany                          France (108
               Brazil (793                  India (1,145
                                                                                 (106 MSM), 10%                      MSM), 11%
               MSM), 8%                     MSM), 11%
 Data as per ICTAS
Investor Presentation                                                                                                                   Previous   15   Next
AGL – PRODUCT PORTFOLIO

     1      Glaze Vitrified Tiles       2   Double Charged

     3      Polished Vitrified Tiles    4   Ceramic Tiles

                                                                          TILES                                   1    Multi-Colour Quartz

                                                                                                                  2    E-Stone

              1         Sanitaryware
                                                             BATHWARE               QUARTZ SLAB
              2         C.P. Fittings

                                                                        COMPOSITE
                                                                         MARBLE

                                                                                                  1   Multi-Colour Marble         2    Nano Crystal Marble

                                                                                                  3   Imported Natural Marble     4    Onyx Marble

Investor Presentation                                                                                                                           Previous   16   Next
AGL - MANUFACTURING CAPACITIES

                                                                                                                         Capacity Per
                                           Strategic Location Proximity                                                    Annum            Water
                                                                                                         Product
                                           to Raw Material sources and                                                   (Million Sq.     Absorption
                                                 Ports for Exports                                                         Mtrs.)

                                                                                                Ceramic Wall                       4.95             15-18%

                        Healthy Capacity                                    Green Energy        Ceramic Floor                      4.46             15-18%
                         utilisation at                                   plants – All plants
                              86%                                           based on Gas        Glaze Vitrified Tiles              4.95
AGL TODAY

                                                                    Shareholder Value
                                                                        Creation

                                                           Ranked amongst
                                                                                  Exporting in approx.
                                                       the   Top   Ceramic
                                                                                         100
                                                        Tiles Company in
                                                                                       countries
                                                               India

                                         World’s             Debt to Equity
                                                                 ratio
                                                                                          9
                                       Largest Kiln
                                                           has improved from
                                                                                   State of the Art       2,400+
                                            1st            0.77 to 0.59      in
                                                                                   Manufacturing
                                                                                   Facilities across
                                                                                                         Team Strength
                                           in India         the last four years        Gujarat

                         Rs. 1,225                    14                                       Incorporating
                             Crores          offices around the          6,500+               Digitisation and       1,400+
                          Consolidated        country &    303          touch points            E-Commerce               Design’s
                         Revenue in 2020        Showrooms

Investor Presentation                                                                                                               Previous   18   Next
ENCHANCING STAKEHOLDERS VALUE - SWASTIK

  1. Future growth through                                                                            Investing in                   Innovate      9. Improving all major financial and
                                                                                      Discretionary     People.        Logistic        and
     Inorganic means                   Effective                                          Cost           Future                     Introduce         liquidity ratio
                                      Leadership                                       Reductions       Business     Integration       new
  2. Refinancing / Realigning of
                                                                                                        Leaders                    technology      10. Partnering strategic JV with world
                                                                                                                                                       majors
     the Loans
                                                                                                                                                   11. Dedicated Team of Professionals
                                     Operational                                        Focus on
  3. Increase Exports multi-folds     Efficiency                                      B2C segment                                                      along with promoters to support all
                                                                                                                                                       future inorganic growth
  4. Reducing cost of production
                                                                                                                                                   12. Expanding business overseas by
  5. Emphasis on Brand Building                                                          Good                                                          setting up distribution centers,
                                        Agility &                                      Corporate
     Exercises                       Responsiveness                                   Governance
                                                                                                                                                       warehouses and marketing/sales
                                                                                                                                                       offices
  6. Focusing sales on high margin
                                                                                                                                                   13. Re-aligning of assets to enhance
     verticals like Quartz Slabs,
                                                                       Built Strong    Employee        Prudent       Appropriate                       shareholders value
     Bathware and Glaze Vitrified    Restructuring       Brand          Business       Efficiency      Capital          risk
                                                                                                                                    Expanding
                                       of Loans       Establishments                    Program                                    the markets     14. Discretionary cost cut to manage
     tiles                                                              Verticals                     Allocation     Management
                                                                                                                                                       effective EBIDTA Margins like travel
  7. Optimising costs and                                                                                                                              expenses, conferences, office
     increasing market share by                                                        Focus on                                    Reduce O/S          expenses, etc.
     bringing more high volume                                                         Inorganic                                    Debtors
                                                                                        Growth                                        Cycle        15. Continue creeping acquisitions and
     products
                                                                                                                                                       increase in dividend policy
  8. Dissemination of information                                                                                                                  16. Appointing risk management
     through appropriate                                                                Export                                       Reduce            committee to tackle company’s past
                                                                                        Growth                                     Power/Fuel
     communication channels and                                                                                                       Costs            & future legal and financial hurdles
     continuous updates on
                                                                                                                                                   17. Effective leadership are inspirers,
     company matters to stock
                                                                                                                                   Incorporation       crisis handlers, changing agents,
     exchanges                         Target JVs      Improve         Enhanced       Reduction of
                                         with          Liquidity          R&D           Material
                                                                                                                                         of            growth seekers, transparent
                                     international                                                                                 Professionals
                                        majors          Ratios          facilities       Costs                                       /Industry         communications, retention of key
                                                                                                                                     Stalwarts         talent
Investor Presentation                                                                                                                                                          Previous   19   Next
AGL - CONSOLIDATED FINANCIAL OVERVIEW

                          Net Revenue (Rs. in Crores)                                     Net Worth (Rs. in Crores)
                                                                                                                              517.4
                                    1,171.4      1,186.7   1,224.5                                     435.1       451.1
                        1,136.8                                                         423.4
            993.9                                                              375.6

           FY2016       FY2017      FY2018       FY2019    FY2020              FY2016   FY2017         FY2018      FY2019     FY2020

                        EBITDA & EBITDA Margin (%)                                              PAT & PAT Margin (%)
                                      12                                                                 4.6
                         11.9
   160                                                               14
                                                                          60                                                                    5

   140
                                                                                         4.2                                                    4.5
                                                                     12

   120
              9.1                                           9.6           50

                                                                                                                                3.4             4

                                                                     10
                                                                                                                                                3.5

   100
                                                  7.3                8
                                                                          40

                                                                                2.4                                                             3

   80
                                                                          30                                                                    2.5

   60
                                                                     6
                                                                                                                       1.7                      2

                                                                          20

                                                                                                                                                1.5
                                                                     4

   40

                                                                                                                                                1

                                                                          10
                                                                     2
   20

              90.9       127.1        139         86.5     117.7                24.3     45.1           52.6           20.6    42.0             0.5

    0                                                                0     0                                                                    0

            FY2016      FY2017      FY2018       FY2019    FY2020              FY2016   FY2017         FY2018      FY2019     FY2020

Investor Presentation                                                                                                         Previous   20   Next
AGL - CONSOLIDATED FINANCIAL OVERVIEW

                                          17.5                                                0.83
                                                                                                            0.77
   250                                                                     20. 0   500                                                                                          0.9

                                                                                                                             0.74              0.74
                        15.0
                                                                           18. 0
                                                                                   450
                                                                                                                                                                                0.8

   200
                                                                  14.0     16. 0

                                                                                                                                                                0.6
                                                          6.9
                                                                                   400

                                                                                                                                                                                0.7

                                                                           14. 0
                                                                                   350

                                                                                                                                                                                0.6

   150

             8.1                                                           12. 0

                                                                                   300

                                                                                                                                                                                0.5

                                                                           10. 0

                                                                                   250

                                                                                                                                                                                0.4

   100                                                                     8.0

                                                                                   200

                                                                           6.0                                                                                                  0.3

                                                                                   150

    50                                                                     4.0
                                                                                                                                                                                0.2

                                                                                   100

           125.2        140.7            143.6          148.9      172     2.0

                                                                                    50

                                                                                               180          300             323.1              333.8          320.6             0.1

     0                                                                     0.0

                                                                                     0                                                                                          0

           FY2016       FY2017           FY2018          FY2019   FY2020                      FY2016       FY2017            FY2018          FY2019           FY2020
                                  BVPS in Rs.     EPS in Rs.                                           Total Debt (Rs. In Crores)      Debt to Equity Ratio

                                          1.46                                                                               12.1
                        1.34
   20                                                                      1.6           25                                                                                     14

                                                                                                           11.29
                                                                  1.18
   18

                                                                           1.4

                                                                                                                                                                                12

                                                                                         20

                                                                                                                                                               8.71
   16

                                                                           1.2

   14

                                                         0.91                                                                                                                   10

   12
                                                                           1

                                                                                         15

                                                                                               6.82
   10
            0.67                                                           0.8
                                                                                                                                               4.62
                                                                                                                                                                                8

                                                                                                                                                                                6

    8                                                                                    10

                                                                           0.6

    6
                                                                                                                                                                                4

                                                                           0.4

    4                                                                                     5

            7.18        10.81            11.72          11.67     14.15                        4.34        19.07            19.53              10.64          11.17
                                                                                                                                                                                2

                                                                           0.2

    2

    0                                                                      0              0                                                                                     0

           FY2016       FY2017           FY2018         FY2019    FY2020                      FY2016       FY2017           FY2018             FY2019         FY2020
                               EV/EBITDA (x)      EV/SALES (x)                                                        ROCE(%)         ROE(%)

Investor Presentation                                                                                                                                         Previous   21   Next
AGL-TREND SETTER WITH MANY INDUSTRY ‘FIRST’

                                    INNOVATION IS THE KEY FOR FUTURE GROWTH

     FIRST TO INTRODUCE
                              30 MM THICKNESS     PIONEER IN BEST     INTRODUCE LARGE
      450X450 OUTDOOR                                                                      INTRODUCE SLIMGRES
                               MULTI COLOUR          WATER JET        FORMAT WALL AND
       TILE WITH 12MM                                                                             TILES
                                QUARTZ SLAB         TECHNOLOGY          VITRIFIED TILES
          THICKNESS

                                                 INTRODUCE 16MM       INTRODUCE WORLD’S
       FIRST IN INDIA TO
                             INTRODUCE GRESTEK   THICK HEAVY DUTY       WHITEST DOUBLE      FIRST TO ESTABLISH
        HAVE DIGITAL 9
                              XXL LARGE FORMAT    VITRIFIED TILES –     CHARGE VITRIFIED     ONLINE VITRIFIED
       COLOUR PRINTING
                                     TILES            GRESTEK            TILES - CARRARA       TECHNOLOGY
         TECHNOLOGY
                                                    HARDSTONE                 WHITE

Investor Presentation                                                                                  Previous   22   Next
AGL - GROWTH DRIVERS

  1                                       2                                       3                                        4

                                                                                   Improve return ratios - RoCE and        Build brand as a Strong Asset which
       Focus on value generation and      Export Vertical to be scaled up with
                                                                                    RoE by focusing on volume and          consumers recall leading to sustain
             High-end products              USA imposing duties on China
                                                                                             price growth                                growth

  5                                       6                                       7                                        8
                                                                                        Achieving sustainable and
   Inorganic growth as tool to capture
                                                                                  profitable growth through judicious
       market share. Invest in high        Improve sales per distributors and                                               Wastage reduction in the areas of
                                                                                  and intelligent allocation of capital,
   yielding growth businesses offering           sales per employee                                                          material usages and Inventory
                                                                                   balanced product mix, diversified
          operational excellence
                                                                                  distribution and product innovation

  9                                       10                                      11                                       12
       Risk management – In-terms of
                                              Increasing share of Private Label
      dictating, eliminating, managing,                                                Conversion of Fixed cost in to
                                               business and higher same store                                                   E-Commerce and Digitisation
        mitigating the uncontrollable                                                         Variable cost
                                                           format
          internal and external risks

Investor Presentation                                                                                                                               Previous   23   Next
MARQUEE CLIENTELE

Investor Presentation            Previous   24   Next
GOVERNMENT PROJECTS

Investor Presentation              Previous   25   Next
CHANGE IN BUSINESS STRATEGY FROM B2B TO B2C

     Mapping Towns with              Initiative to increase    On time delivery to        Focusing on Franchise       As part of strategy      Key accounts which will
    population of more than         Direct Interaction with   customers across the          Owned Franchise       company have started to     further boost company’s
            1 lakh.                        Customers.               markets.               Operated exclusive      focused on government              volume.
                                                                                              showrooms.                   projects

                              FY2012                                                                                         FY2020

                                                              Institutional (Malls, Commercials Space, Real
                                                              Estate Developers, Private Airports, Multiplex,             15%
                              10%
                                                              Hotels, Clubs)

                        20%                                   Retail (Individual Homes,                                                 46%
                                    70%                       Offices and Small Shops)                                   39%

                                                              Government (Govt. &
                                                              Semi Govt. Like AAI, EIL,
                                                              CPWD, NBCC etc)

Investor Presentation                                                                                                                                     Previous   26   Next
CERTIFICATIONS & AWARDS

   Art Of Architecture FAAA          ISO 9001 2015 &          GRIHA Council AGL            Gujarat Brand             Readers Digest - Trusted           IGBC - 2019
  Dialogues Ahmedabad 2017          14001 2015 Dalpur            JULY - 2019          Leadership Award - 2018        Consumer Brand - 2019

              Expert Choice Award       Fortune India Next 500        Gujarat Brand Leadership                  Mega Brand                        Asia's Most
                                     (Summit West) Asian Granito               Award                                                            Promising Brand

Investor Presentation                                                                                                                                        Previous   27   Next
AGL - CORPORATE STRUCTURE AND SHAREHOLDING

                                                                                                                          Top Shareholders as on 30th September, 2020
                             ASIAN GRANITO INDIA LIMITED
                                                                                               Sundaram Mutual Fund A/c Sundaram Small Cap Fund                                        2.47%
           ASSOCIATE CO. – ASTRON PAPER & BOARD MILL LIMITED (18.87%)
                                                                                               Sundaram Alternative Opportunities Fund - Nano Cap Series I                             1.29%

     AGL INDUSTRIES                 AMAZOONE          CRYSTAL CERAMIC       AGL GLOBAL TRADE                                 Stock Data (As on 30th September, 2020)
        LIMITED                  CERAMICS LIMITED      INDUSTRIES PVT        PRIVATE LIMITED   Market Capitalization (Rs. in Million)                                                  8,788
                                                          LIMITED
          100%                       95.3%                                       100%          Shares Outstanding (Million)                                                                 30
                                                             70%
                                                                                               Symbol (NSE/BSE)                                                    ASIANTILES/532888
                                                                                               Average Daily Volume (3 months)                                                    2,61,606
       POWERGRACE
    INDUSTRIES LIMITED
              100%                                                                                                       Relative Stock Chart (As on 10th November, 2020)

                         Shareholding Pattern as on 30th September, 2020                                                                                                               279.25

                                                                        33.25%

                        66.75%
                                                                                                                                                                                       223,317
                                 Promoter & Promoter Group         Public
Source: BSE
                                                                                               Source: Thomson Reuters
Investor Presentation                                                                                                                                                       Previous   28   Next
AGL - MILESTONES
                                                                                                                                                                      Launched Range
                                                                                                                                                                      ‘RAINBOW GLITZ’
                                                                                                                                            Amalgamation              & ECO BLANCO;
                                                                                                                                            of Artisique
                                                                                                                                            Ceramic Pvt
                                                                                                                                                                      Opened 18,000                                2020
                                                                                                                                                                      Sq. Ft. Showroom
                                                                                                                                            Ltd with Asian
                                                                                                                                            Granito Ltd
                                                                                                                                                                      in Ahmedabad            2019
                                                                                                           Introduced                                                                                           Launched
                                                                           Commenced                       6-colour
                                                                                                                                            (AGL).                           2018                               Sanitaryware
                                                                                                           digital tile                                                                      Launched
                                                                           production of
                                                                                                           printing;
                                                                                                                                                             2017                            Special effect
                                                                                                                                                                                                                products at
                                                                           composite                                                                                                                            Himmatnagar
                                                                           marble slabs;                   Launched
                                                                                                           50th AGL
                                                                                                                                               2016                                          Wall Tiles;        showroom
                                           Established                     New digital                                                                                                       GVT MarbleX
                                                                                                                                                             Expanded
                                           vitrified tiles                 printing                        tiles World     2015                              product
                                                                                                                                                                                             900x1800;
                                           facility at                     technology for                                                                                                    TAC Tile; Step
                                           Himmatnagar                     Ceramic Wall                         2013                                         portfolio in                    & Riser;
                                                                                                                                                             Composite                       Hardstone
                                           with 4,000 Sq.                  Tiles                                          Launched
                                           Mtrs. per day
                                                                                            2012                          double-charged
                                                                                                                                                             Marble;                         600x1200;
                                                                                                                                                             Introduce new
   AGL Group
                                           capacity                           2010                                        polished vitrified                 Multi-Colour
                                                                                            Quartz slab                   tiles; Introduced                  Quartz slab
   was
   incorporated
                                                             2008                           production;                   8-colour digital                   range
                                                                                            Launched digital              printing; AGL
   &                                        2006                                            glazed vitrified              with 8 plants
   commences
                                                                                            tiles; Introduced
   operations            2001                                Listed on Stock
                                                                                            four- colour
                                                             Exchanges.
                                                                                            digital printing
    2000                First Plant of                       Introduced
                                                                                                                              Particulars               Year 2000                Year 2020          CAGR Growth (in %)
                        Ceramic Floor                        India’s largest
                        with 2,500 Sq.                       wall tile capacity                                           Sales                   Rs. 88 Lakhs               Rs. 1,225 Crores                  40%
                        Mtrs. per day                        with 10,000 Sq.
                        capacity at Idar                     Mtrs. per day                                                Capacity                0.83 Million Sq. Mtrs.     30.47 Million Sq.                 20%
                        was set up                                                                                                                per annum                  Mtrs. per annum

Investor Presentation                                                                                                                                                                                         Previous   29   Next
ASIAN GRANITO INDIA LTD.                                                                                                                                                              S-ANCIAL TECHNOLOGIES PVT. LTD
Regd. & Corp. Office202, Dev Arc, Opp.                                                                                                                                                215, Shivshakti Industrial Estate, J.R Boricha Marg,
Iskcon Temple, S.G. Highway, Ahmedabad -                                                                                                                                              Lower Parel (E),
380015,Gujarat, India.                                                                                                                                                                Mumbai - 400011
Phone: +91-79-66125500/698,                                                                                                                                                           www.exchangeconnect.in
Fax:+91-79-66125600/66058672
E-mail: info@aglasiangranito.com
                                                                                                            Thank You
                                                                                                                                                                                      Nikunj Seth
Mr. Kalpesh Thanki – IR                                                                                                                                                               Phone: +91-9773397958
079-66125500 EXT 610                                                                                                                                                                  E-mail: nikunj@s-ancial.com
ir@aglasiangranito.com

Safe Harbor Statement:
This presentation has been prepared by and is the sole responsibility of Asian Granito India Limited (the “Company”). By accessing this presentation, you are agreeing to be bound by the trailing restrictions. This presentation does not constitute or form part of any offer or
invitation or inducement to sell or issue, or any solicitation of any offer or recommendation to purchase or subscribe for, any securities of the Company, nor shall it or any part of it or the fact of its distribution form the basis of, or be relied on in connection with, any contract
or commitment thereof. In particular, this presentation is not intended to be a prospectus or offer document under the applicable laws of any jurisdiction, including India. No representation or warranty, express or implied, is made as to, and no reliance should be placed on,
the fairness, accuracy, completeness or correctness of the information or opinions contained in this presentation. Such information and opinions are in all events not current after the date of this presentation. There is no obligation to update, modify or amend this
communication or to otherwise notify the recipient if information, opinion, projection, forecast or estimate set forth herein, changes or subsequently becomes inaccurate. Certain statements contained in this presentation that are not statements of historical fact constitute
“forward-looking statements.”

You can generally identify forward looking statements by terminology such as “aim”, “anticipate”, “believe”, “continue”, “could”, “estimate”, “expect”, “intend”, “may”, “objective”, “goal”, “plan”, “potential”, “project”, “pursue”, “shall”, “should”, “will”, “would”, or other
words or phrases of similar import. These forward-looking statements involve known and unknown risks, uncertainties, assumptions and other factors that may cause the Company’s actual results, performance or achievements to be materially different from any future
results, performance or achievements expressed or implied by such forward-looking statements or other projections. Important factors that could cause actual results, performance or achievements to differ materially include, among others: (a) our ability to successfully
implement our strategy, (b) our growth and expansion plans, (c) changes in regulatory norms applicable to the Company, (d) technological changes, (e) investment income, (f) cash flow projections, and (g) other risks.
You can also read